| Param | Original file | Final file |
|---|---|---|
| Filename | modeM0/AS1T02_084T01_9000002318_15688cztM0_level2.evt | modeM0/AS1T02_084T01_9000002318_15688cztM0_level2_quad_clean.evt |
| Size (bytes) | 452,237,760 | 68,068,800 |
| Size | 431.3 MB | 64.9 MB |
| Events in quadrant A | 2,554,193 | 429,747 |
| Events in quadrant B | 2,557,477 | 441,327 |
| Events in quadrant C | 2,693,007 | 426,794 |
| Events in quadrant D | 5,542,378 | 402,555 |
| Mode M0 | |||
|---|---|---|---|
| Quadrant | BADHDUFLAG | Total packets | Discarded packets |
| A | 0 | 10924 | 1 |
| B | 0 | 10727 | 1 |
| C | 0 | 11331 | 1 |
| D | 0 | 20084 | 1 |
| Mode M9 | |||
|---|---|---|---|
| Quadrant | BADHDUFLAG | Total packets | Discarded packets |
| A | 0 | 16 | 0 |
| B | 0 | 16 | 0 |
| C | 0 | 16 | 0 |
| D | 0 | 16 | 0 |
| Mode SS | |||
|---|---|---|---|
| Quadrant | BADHDUFLAG | Total packets | Discarded packets |
| A | 0 | 108 | 0 |
| B | 0 | 108 | 0 |
| C | 0 | 108 | 0 |
| D | 0 | 108 | 0 |
| Quadrant | Total seconds | Saturated seconds | Saturation percentage |
|---|---|---|---|
| A | 5142 | 51 | 0.991832% |
| B | 5142 | 43 | 0.836250% |
| C | 5142 | 73 | 1.419681% |
| D | 5142 | 315 | 6.126021% |
Noise dominated data is calculated using 1-second bins in cleaned event files. If a bin has >2000 counts, and if more than 50% of those come from <1% of pixels, then it is considered to be noise-dominated and hence unusable.
| Quadrant | # 1 sec bins | Bins with >0 counts | Bins with >2000 counts | High rate bins dominated by noise | Noise dominated (total time) | Noise dominated (detector-on time) | Marked lightcurve |
|---|---|---|---|---|---|---|---|
| A | 6243 | 5144 | 21 | 21 | 0.34% | 0.41% | 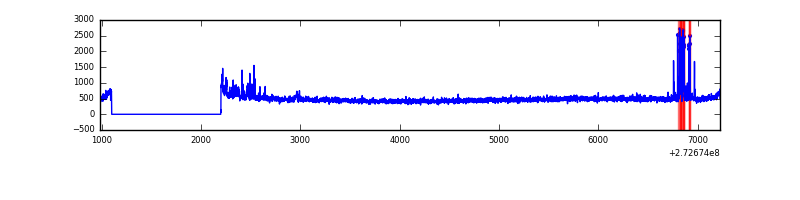 |
| B | 6243 | 5144 | 0 | 0 | 0.00% | 0.00% | 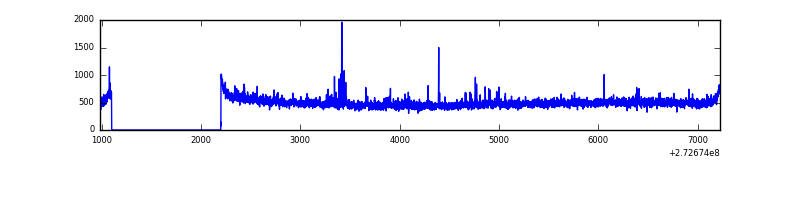 |
| C | 6243 | 5144 | 4 | 4 | 0.06% | 0.08% | 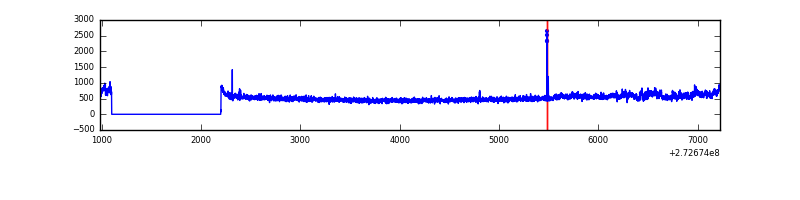 |
| D | 6243 | 5144 | 245 | 245 | 3.92% | 4.76% | 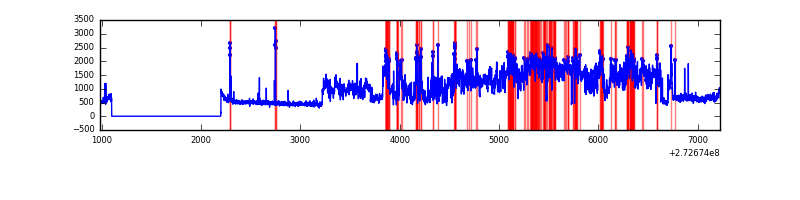 |
Top three noisy pixels from each quadrant. If the there are fewer than three noisy pixels in the level2.evt file, extra rows are filled as -1
| Pixel properties | Quadrant properties | ||||||
|---|---|---|---|---|---|---|---|
| Quadrant | DetID | PixID | Counts | Sigma | Mean | Median | Sigma |
| A | 13 | 248 | 83594 | 648.92 | 629 | 615 | 127.9 |
| A | 13 | 210 | 48475 | 374.28 | 629 | 615 | 127.9 |
| A | 4 | 2 | 5835 | 40.82 | 629 | 615 | 127.9 |
| B | 4 | 173 | 31248 | 255.15 | 631 | 617 | 120.0 |
| B | 0 | 214 | 18627 | 150.02 | 631 | 617 | 120.0 |
| B | 12 | 111 | 13684 | 108.85 | 631 | 617 | 120.0 |
| C | 3 | 233 | 199465 | 1405.73 | 607 | 614 | 141.5 |
| C | 14 | 238 | 93708 | 658.1 | 607 | 614 | 141.5 |
| C | 0 | 207 | 22286 | 153.2 | 607 | 614 | 141.5 |
| D | 1 | 52 | 3080176 | 21255.97 | 603 | 588 | 144.9 |
| D | 12 | 110 | 113749 | 781.06 | 603 | 588 | 144.9 |
| D | 10 | 70 | 34968 | 237.3 | 603 | 588 | 144.9 |
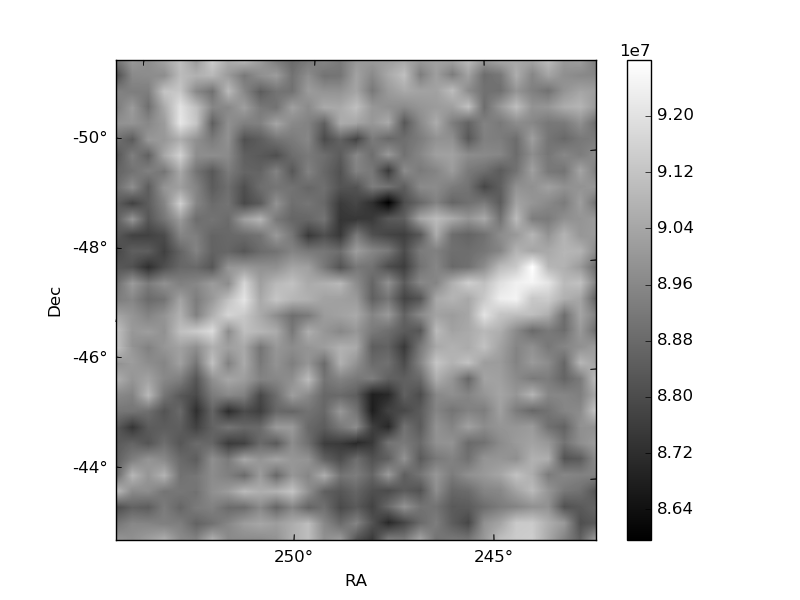
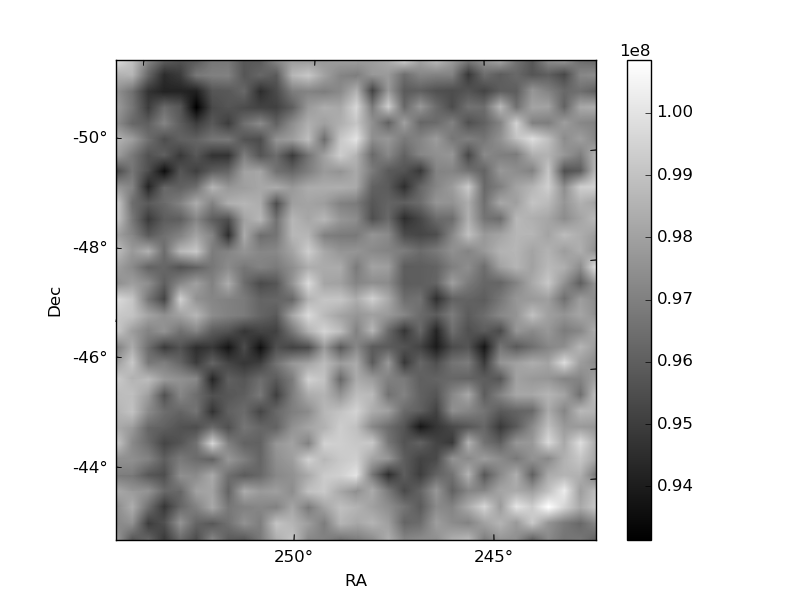
Histogram calculated using DETX and DETY for each event in the final _common_clean file
| Quadrant A |  |
 |
Quadrant B |
|---|---|---|---|
| Quadrant D |  |
 |
Quadrant C |
| Plot type | Count rate plots | Images |
|---|---|---|
| Comparison with Poisson distribution Blue bars denote a histogram of data divided into 1 sec bins. Red curve is a Poisson curve with rate = median count rate of data. |
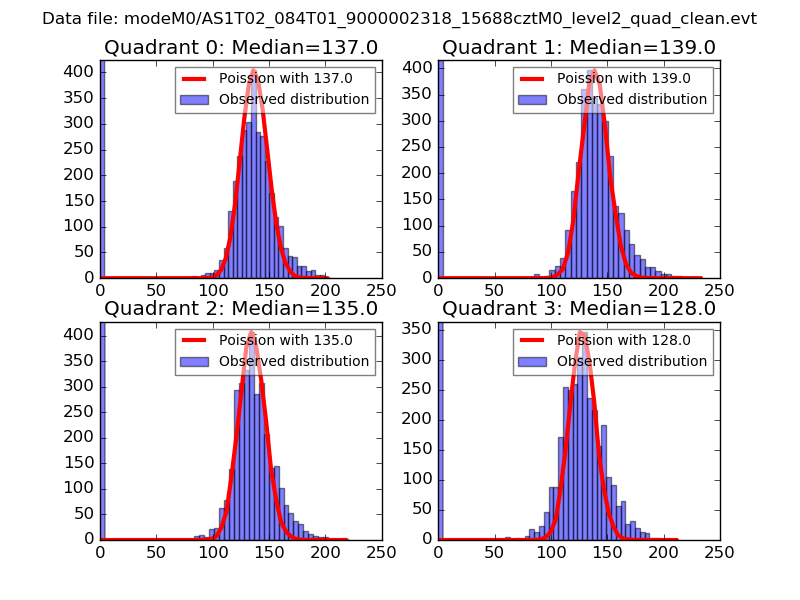 |
 |
| Quadrant-wise count rates Data is divided into 100 sec bins |
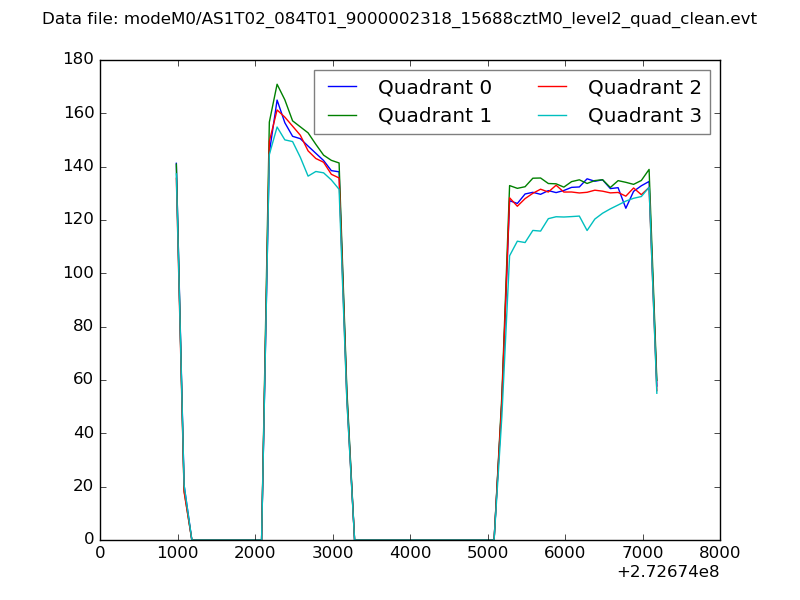 |
|
| Module-wise count rates for Quadrant A Data is divided into 100 sec bins |
 |
 |
| Module-wise count rates for Quadrant B Data is divided into 100 sec bins |
 |
 |
| Module-wise count rates for Quadrant C Data is divided into 100 sec bins |
 |
 |
| Module-wise count rates for Quadrant D Data is divided into 100 sec bins |
 |
 |
| Parameter | Plot |
|---|---|
| CZT HV Monitor |  |
| D_VDD | 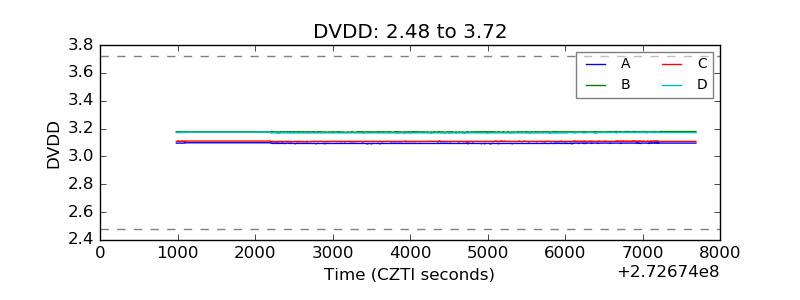 |
| Temperature 1 |  |
| Veto HV Monitor |  |
| Veto LLD |  |
| Alpha Counter |  |
| _CPM_Rate | 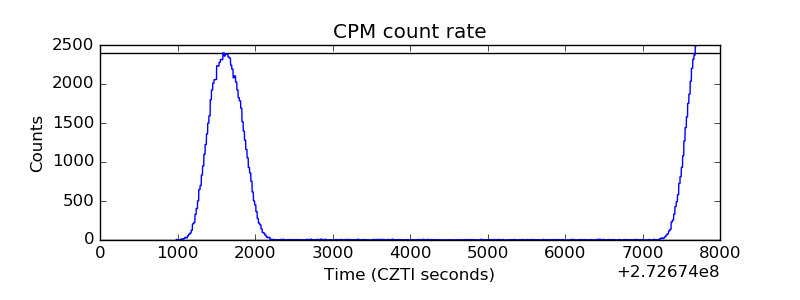 |
| CZT Counter |  |
| +2.5 Volts monitor |  |
| +5 Volts monitor |  |
| _ROLL_ROT |  |
| _Roll_DEC |  |
| _Roll_RA |  |
| Veto Counter |  |