| Param | Original file | Final file |
|---|---|---|
| Filename | modeM0/AS1T02_088T01_9000002320cztM0_level2.fits | modeM0/AS1T02_088T01_9000002320cztM0_level2_quad_clean.evt |
| Size (bytes) | 712,128,960 | 647,786,880 |
| Size | 679.1 MB | 617.8 MB |
| Events in quadrant A | 4,373,680 | 3,825,195 |
| Events in quadrant B | 4,203,154 | 3,841,385 |
| Events in quadrant C | 4,287,272 | 3,667,968 |
| Events in quadrant D | 3,677,722 | 3,258,958 |
| Mode M9 | |||
|---|---|---|---|
| Quadrant | BADHDUFLAG | Total packets | Discarded packets |
| A | 0 | 112 | 0 |
| B | 0 | 112 | 0 |
| C | 0 | 112 | 0 |
| D | 0 | 112 | 0 |
| Mode M0 | |||
|---|---|---|---|
| Quadrant | BADHDUFLAG | Total packets | Discarded packets |
| A | 0 | 151732 | 0 |
| B | 0 | 156604 | 0 |
| C | 0 | 153696 | 0 |
| D | 0 | 181601 | 0 |
| Mode SS | |||
|---|---|---|---|
| Quadrant | BADHDUFLAG | Total packets | Discarded packets |
| A | 0 | 1496 | 0 |
| B | 0 | 1496 | 0 |
| C | 0 | 1496 | 0 |
| D | 0 | 1496 | 0 |
| Quadrant | Total seconds | Saturated seconds | Saturation percentage |
|---|---|---|---|
| A | 73258 | 876 | 1.195774% |
| B | 73258 | 1077 | 1.470147% |
| C | 73258 | 1277 | 1.743154% |
| D | 73258 | 2502 | 3.415327% |
Noise dominated data is calculated using 1-second bins in cleaned event files. If a bin has >2000 counts, and if more than 50% of those come from <1% of pixels, then it is considered to be noise-dominated and hence unusable.
| Quadrant | # 1 sec bins | Bins with >0 counts | Bins with >2000 counts | High rate bins dominated by noise | Noise dominated (total time) | Noise dominated (detector-on time) | Marked lightcurve |
|---|---|---|---|---|---|---|---|
| A | 84443 | 73258 | 0 | 0 | 0.00% | 0.00% |  |
| B | 84443 | 73254 | 0 | 0 | 0.00% | 0.00% |  |
| C | 84443 | 73253 | 0 | 0 | 0.00% | 0.00% |  |
| D | 84443 | 73195 | 0 | 0 | 0.00% | 0.00% |  |
Top three noisy pixels from each quadrant. If the there are fewer than three noisy pixels in the level2.evt file, extra rows are filled as -1
| Pixel properties | Quadrant properties | ||||||
|---|---|---|---|---|---|---|---|
| Quadrant | DetID | PixID | Counts | Sigma | Mean | Median | Sigma |
| A | 0 | 29 | 4197 | 11.15 | 1137 | 1063 | 281.1 |
| A | 7 | 110 | 3512 | 8.71 | 1137 | 1063 | 281.1 |
| A | 9 | 19 | 3260 | 7.81 | 1137 | 1063 | 281.1 |
| B | 2 | 9 | 3484 | 11.03 | 1113 | 1063 | 219.6 |
| B | 2 | 8 | 2879 | 8.27 | 1113 | 1063 | 219.6 |
| B | 3 | 17 | 2746 | 7.67 | 1113 | 1063 | 219.6 |
| C | 1 | 80 | 3193 | 7.34 | 1132 | 1057 | 290.8 |
| C | 1 | 81 | 3145 | 7.18 | 1132 | 1057 | 290.8 |
| C | 12 | 241 | 2952 | 6.52 | 1132 | 1057 | 290.8 |
| D | 3 | 14 | 2768 | 6.46 | 1051 | 958 | 280.3 |
| D | 6 | 231 | 2604 | 5.87 | 1051 | 958 | 280.3 |
| D | 6 | 67 | 2575 | 5.77 | 1051 | 958 | 280.3 |
Histogram calculated using DETX and DETY for each event in the final _common_clean file
| Quadrant A |  |
 |
Quadrant B |
|---|---|---|---|
| Quadrant D | 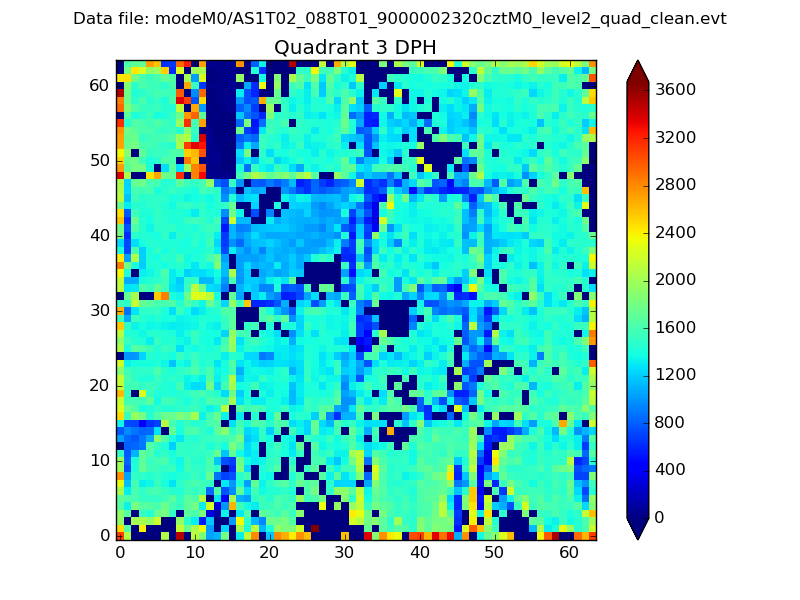 |
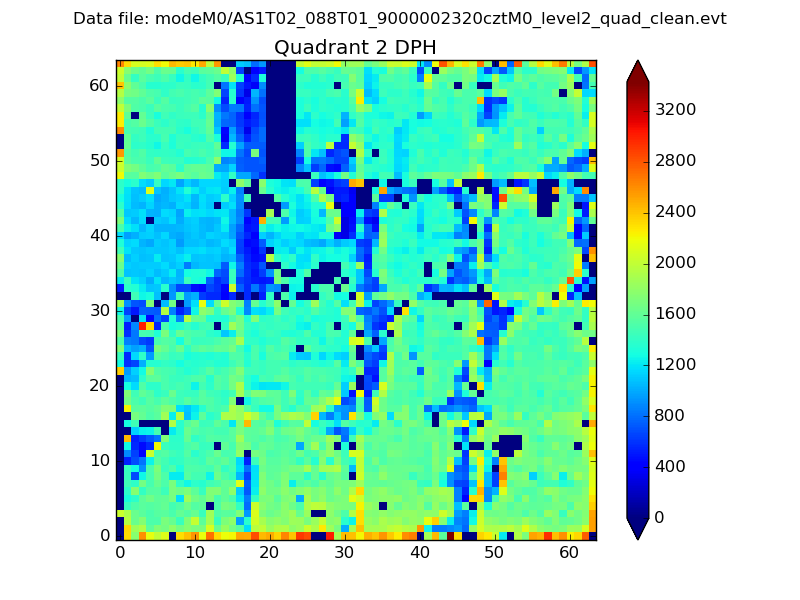 |
Quadrant C |
| Plot type | Count rate plots | Images |
|---|---|---|
| Comparison with Poisson distribution Blue bars denote a histogram of data divided into 1 sec bins. Red curve is a Poisson curve with rate = median count rate of data. |
 |
 |
| Quadrant-wise count rates Data is divided into 100 sec bins |
 |
|
| Module-wise count rates for Quadrant A Data is divided into 100 sec bins |
 |
 |
| Module-wise count rates for Quadrant B Data is divided into 100 sec bins |
 |
 |
| Module-wise count rates for Quadrant C Data is divided into 100 sec bins |
 |
 |
| Module-wise count rates for Quadrant D Data is divided into 100 sec bins |
 |
 |
| Parameter | Plot |
|---|---|
| CZT HV Monitor |  |
| D_VDD |  |
| Temperature 1 |  |
| Veto HV Monitor |  |
| Veto LLD |  |
| Alpha Counter |  |
| _CPM_Rate |  |
| CZT Counter |  |
| +2.5 Volts monitor |  |
| +5 Volts monitor |  |
| _ROLL_ROT |  |
| _Roll_DEC |  |
| _Roll_RA |  |
| Veto Counter |  |