| Param | Original file | Final file |
|---|---|---|
| Filename | modeM0/AS1T02_088T01_9000002320_15688cztM0_level2.evt | modeM0/AS1T02_088T01_9000002320_15688cztM0_level2_quad_clean.evt |
| Size (bytes) | 98,835,840 | 20,704,320 |
| Size | 94.3 MB | 19.7 MB |
| Events in quadrant A | 668,497 | 133,223 |
| Events in quadrant B | 700,271 | 139,613 |
| Events in quadrant C | 753,442 | 131,579 |
| Events in quadrant D | 781,849 | 126,595 |
| Mode M9 | |||
|---|---|---|---|
| Quadrant | BADHDUFLAG | Total packets | Discarded packets |
| A | 0 | 2 | 0 |
| B | 0 | 2 | 0 |
| C | 0 | 2 | 0 |
| D | 0 | 2 | 0 |
| Mode M0 | |||
|---|---|---|---|
| Quadrant | BADHDUFLAG | Total packets | Discarded packets |
| A | 0 | 2722 | 2 |
| B | 0 | 2815 | 1 |
| C | 0 | 3043 | 1 |
| D | 0 | 3186 | 1 |
| Mode SS | |||
|---|---|---|---|
| Quadrant | BADHDUFLAG | Total packets | Discarded packets |
| A | 0 | 26 | 0 |
| B | 0 | 26 | 0 |
| C | 0 | 26 | 0 |
| D | 0 | 26 | 0 |
| Quadrant | Total seconds | Saturated seconds | Saturation percentage |
|---|---|---|---|
| A | 1268 | 4 | 0.315457% |
| B | 1268 | 8 | 0.630915% |
| C | 1268 | 16 | 1.261830% |
| D | 1268 | 11 | 0.867508% |
Noise dominated data is calculated using 1-second bins in cleaned event files. If a bin has >2000 counts, and if more than 50% of those come from <1% of pixels, then it is considered to be noise-dominated and hence unusable.
| Quadrant | # 1 sec bins | Bins with >0 counts | Bins with >2000 counts | High rate bins dominated by noise | Noise dominated (total time) | Noise dominated (detector-on time) | Marked lightcurve |
|---|---|---|---|---|---|---|---|
| A | 1269 | 1269 | 0 | 0 | 0.00% | 0.00% | 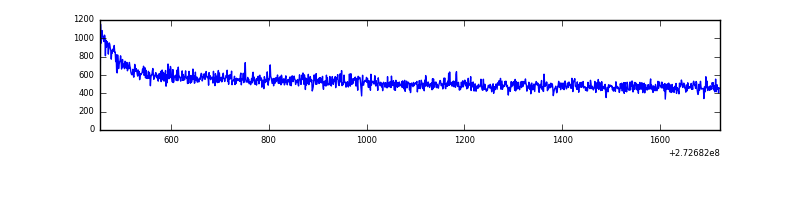 |
| B | 1269 | 1269 | 0 | 0 | 0.00% | 0.00% | 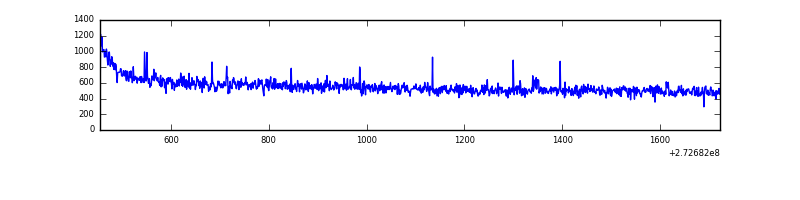 |
| C | 1269 | 1269 | 2 | 2 | 0.16% | 0.16% | 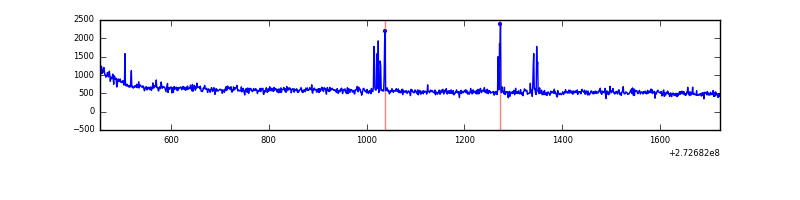 |
| D | 1269 | 1269 | 12 | 12 | 0.95% | 0.95% | 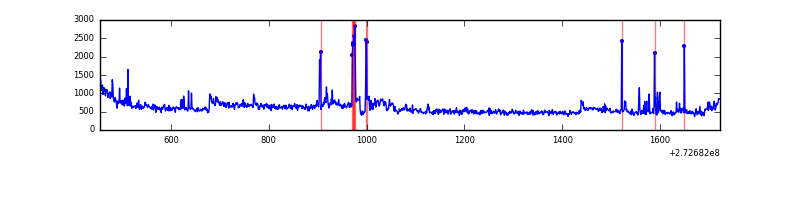 |
Top three noisy pixels from each quadrant. If the there are fewer than three noisy pixels in the level2.evt file, extra rows are filled as -1
| Pixel properties | Quadrant properties | ||||||
|---|---|---|---|---|---|---|---|
| Quadrant | DetID | PixID | Counts | Sigma | Mean | Median | Sigma |
| A | 0 | 226 | 1604 | 39.83 | 173 | 170 | 36.0 |
| A | 13 | 210 | 1380 | 33.61 | 173 | 170 | 36.0 |
| A | 12 | 194 | 1238 | 29.66 | 173 | 170 | 36.0 |
| B | 4 | 173 | 4153 | 112.01 | 178 | 174 | 35.5 |
| B | 12 | 111 | 3705 | 99.4 | 178 | 174 | 35.5 |
| B | 11 | 111 | 3097 | 82.28 | 178 | 174 | 35.5 |
| C | 3 | 233 | 35196 | 867.21 | 169 | 171 | 40.4 |
| C | 0 | 207 | 29866 | 735.24 | 169 | 171 | 40.4 |
| C | 14 | 238 | 26285 | 646.57 | 169 | 171 | 40.4 |
| D | 1 | 52 | 123820 | 2931.74 | 168 | 163 | 42.2 |
| D | 10 | 40 | 4998 | 114.63 | 168 | 163 | 42.2 |
| D | 10 | 70 | 4637 | 106.07 | 168 | 163 | 42.2 |
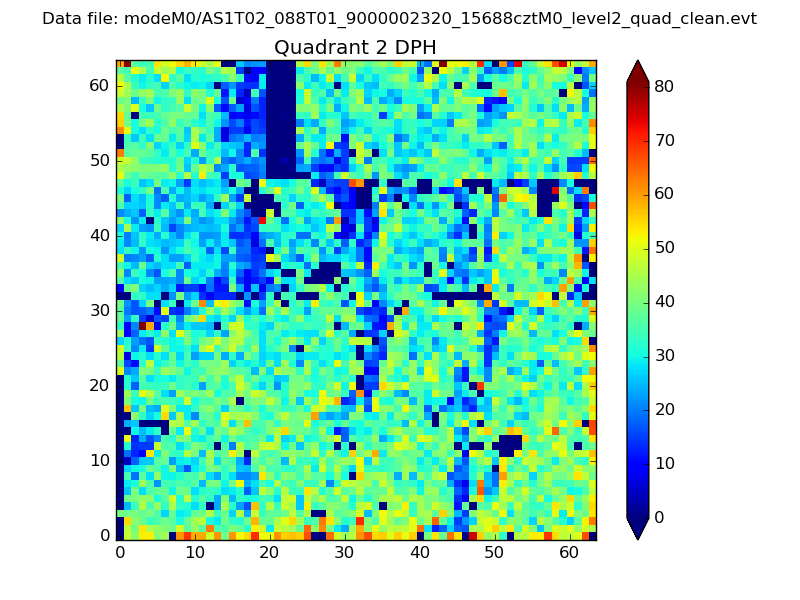
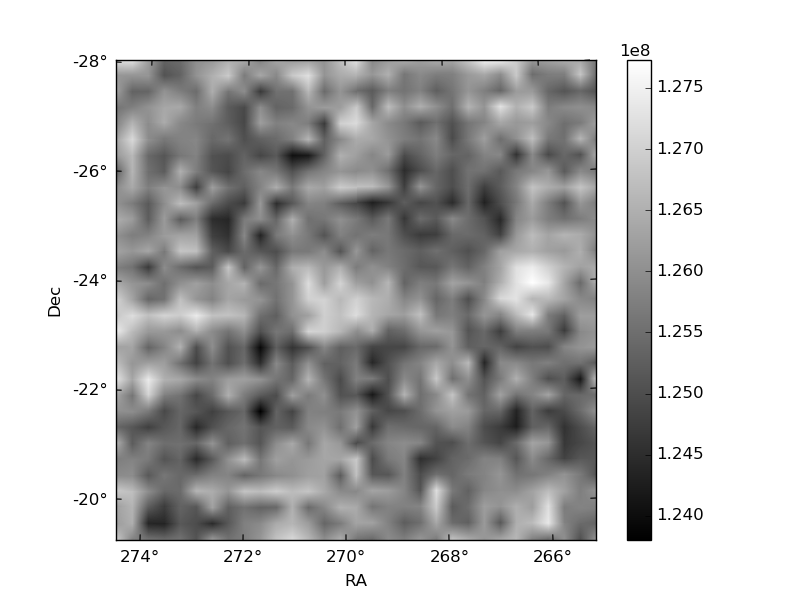
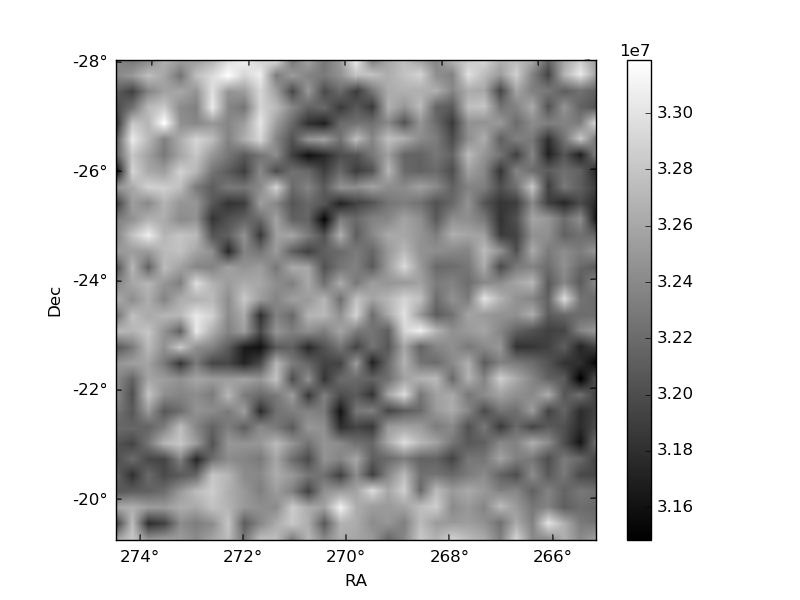
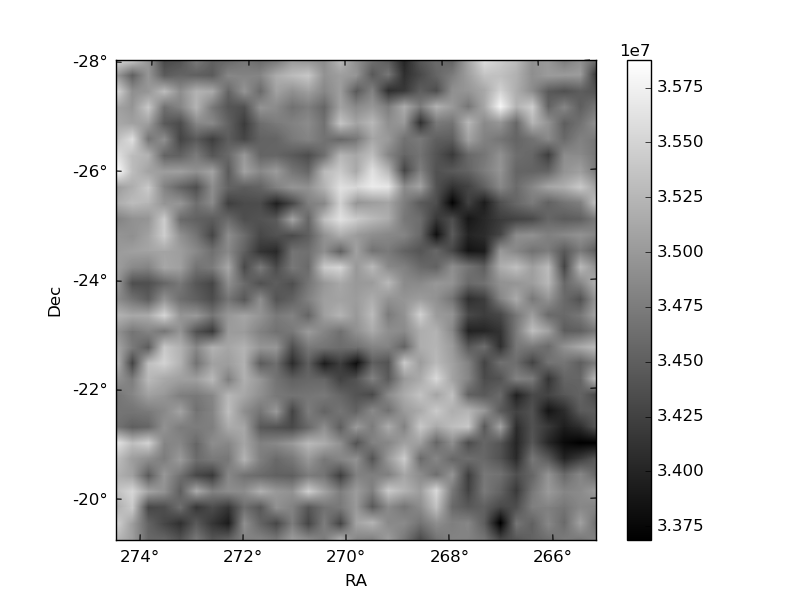
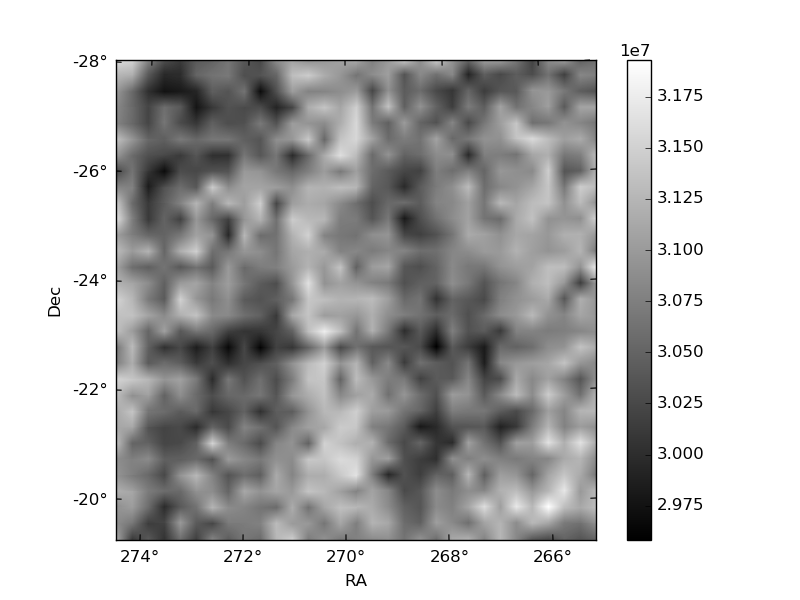
Histogram calculated using DETX and DETY for each event in the final _common_clean file
| Quadrant A | 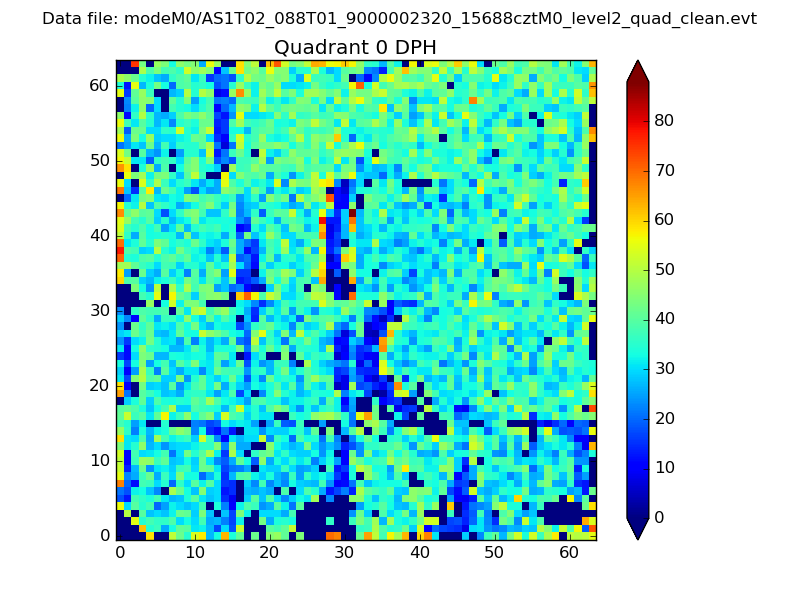 |
 |
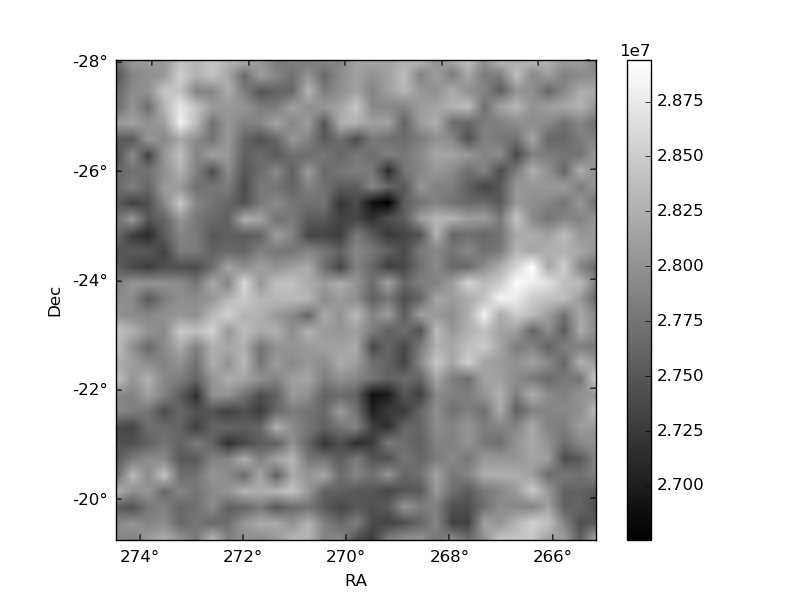
Quadrant B |
|---|---|---|---|
| Quadrant D | 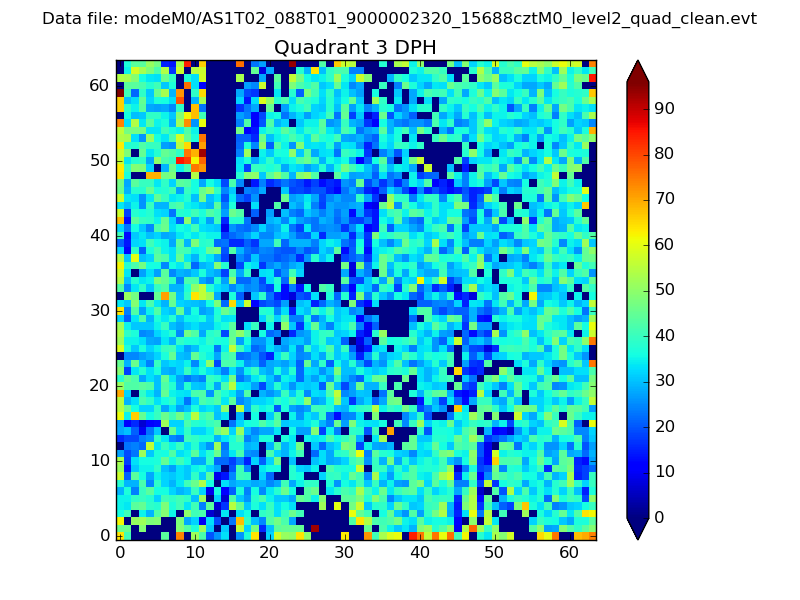 |
 |
Quadrant C |
| Plot type | Count rate plots | Images |
|---|---|---|
| Comparison with Poisson distribution Blue bars denote a histogram of data divided into 1 sec bins. Red curve is a Poisson curve with rate = median count rate of data. |
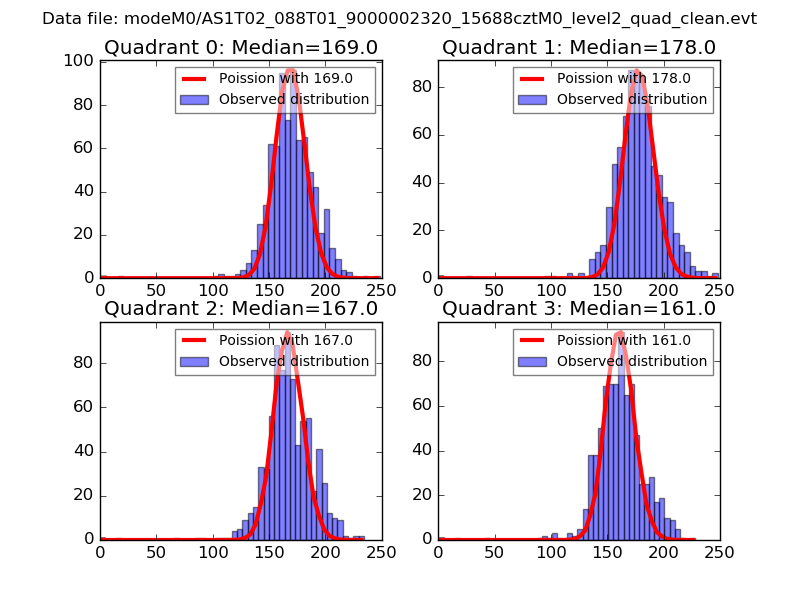 |
 |
| Quadrant-wise count rates Data is divided into 100 sec bins |
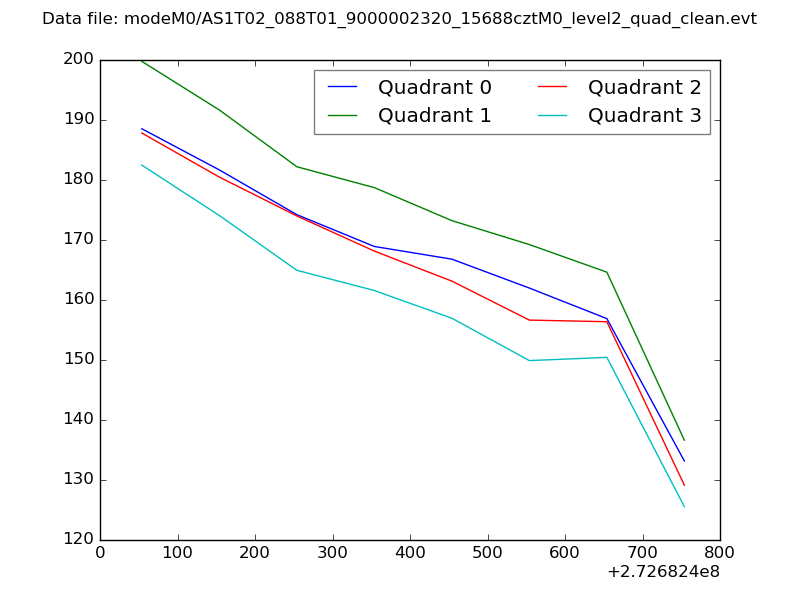 |
|
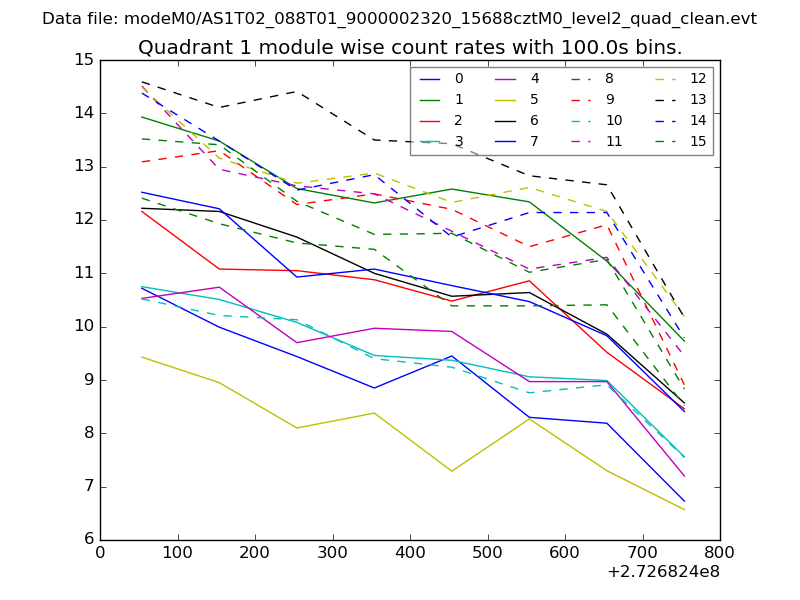
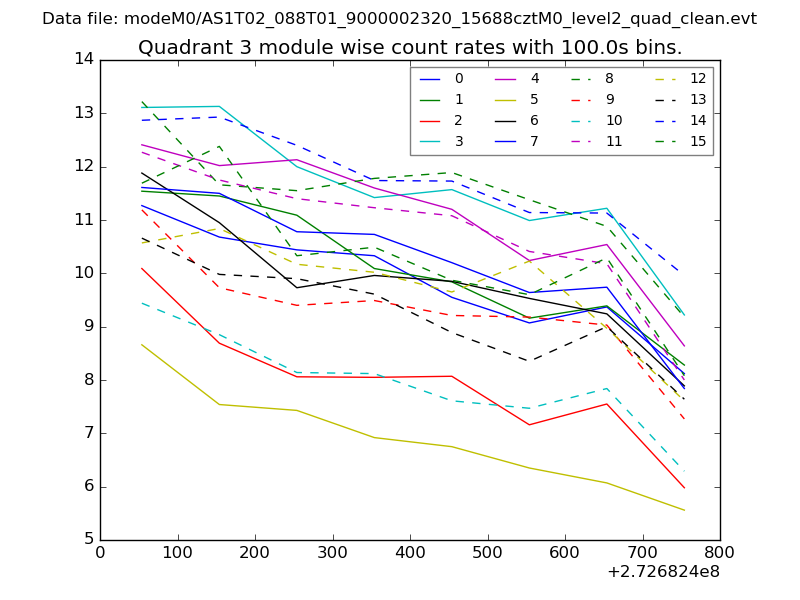
| Module-wise count rates for Quadrant A Data is divided into 100 sec bins |
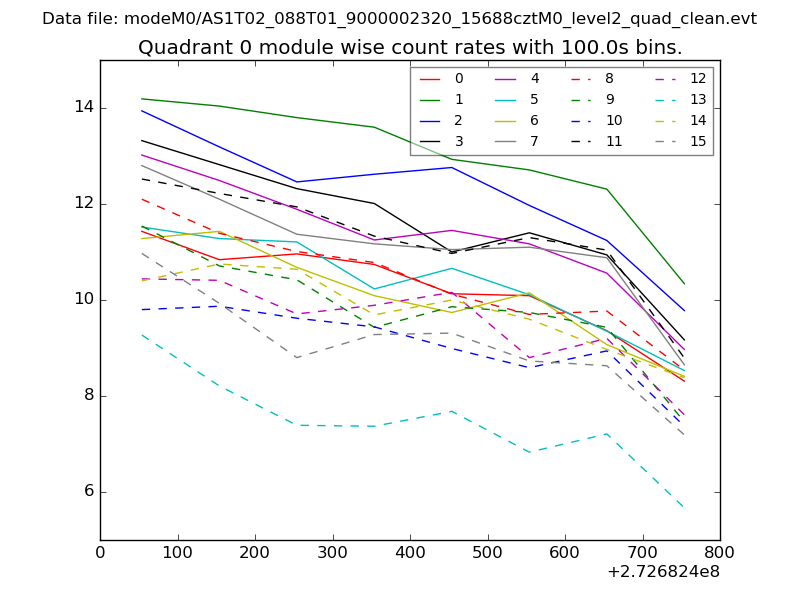 |
 |
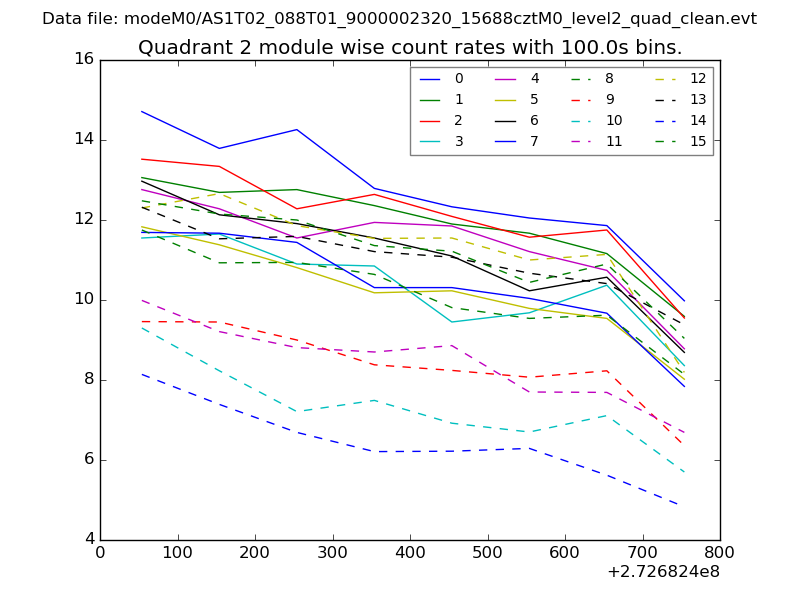
| Module-wise count rates for Quadrant B Data is divided into 100 sec bins |
 |
 |
| Module-wise count rates for Quadrant C Data is divided into 100 sec bins |
 |
 |
| Module-wise count rates for Quadrant D Data is divided into 100 sec bins |
 |
 |
| Parameter | Plot |
|---|---|
| CZT HV Monitor | 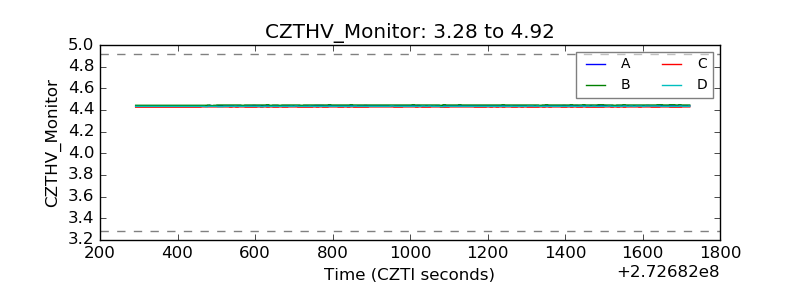 |
| D_VDD | 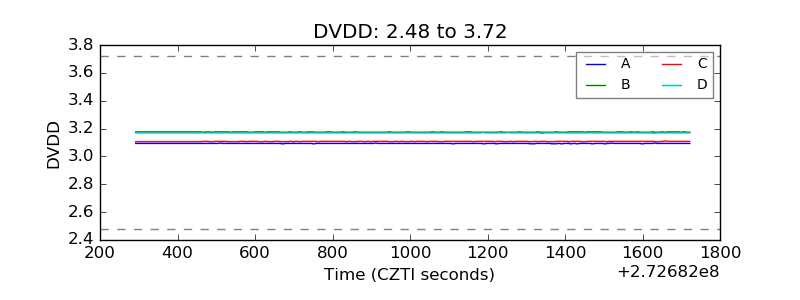 |
| Temperature 1 | 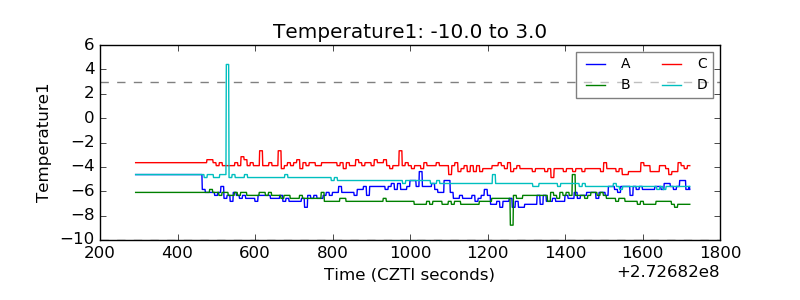 |
| Veto HV Monitor | 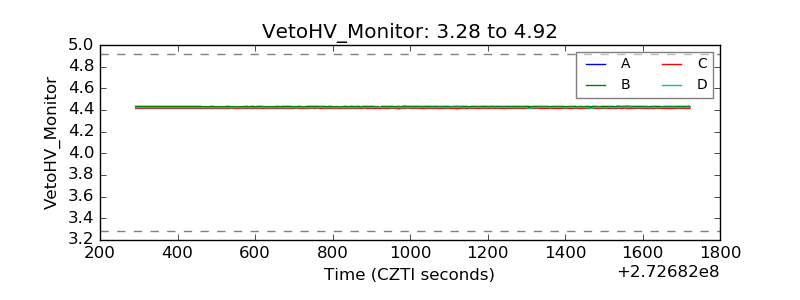 |
| Veto LLD | 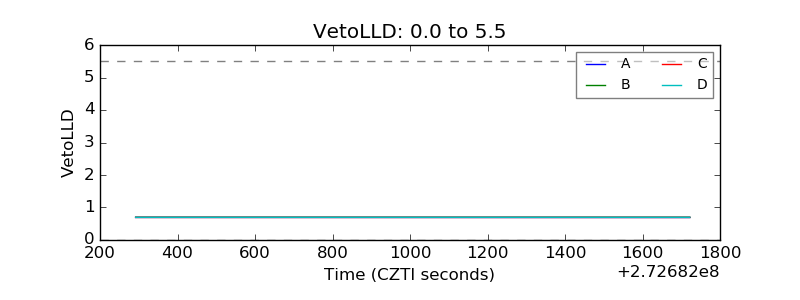 |
| Alpha Counter | 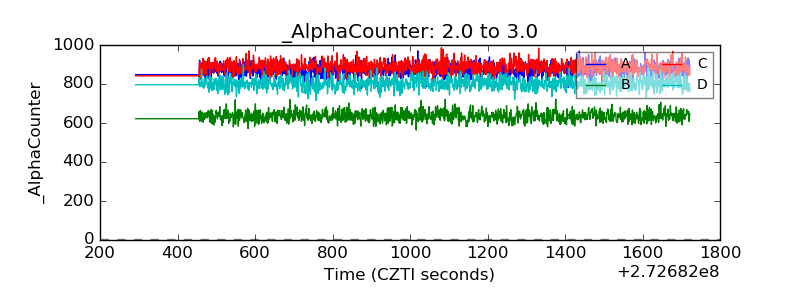 |
| _CPM_Rate | 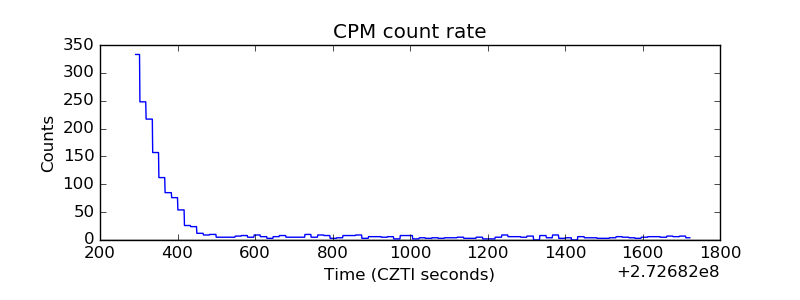 |
| CZT Counter | 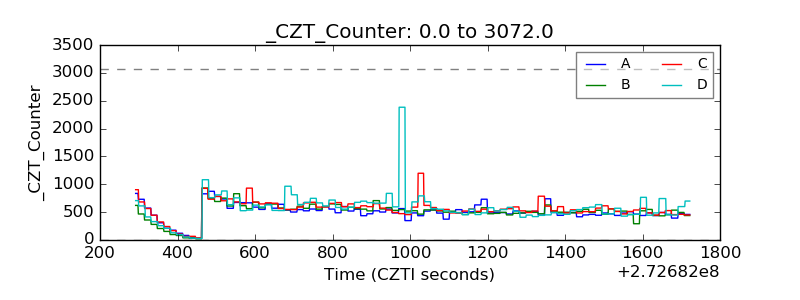 |
| +2.5 Volts monitor |  |
| +5 Volts monitor |  |
| _ROLL_ROT | 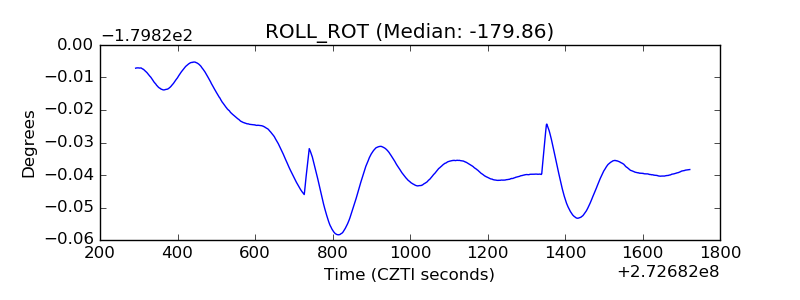 |
| _Roll_DEC |  |
| _Roll_RA | 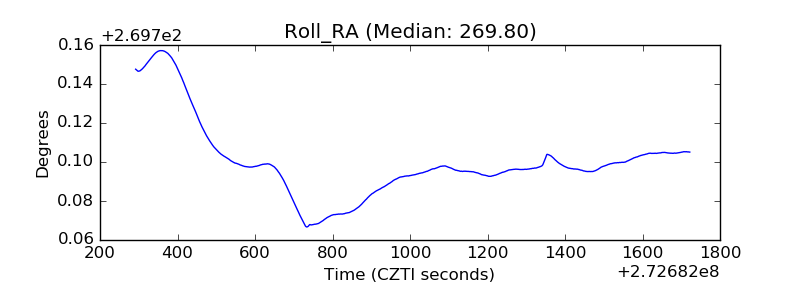 |
| Veto Counter | 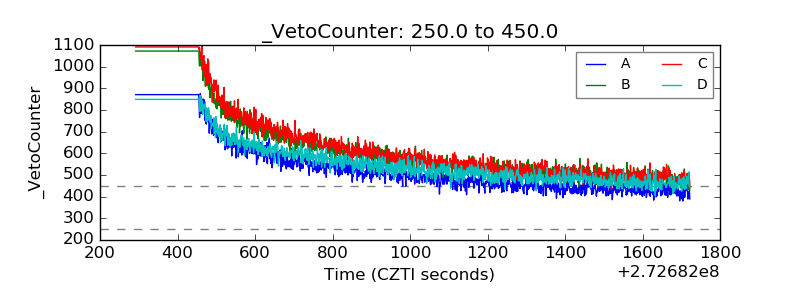 |