| Param | Original file | Final file |
|---|---|---|
| Filename | modeM0/AS1T02_088T01_9000002320_15690cztM0_level2.evt | modeM0/AS1T02_088T01_9000002320_15690cztM0_level2_quad_clean.evt |
| Size (bytes) | 430,496,640 | 55,491,840 |
| Size | 410.6 MB | 52.9 MB |
| Events in quadrant A | 2,964,939 | 319,752 |
| Events in quadrant B | 3,091,288 | 328,623 |
| Events in quadrant C | 3,130,126 | 315,265 |
| Events in quadrant D | 3,453,727 | 307,530 |
| Mode M9 | |||
|---|---|---|---|
| Quadrant | BADHDUFLAG | Total packets | Discarded packets |
| A | 0 | 14 | 0 |
| B | 0 | 14 | 0 |
| C | 0 | 14 | 0 |
| D | 0 | 14 | 0 |
| Mode M0 | |||
|---|---|---|---|
| Quadrant | BADHDUFLAG | Total packets | Discarded packets |
| A | 0 | 12078 | 2 |
| B | 0 | 12435 | 1 |
| C | 0 | 12432 | 1 |
| D | 0 | 13878 | 1 |
| Mode SS | |||
|---|---|---|---|
| Quadrant | BADHDUFLAG | Total packets | Discarded packets |
| A | 0 | 120 | 0 |
| B | 0 | 120 | 0 |
| C | 0 | 120 | 0 |
| D | 0 | 120 | 0 |
| Quadrant | Total seconds | Saturated seconds | Saturation percentage |
|---|---|---|---|
| A | 5845 | 14 | 0.239521% |
| B | 5845 | 23 | 0.393499% |
| C | 5845 | 59 | 1.009410% |
| D | 5845 | 148 | 2.532079% |
Noise dominated data is calculated using 1-second bins in cleaned event files. If a bin has >2000 counts, and if more than 50% of those come from <1% of pixels, then it is considered to be noise-dominated and hence unusable.
| Quadrant | # 1 sec bins | Bins with >0 counts | Bins with >2000 counts | High rate bins dominated by noise | Noise dominated (total time) | Noise dominated (detector-on time) | Marked lightcurve |
|---|---|---|---|---|---|---|---|
| A | 7247 | 5848 | 0 | 0 | 0.00% | 0.00% | 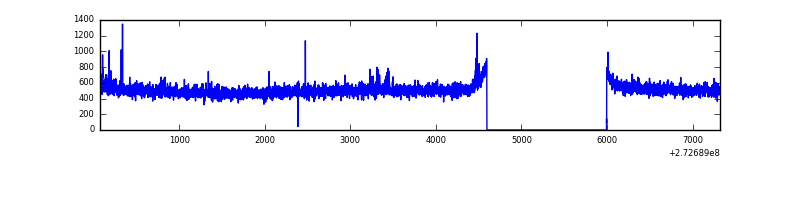 |
| B | 7247 | 5848 | 0 | 0 | 0.00% | 0.00% | 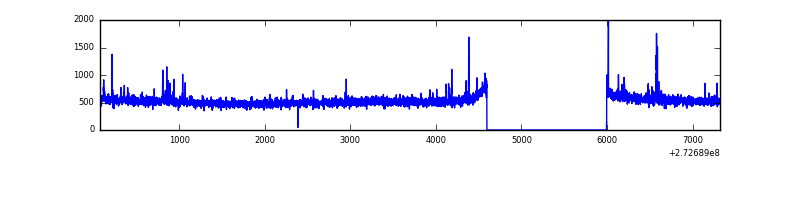 |
| C | 7247 | 5848 | 2 | 2 | 0.03% | 0.03% | 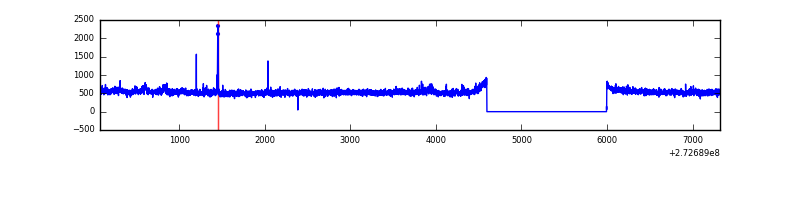 |
| D | 7247 | 5848 | 118 | 118 | 1.63% | 2.02% | 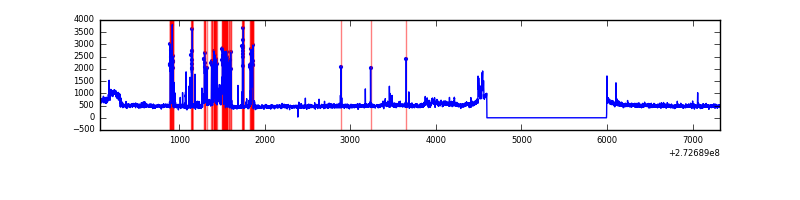 |
Top three noisy pixels from each quadrant. If the there are fewer than three noisy pixels in the level2.evt file, extra rows are filled as -1
| Pixel properties | Quadrant properties | ||||||
|---|---|---|---|---|---|---|---|
| Quadrant | DetID | PixID | Counts | Sigma | Mean | Median | Sigma |
| A | 4 | 2 | 26592 | 166.66 | 764 | 750 | 155.1 |
| A | 0 | 226 | 6769 | 38.82 | 764 | 750 | 155.1 |
| A | 12 | 194 | 5594 | 31.24 | 764 | 750 | 155.1 |
| B | 4 | 173 | 38230 | 260.38 | 770 | 753 | 143.9 |
| B | 0 | 214 | 21557 | 144.54 | 770 | 753 | 143.9 |
| B | 3 | 209 | 17175 | 114.09 | 770 | 753 | 143.9 |
| C | 14 | 238 | 115800 | 677.58 | 736 | 742 | 169.8 |
| C | 3 | 233 | 102189 | 597.42 | 736 | 742 | 169.8 |
| C | 9 | 54 | 29480 | 169.24 | 736 | 742 | 169.8 |
| D | 10 | 70 | 441416 | 2447.07 | 733 | 714 | 180.1 |
| D | 1 | 52 | 206078 | 1140.32 | 733 | 714 | 180.1 |
| D | 2 | 234 | 22096 | 118.73 | 733 | 714 | 180.1 |
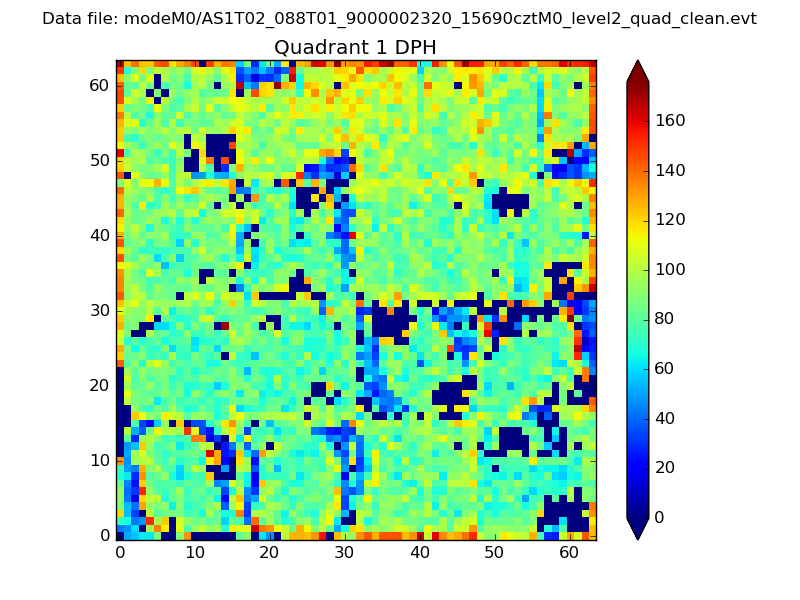
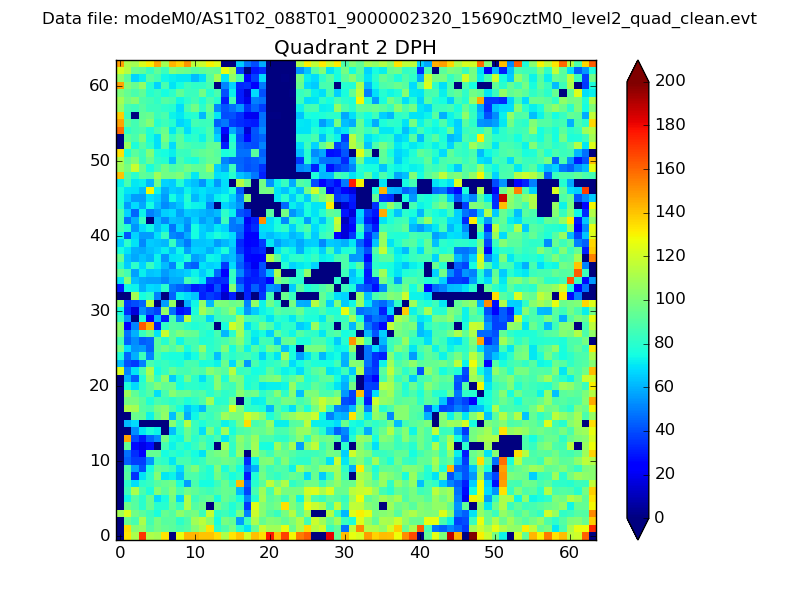
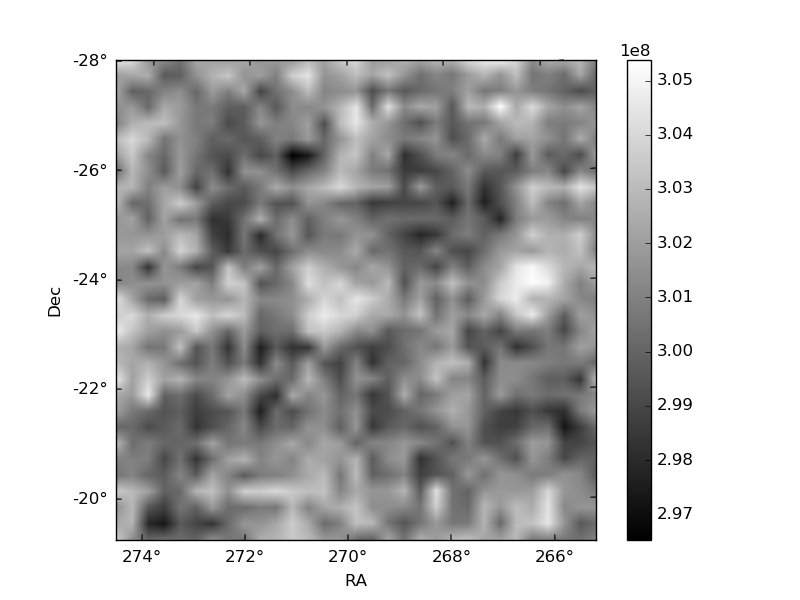
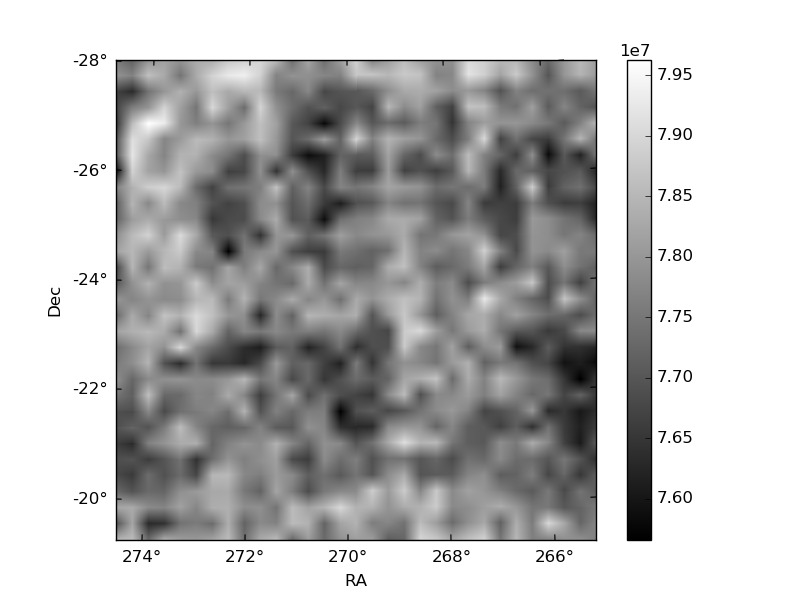
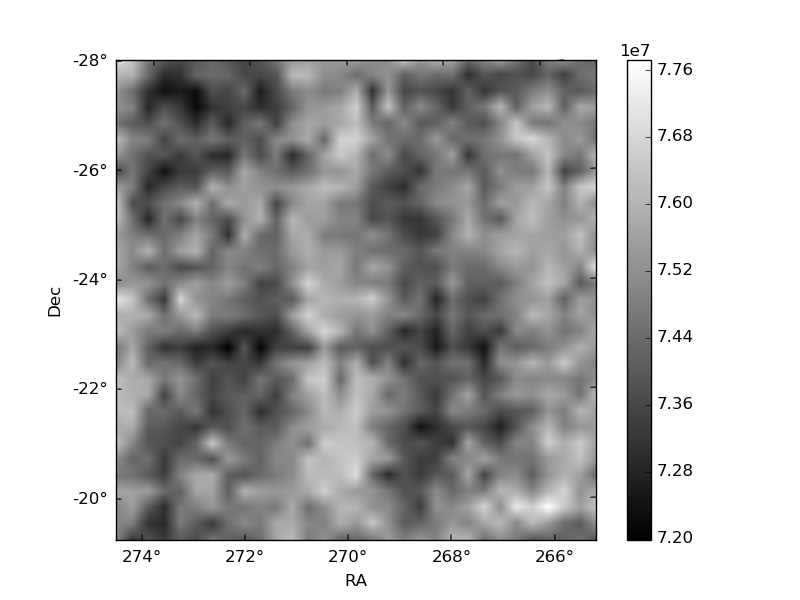
Histogram calculated using DETX and DETY for each event in the final _common_clean file
| Quadrant A |  |
 |
Quadrant B |
|---|---|---|---|
| Quadrant D | 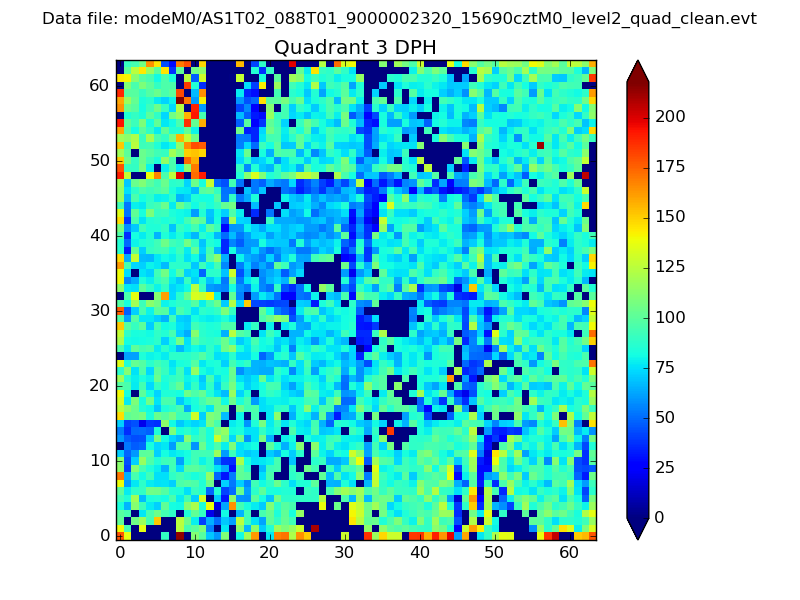 |
 |
Quadrant C |
| Plot type | Count rate plots | Images |
|---|---|---|
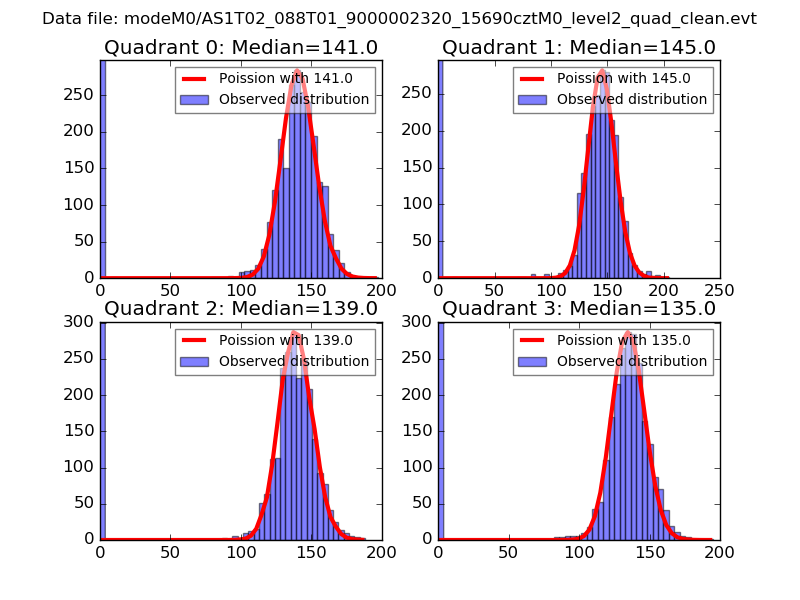
| Comparison with Poisson distribution Blue bars denote a histogram of data divided into 1 sec bins. Red curve is a Poisson curve with rate = median count rate of data. |
 |
 |
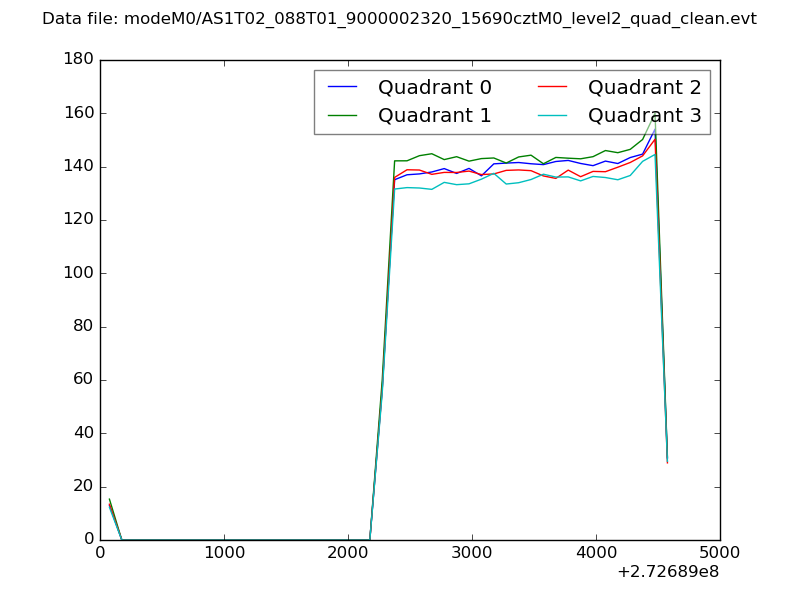
| Quadrant-wise count rates Data is divided into 100 sec bins |
 |
|
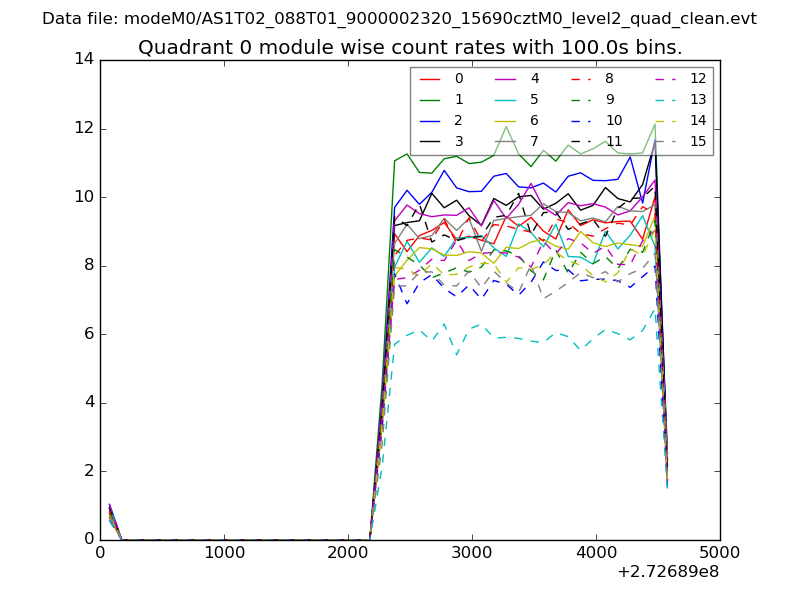
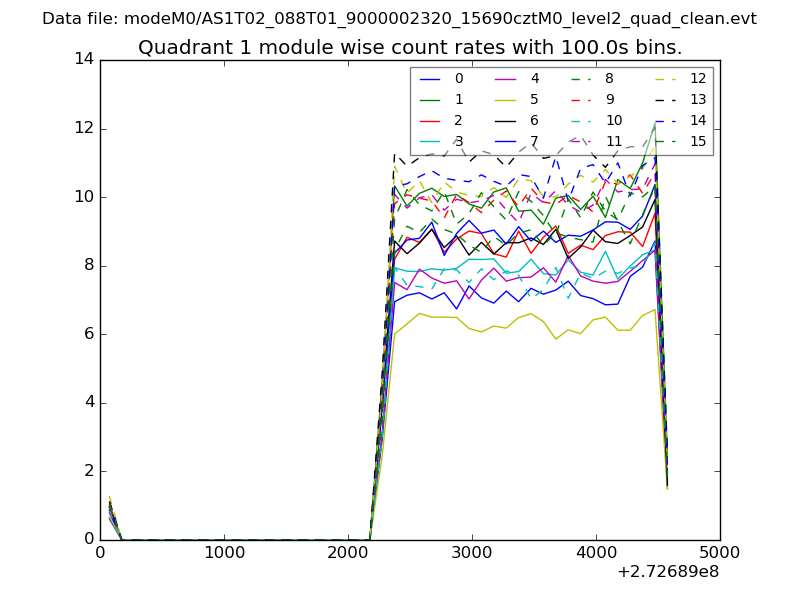
| Module-wise count rates for Quadrant A Data is divided into 100 sec bins |
 |
 |
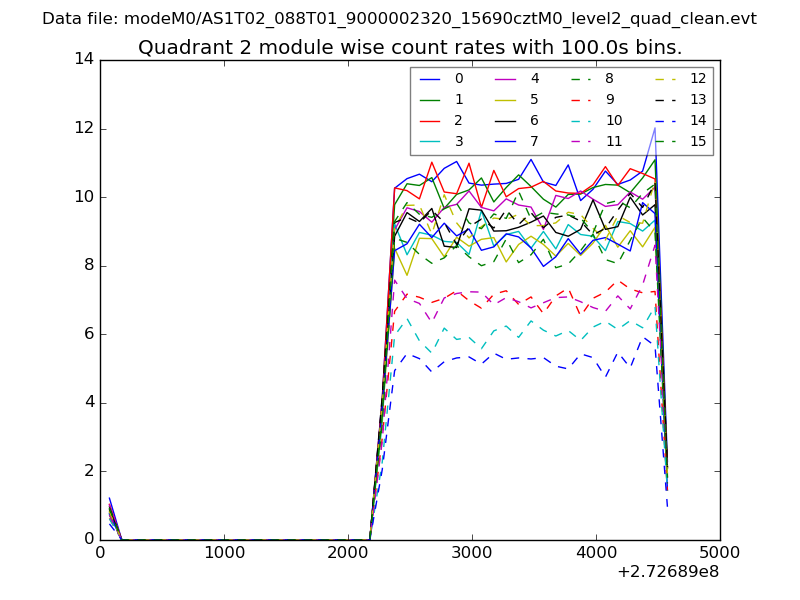
| Module-wise count rates for Quadrant B Data is divided into 100 sec bins |
 |
 |
| Module-wise count rates for Quadrant C Data is divided into 100 sec bins |
 |
 |
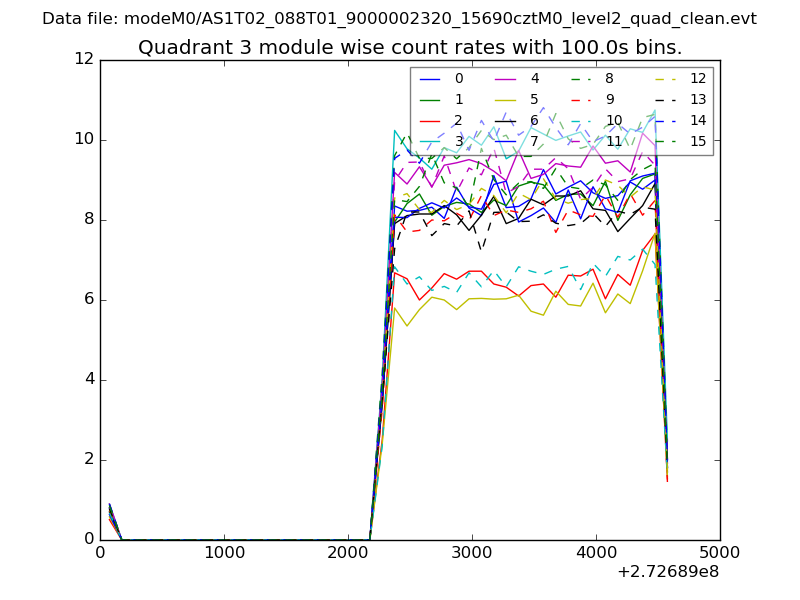
| Module-wise count rates for Quadrant D Data is divided into 100 sec bins |
 |
 |
| Parameter | Plot |
|---|---|
| CZT HV Monitor | 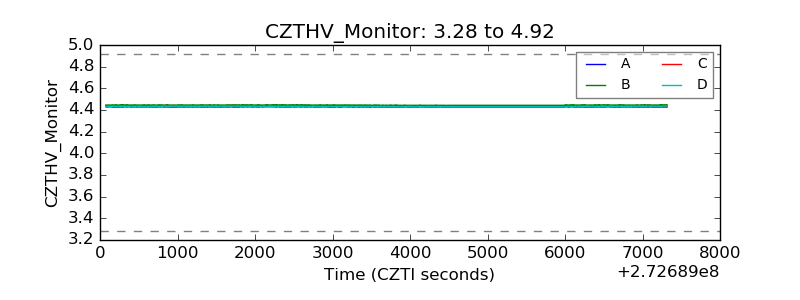 |
| D_VDD | 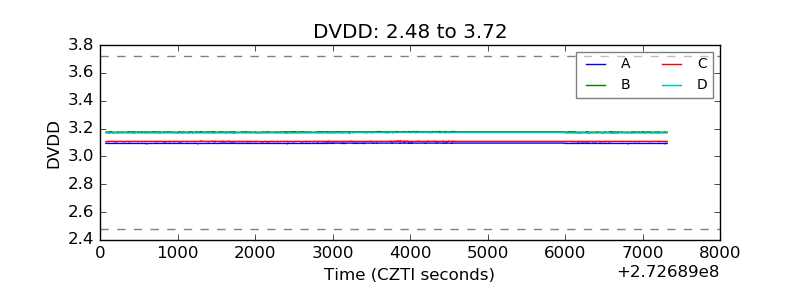 |
| Temperature 1 | 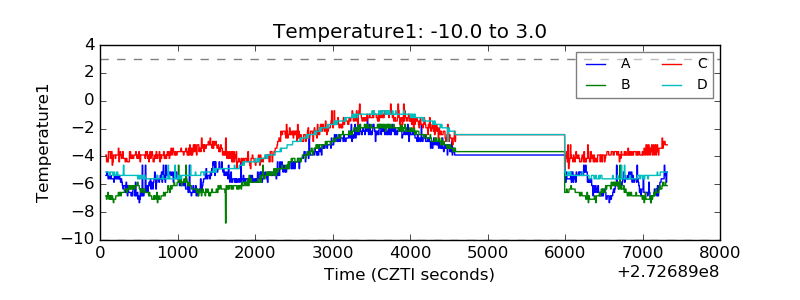 |
| Veto HV Monitor | 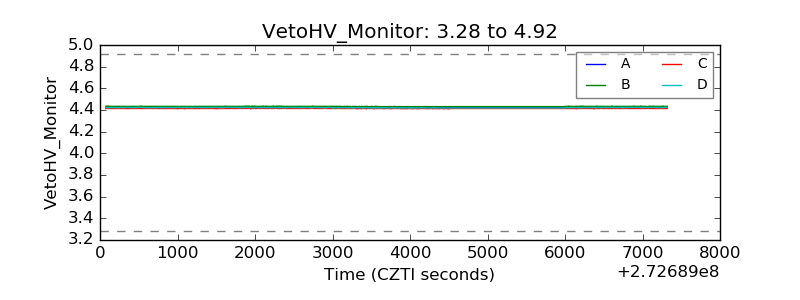 |
| Veto LLD | 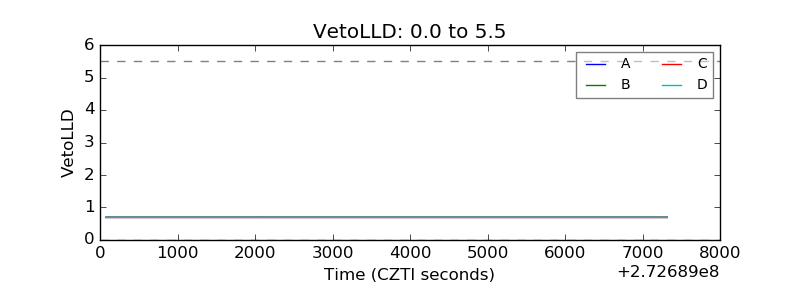 |
| Alpha Counter |  |
| _CPM_Rate | 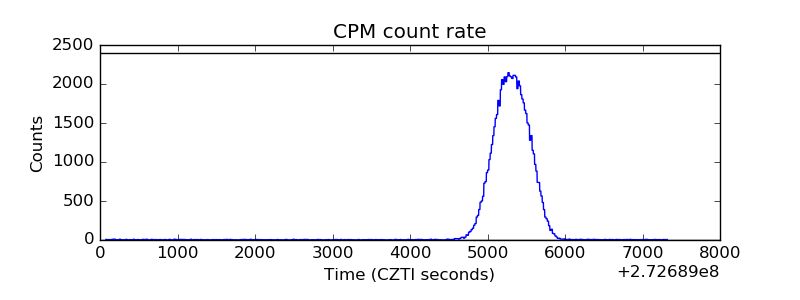 |
| CZT Counter | 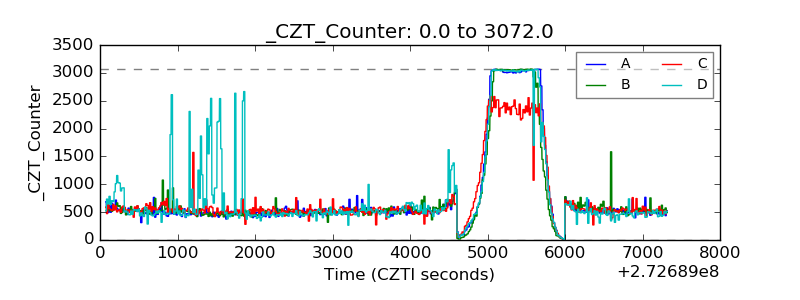 |
| +2.5 Volts monitor |  |
| +5 Volts monitor |  |
| _ROLL_ROT | 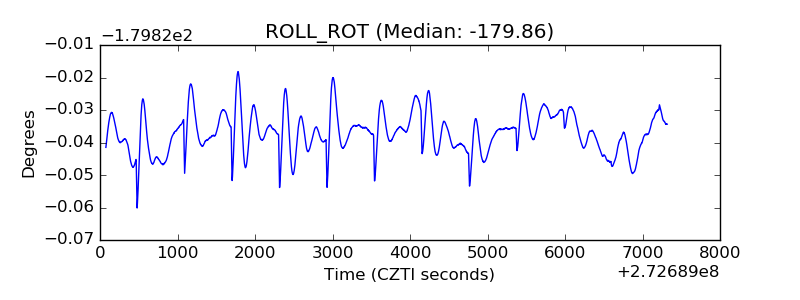 |
| _Roll_DEC | 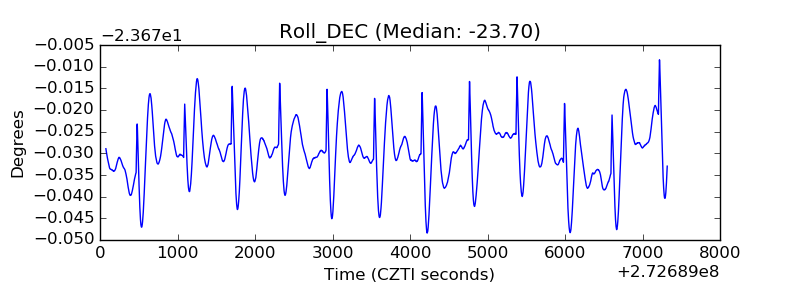 |
| _Roll_RA | 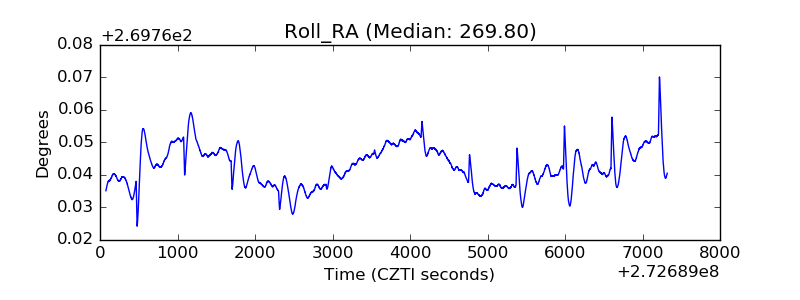 |
| Veto Counter | 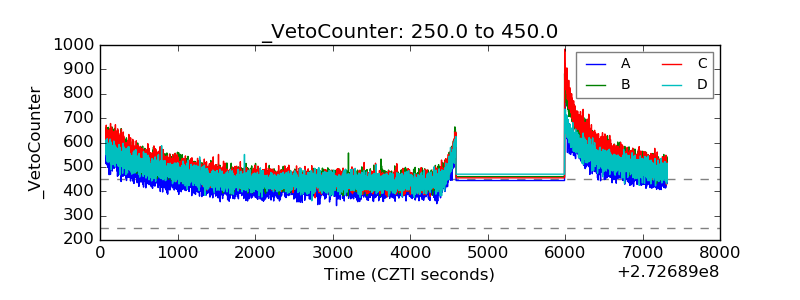 |