| Param | Original file | Final file |
|---|---|---|
| Filename | modeM0/AS1T02_088T01_9000002320_15694cztM0_level2.evt | modeM0/AS1T02_088T01_9000002320_15694cztM0_level2_quad_clean.evt |
| Size (bytes) | 585,527,040 | 88,251,840 |
| Size | 558.4 MB | 84.2 MB |
| Events in quadrant A | 3,544,017 | 557,271 |
| Events in quadrant B | 3,878,202 | 566,726 |
| Events in quadrant C | 3,626,191 | 547,648 |
| Events in quadrant D | 6,180,548 | 483,715 |
| Mode M9 | |||
|---|---|---|---|
| Quadrant | BADHDUFLAG | Total packets | Discarded packets |
| A | 0 | 7 | 0 |
| B | 0 | 7 | 0 |
| C | 0 | 7 | 0 |
| D | 0 | 8 | 0 |
| Mode M0 | |||
|---|---|---|---|
| Quadrant | BADHDUFLAG | Total packets | Discarded packets |
| A | 0 | 15328 | 5 |
| B | 0 | 16077 | 4 |
| C | 0 | 15412 | 4 |
| D | 0 | 23193 | 4 |
| Mode SS | |||
|---|---|---|---|
| Quadrant | BADHDUFLAG | Total packets | Discarded packets |
| A | 0 | 154 | 0 |
| B | 0 | 154 | 0 |
| C | 0 | 154 | 0 |
| D | 0 | 154 | 0 |
| Quadrant | Total seconds | Saturated seconds | Saturation percentage |
|---|---|---|---|
| A | 7415 | 180 | 2.427512% |
| B | 7415 | 238 | 3.209710% |
| C | 7415 | 208 | 2.805125% |
| D | 7415 | 794 | 10.708024% |
Noise dominated data is calculated using 1-second bins in cleaned event files. If a bin has >2000 counts, and if more than 50% of those come from <1% of pixels, then it is considered to be noise-dominated and hence unusable.
| Quadrant | # 1 sec bins | Bins with >0 counts | Bins with >2000 counts | High rate bins dominated by noise | Noise dominated (total time) | Noise dominated (detector-on time) | Marked lightcurve |
|---|---|---|---|---|---|---|---|
| A | 7726 | 7419 | 0 | 0 | 0.00% | 0.00% | 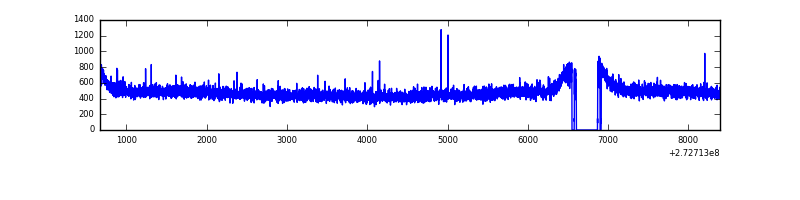 |
| B | 7726 | 7419 | 37 | 37 | 0.48% | 0.50% | 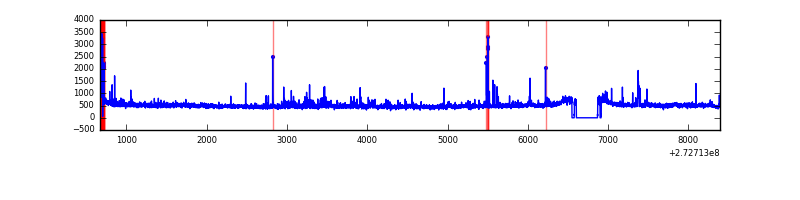 |
| C | 7726 | 7419 | 0 | 0 | 0.00% | 0.00% | 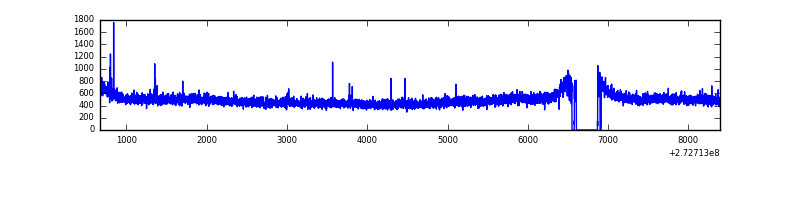 |
| D | 7726 | 7419 | 655 | 655 | 8.48% | 8.83% | 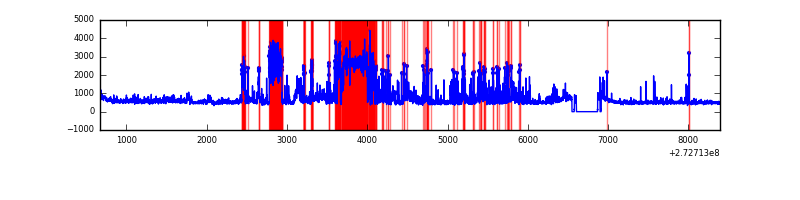 |
Top three noisy pixels from each quadrant. If the there are fewer than three noisy pixels in the level2.evt file, extra rows are filled as -1
| Pixel properties | Quadrant properties | ||||||
|---|---|---|---|---|---|---|---|
| Quadrant | DetID | PixID | Counts | Sigma | Mean | Median | Sigma |
| A | 0 | 226 | 8145 | 38.72 | 917 | 897 | 187.2 |
| A | 12 | 194 | 6752 | 31.28 | 917 | 897 | 187.2 |
| A | 3 | 137 | 6374 | 29.26 | 917 | 897 | 187.2 |
| B | 4 | 48 | 98469 | 554.36 | 911 | 887 | 176.0 |
| B | 4 | 173 | 49598 | 276.73 | 911 | 887 | 176.0 |
| B | 5 | 236 | 40876 | 227.18 | 911 | 887 | 176.0 |
| C | 14 | 238 | 132762 | 645.89 | 879 | 883 | 204.2 |
| C | 3 | 233 | 40219 | 192.65 | 879 | 883 | 204.2 |
| C | 9 | 54 | 17965 | 83.66 | 879 | 883 | 204.2 |
| D | 1 | 52 | 2108307 | 9957.32 | 856 | 830 | 211.7 |
| D | 12 | 221 | 589001 | 2778.97 | 856 | 830 | 211.7 |
| D | 12 | 110 | 193242 | 909.1 | 856 | 830 | 211.7 |
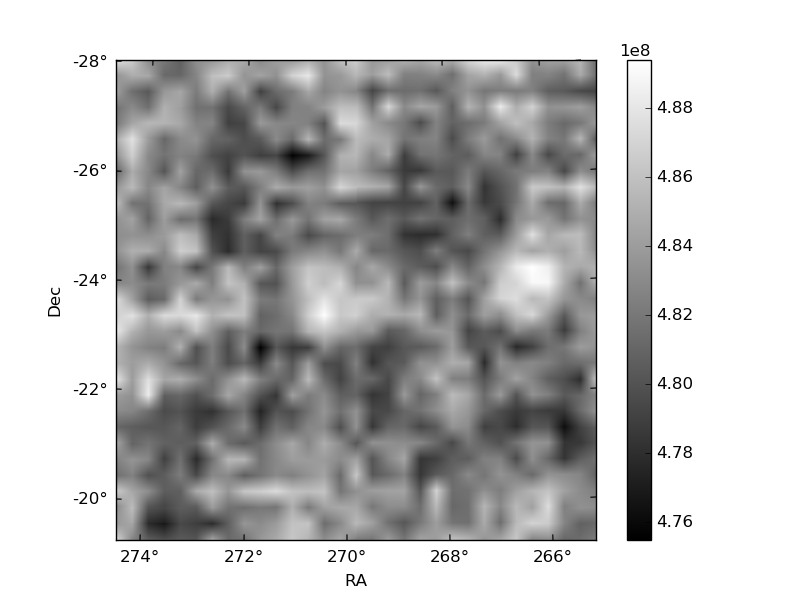
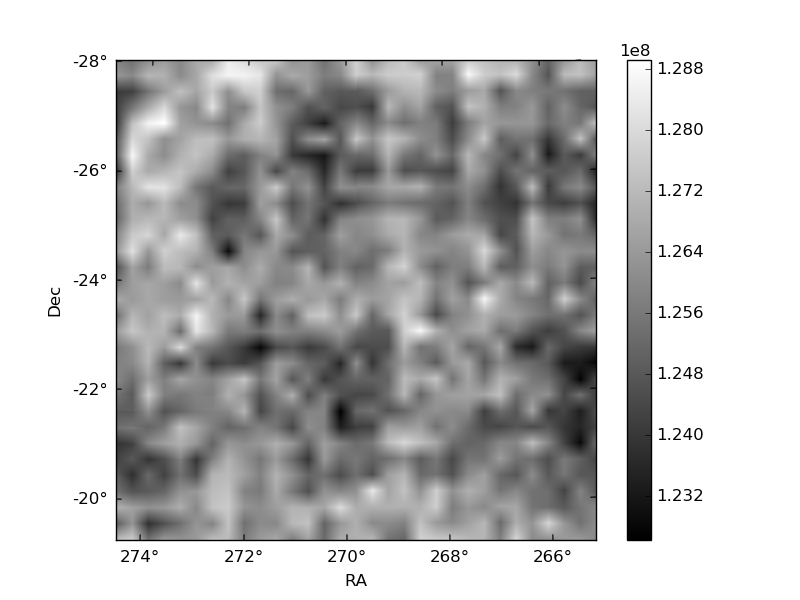
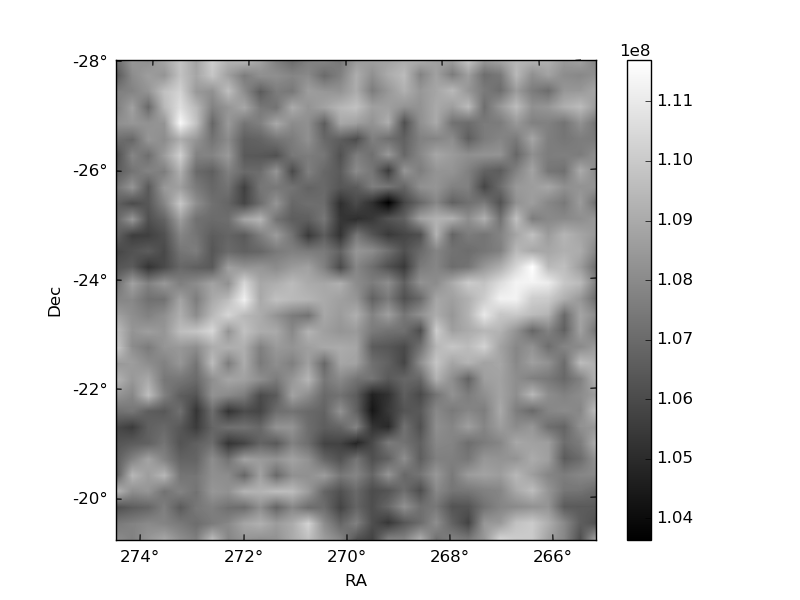
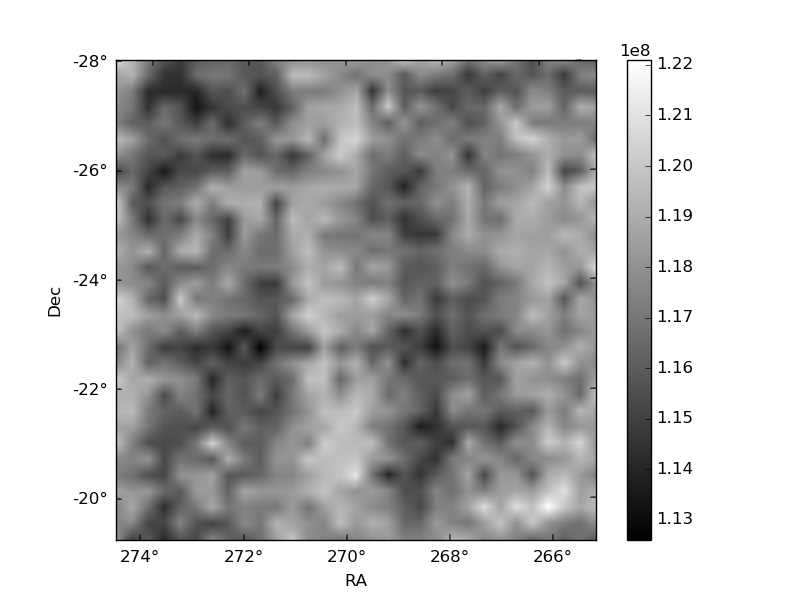
Histogram calculated using DETX and DETY for each event in the final _common_clean file
| Quadrant A | 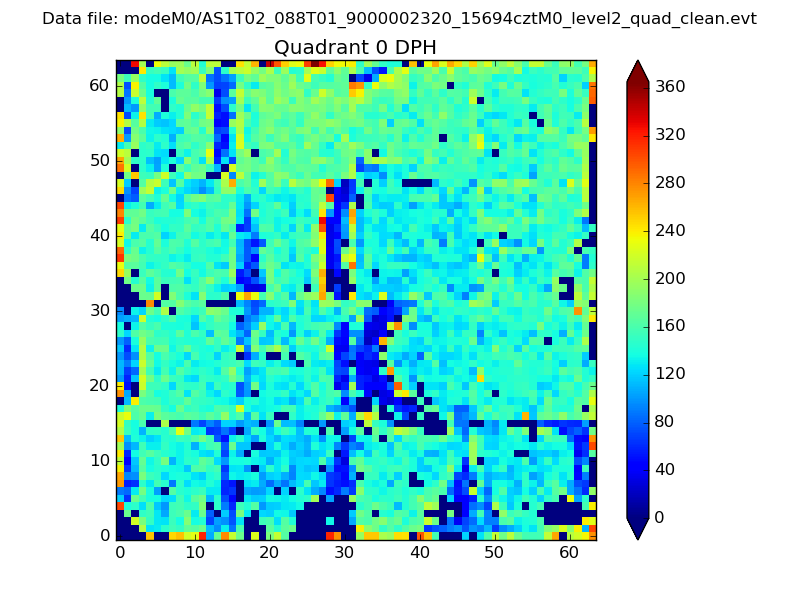 |
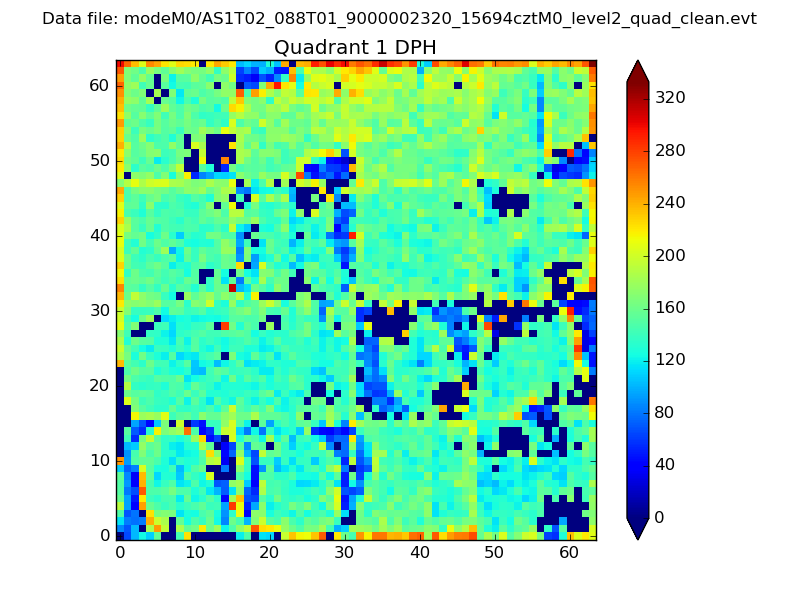 |
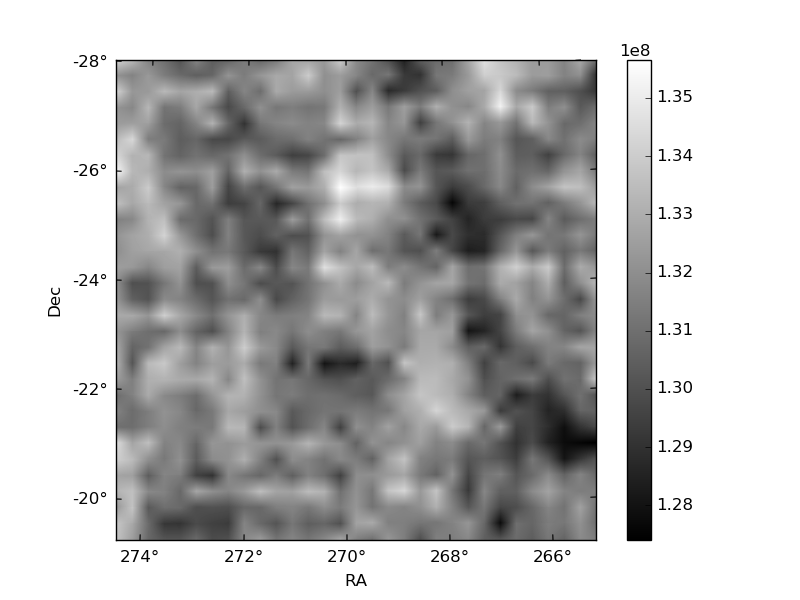
Quadrant B |
|---|---|---|---|
| Quadrant D | 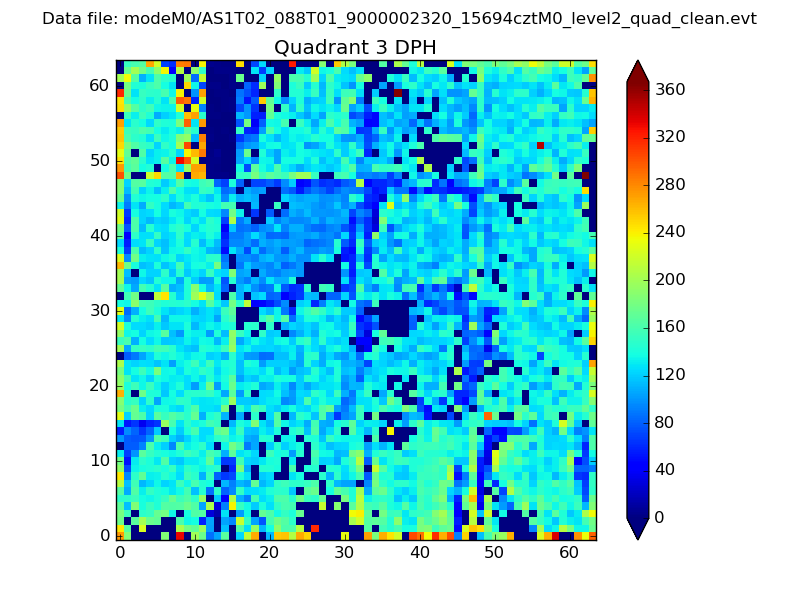 |
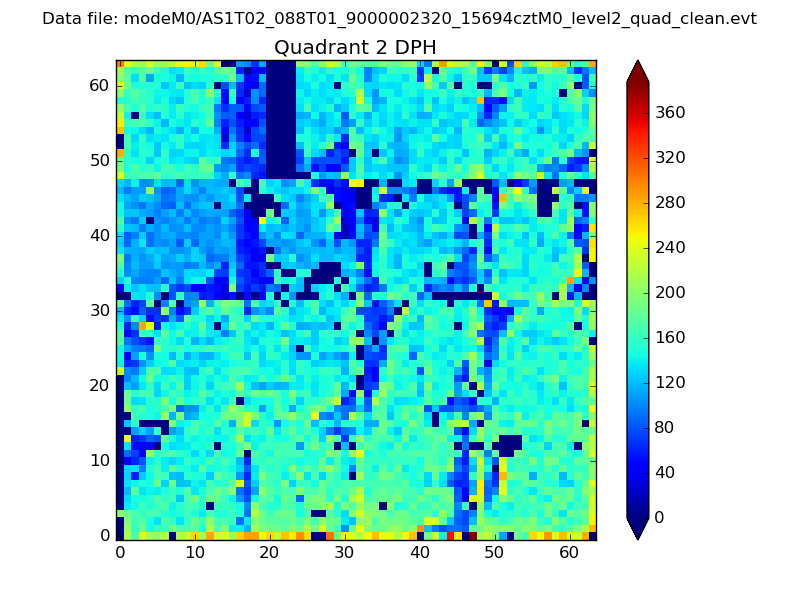 |
Quadrant C |
| Plot type | Count rate plots | Images |
|---|---|---|
| Comparison with Poisson distribution Blue bars denote a histogram of data divided into 1 sec bins. Red curve is a Poisson curve with rate = median count rate of data. |
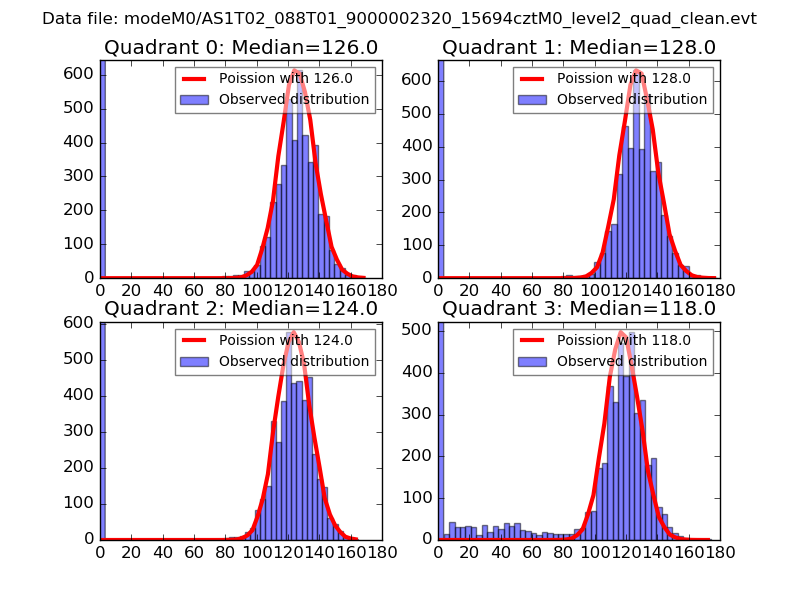 |
 |
| Quadrant-wise count rates Data is divided into 100 sec bins |
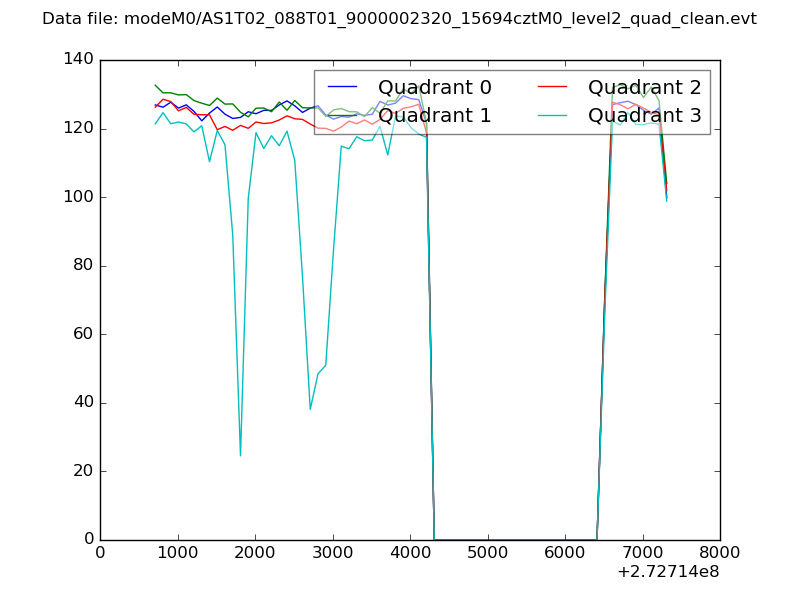 |
|
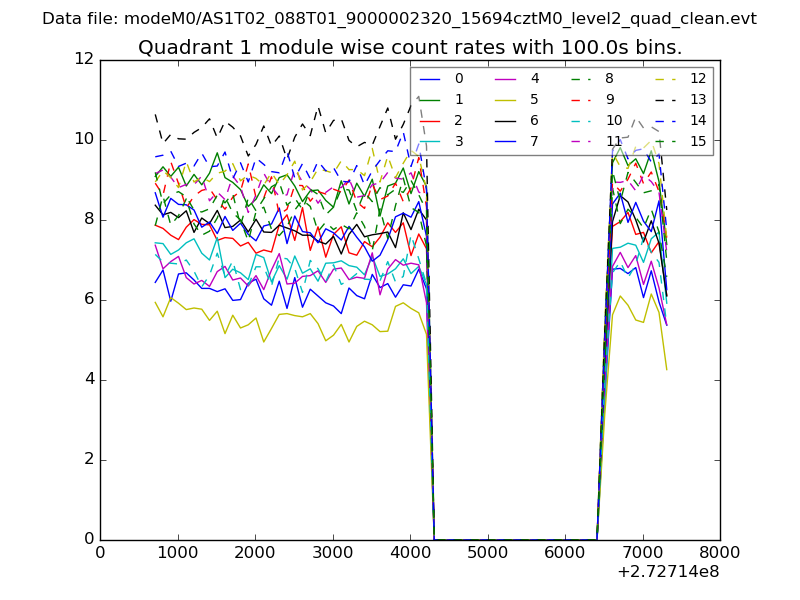
| Module-wise count rates for Quadrant A Data is divided into 100 sec bins |
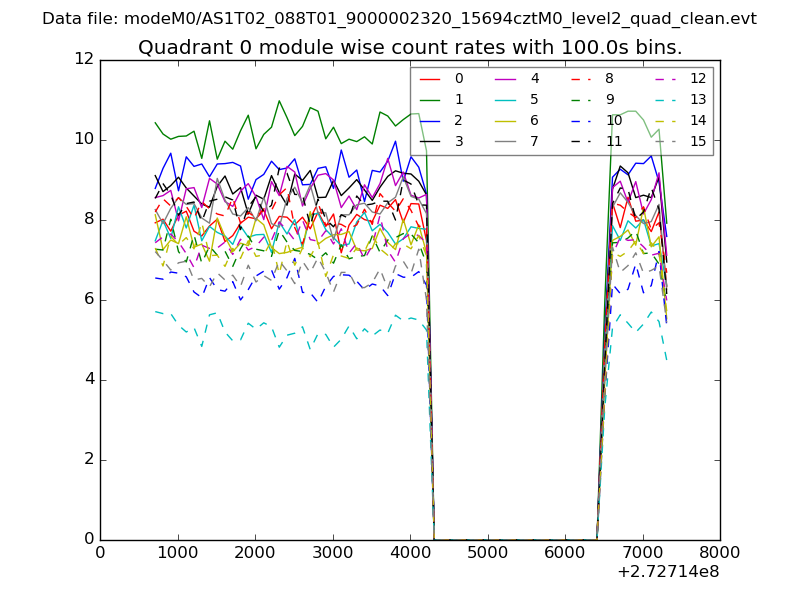 |
 |
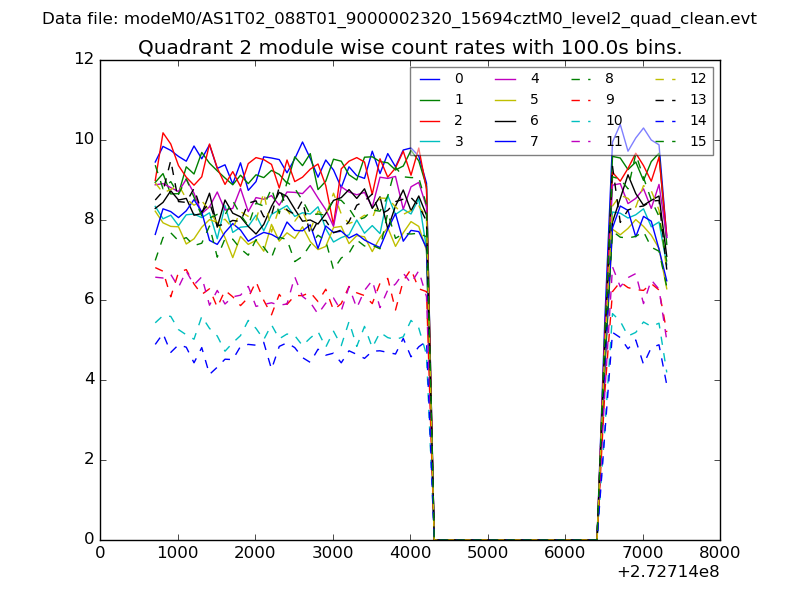
| Module-wise count rates for Quadrant B Data is divided into 100 sec bins |
 |
 |
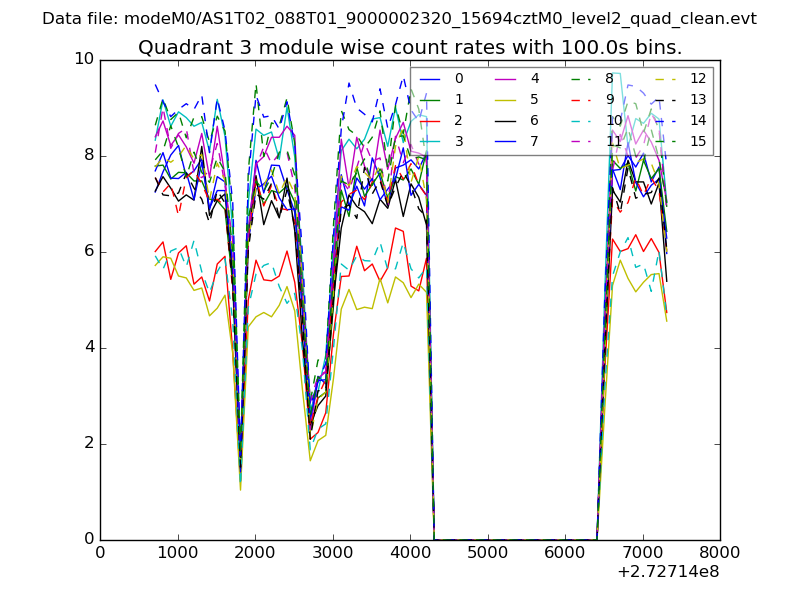
| Module-wise count rates for Quadrant C Data is divided into 100 sec bins |
 |
 |
| Module-wise count rates for Quadrant D Data is divided into 100 sec bins |
 |
 |
| Parameter | Plot |
|---|---|
| CZT HV Monitor | 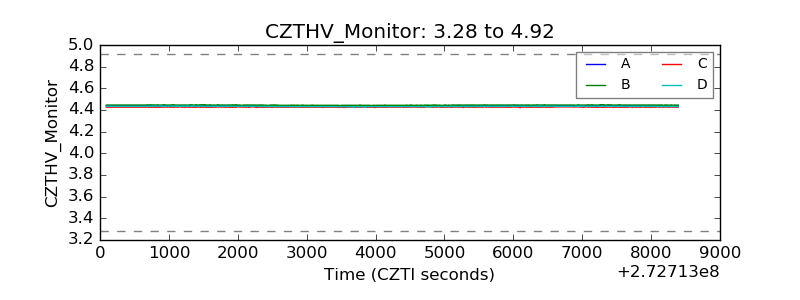 |
| D_VDD | 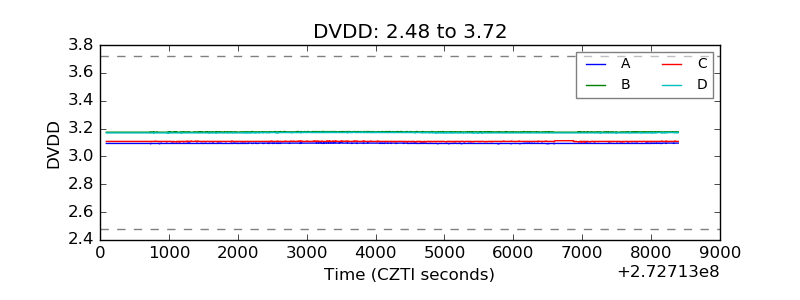 |
| Temperature 1 | 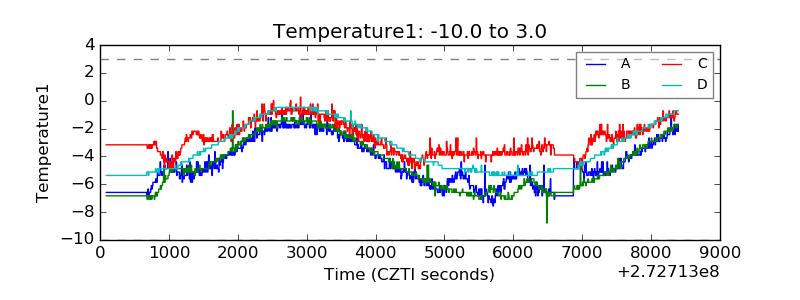 |
| Veto HV Monitor | 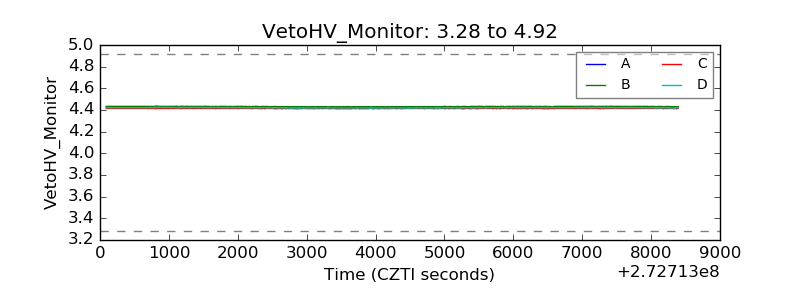 |
| Veto LLD | 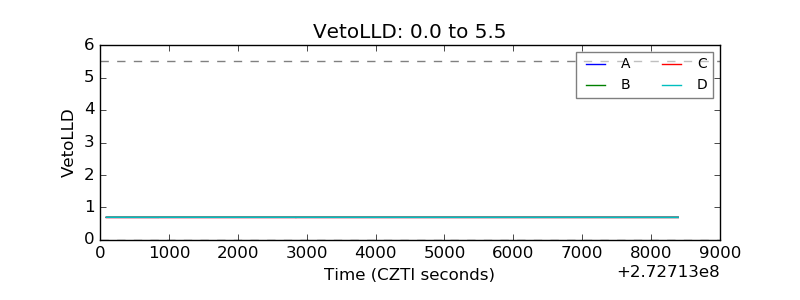 |
| Alpha Counter | 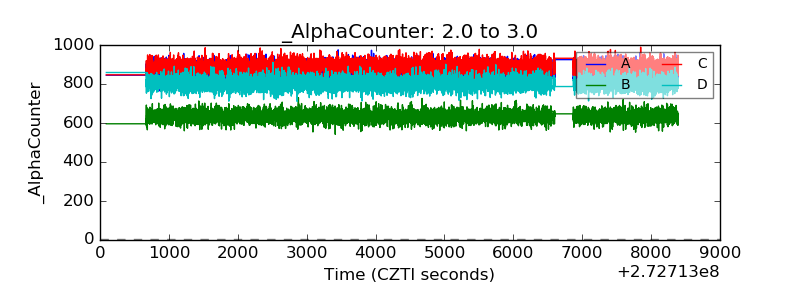 |
| _CPM_Rate | 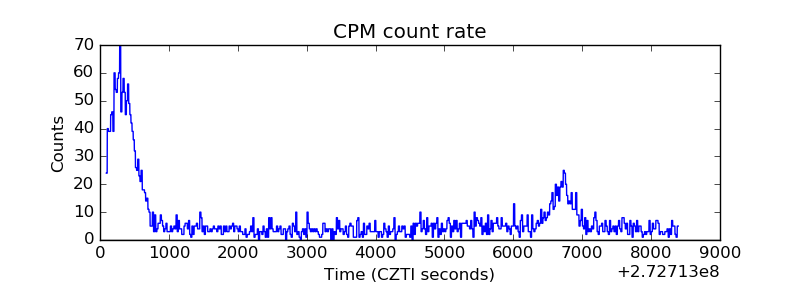 |
| CZT Counter | 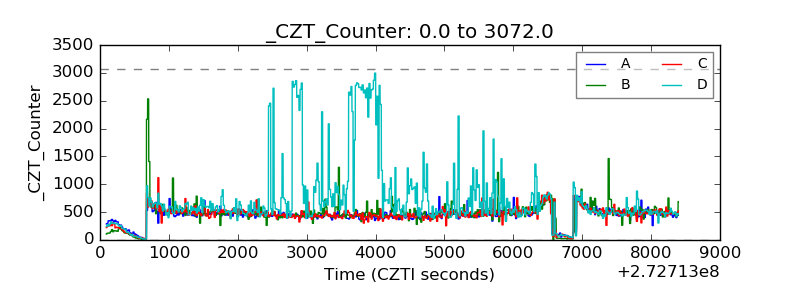 |
| +2.5 Volts monitor |  |
| +5 Volts monitor |  |
| _ROLL_ROT | 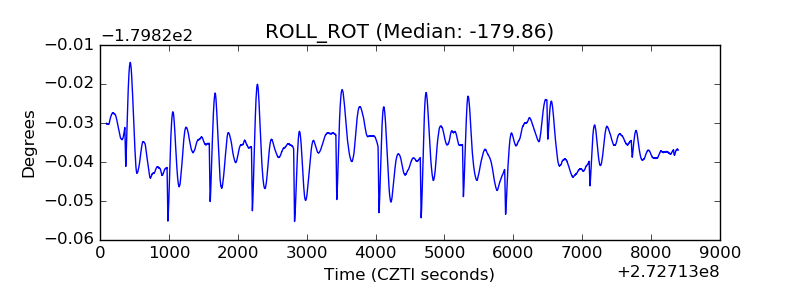 |
| _Roll_DEC | 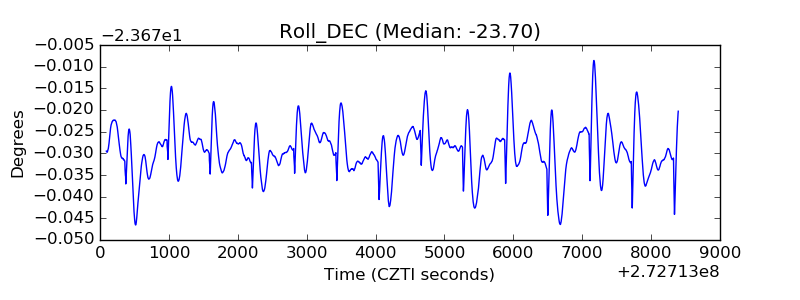 |
| _Roll_RA | 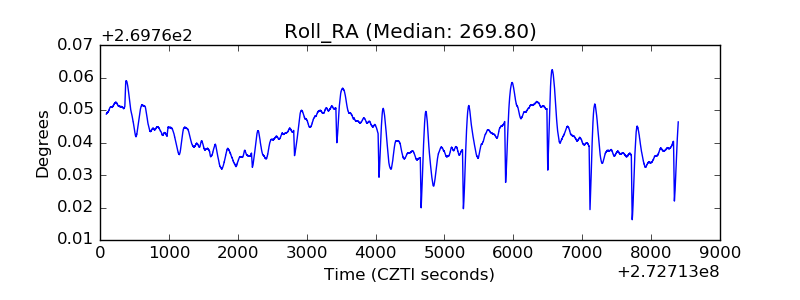 |
| Veto Counter | 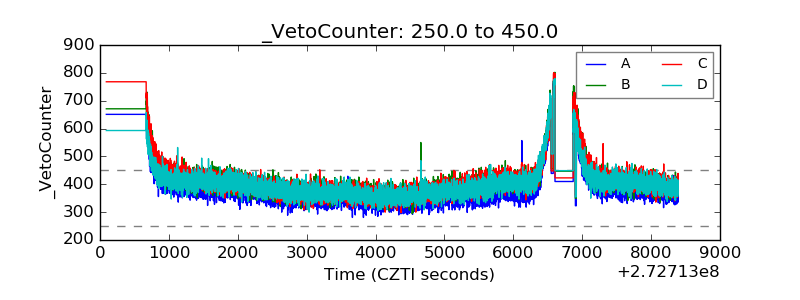 |