| Param | Original file | Final file |
|---|---|---|
| Filename | modeM0/AS1T02_088T01_9000002320_15699cztM0_level2.evt | modeM0/AS1T02_088T01_9000002320_15699cztM0_level2_quad_clean.evt |
| Size (bytes) | 491,872,320 | 91,552,320 |
| Size | 469.1 MB | 87.3 MB |
| Events in quadrant A | 3,152,416 | 586,047 |
| Events in quadrant B | 3,419,450 | 593,109 |
| Events in quadrant C | 3,267,488 | 568,012 |
| Events in quadrant D | 4,594,705 | 550,618 |
| Mode M9 | |||
|---|---|---|---|
| Quadrant | BADHDUFLAG | Total packets | Discarded packets |
| A | 0 | 17 | 0 |
| B | 0 | 17 | 0 |
| C | 0 | 17 | 0 |
| D | 0 | 17 | 0 |
| Mode M0 | |||
|---|---|---|---|
| Quadrant | BADHDUFLAG | Total packets | Discarded packets |
| A | 0 | 13921 | 3 |
| B | 0 | 14537 | 2 |
| C | 0 | 14136 | 2 |
| D | 0 | 18474 | 2 |
| Mode SS | |||
|---|---|---|---|
| Quadrant | BADHDUFLAG | Total packets | Discarded packets |
| A | 0 | 140 | 0 |
| B | 0 | 140 | 0 |
| C | 0 | 140 | 0 |
| D | 0 | 140 | 0 |
| Quadrant | Total seconds | Saturated seconds | Saturation percentage |
|---|---|---|---|
| A | 6811 | 29 | 0.425782% |
| B | 6811 | 49 | 0.719424% |
| C | 6811 | 52 | 0.763471% |
| D | 6811 | 131 | 1.923359% |
Noise dominated data is calculated using 1-second bins in cleaned event files. If a bin has >2000 counts, and if more than 50% of those come from <1% of pixels, then it is considered to be noise-dominated and hence unusable.
| Quadrant | # 1 sec bins | Bins with >0 counts | Bins with >2000 counts | High rate bins dominated by noise | Noise dominated (total time) | Noise dominated (detector-on time) | Marked lightcurve |
|---|---|---|---|---|---|---|---|
| A | 8487 | 6814 | 0 | 0 | 0.00% | 0.00% | 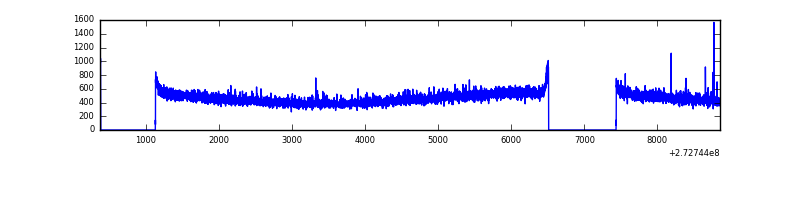 |
| B | 8487 | 6814 | 6 | 6 | 0.07% | 0.09% | 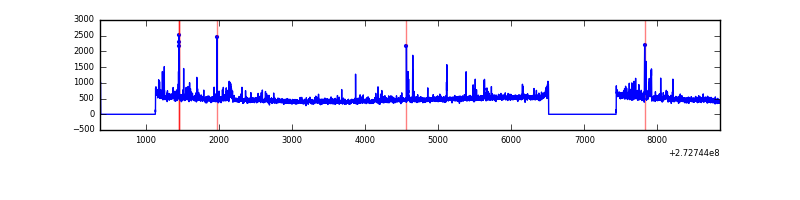 |
| C | 8487 | 6814 | 6 | 6 | 0.07% | 0.09% | 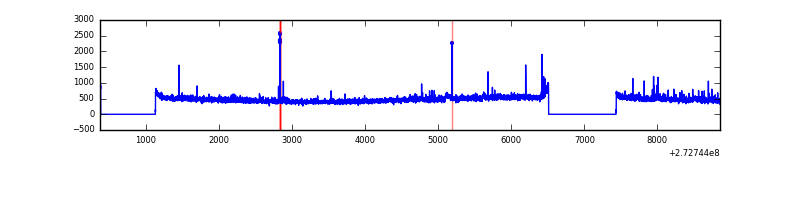 |
| D | 8487 | 6814 | 45 | 45 | 0.53% | 0.66% | 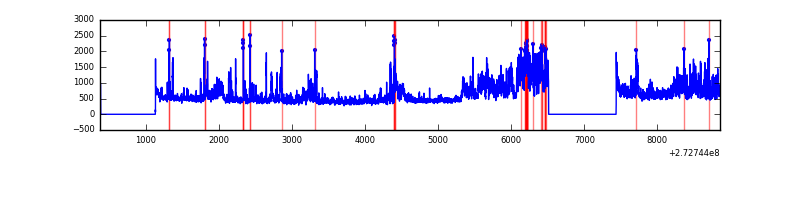 |
Top three noisy pixels from each quadrant. If the there are fewer than three noisy pixels in the level2.evt file, extra rows are filled as -1
| Pixel properties | Quadrant properties | ||||||
|---|---|---|---|---|---|---|---|
| Quadrant | DetID | PixID | Counts | Sigma | Mean | Median | Sigma |
| A | 4 | 2 | 10412 | 57.64 | 815 | 796 | 166.8 |
| A | 0 | 226 | 7284 | 38.89 | 815 | 796 | 166.8 |
| A | 9 | 143 | 6382 | 33.48 | 815 | 796 | 166.8 |
| B | 5 | 236 | 81115 | 518.64 | 816 | 797 | 154.9 |
| B | 4 | 173 | 26630 | 166.81 | 816 | 797 | 154.9 |
| B | 4 | 216 | 25404 | 158.89 | 816 | 797 | 154.9 |
| C | 14 | 238 | 118523 | 646.06 | 777 | 783 | 182.2 |
| C | 7 | 221 | 52307 | 282.72 | 777 | 783 | 182.2 |
| C | 10 | 22 | 23313 | 123.63 | 777 | 783 | 182.2 |
| D | 1 | 52 | 1250242 | 6504.86 | 784 | 760 | 192.1 |
| D | 12 | 110 | 297720 | 1545.99 | 784 | 760 | 192.1 |
| D | 2 | 234 | 31286 | 158.92 | 784 | 760 | 192.1 |
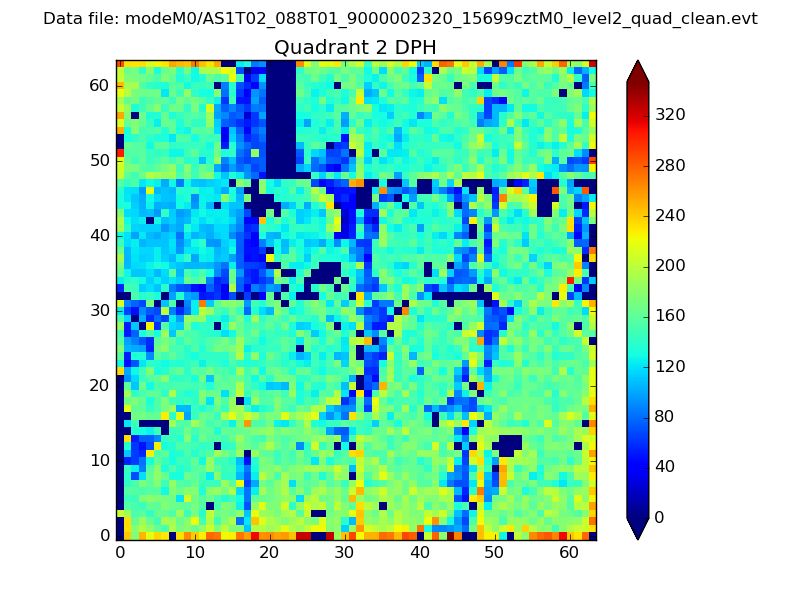
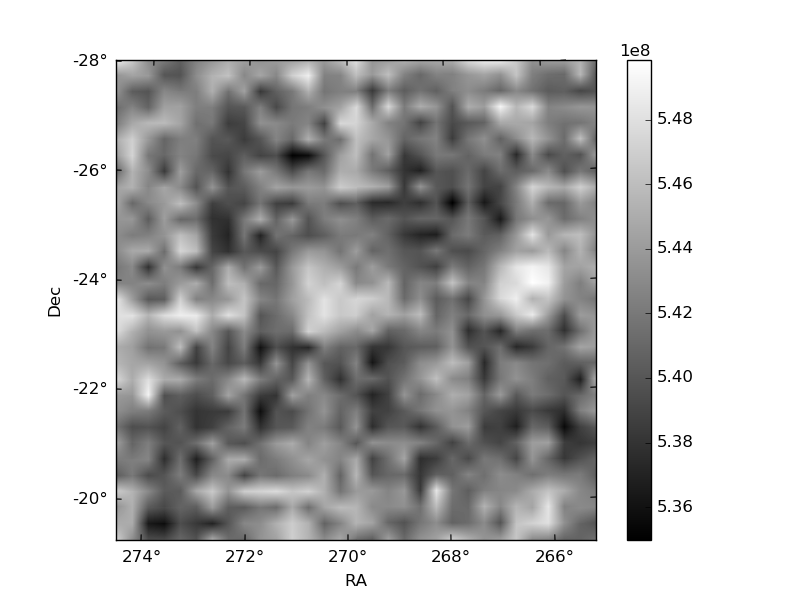
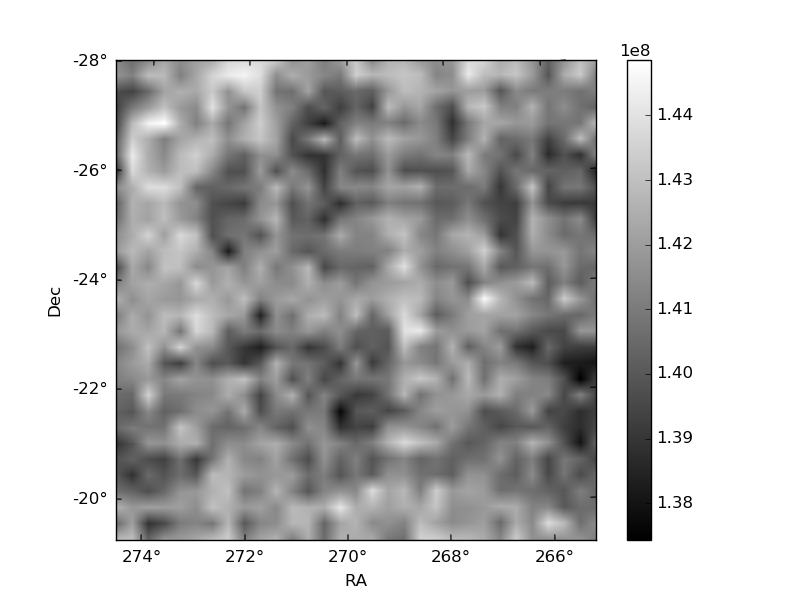
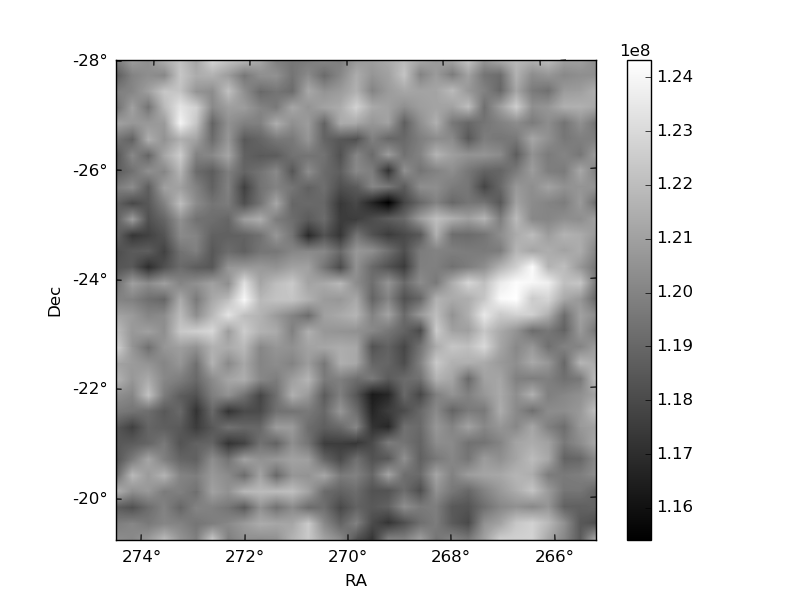
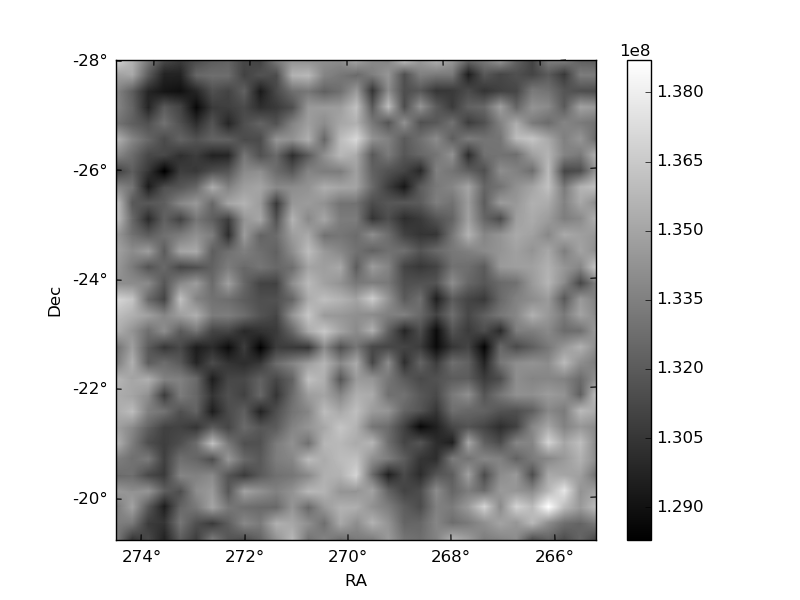
Histogram calculated using DETX and DETY for each event in the final _common_clean file
| Quadrant A | 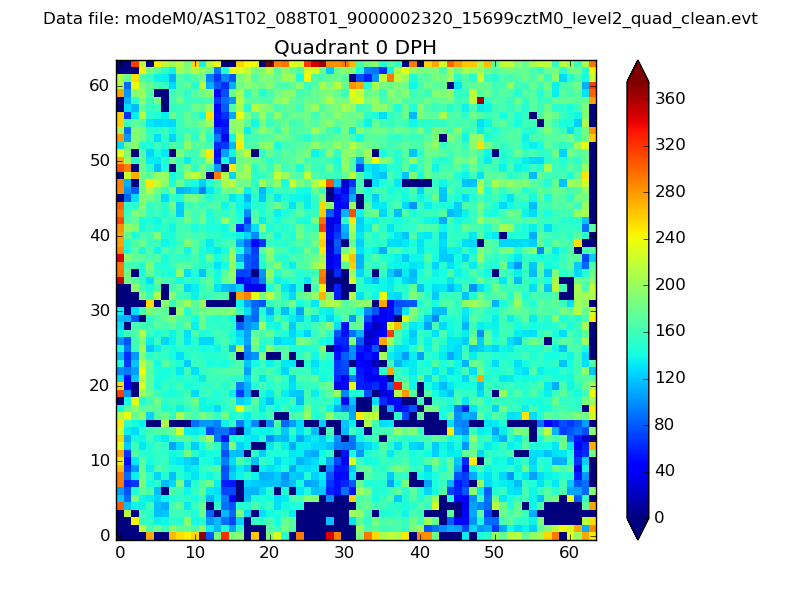 |
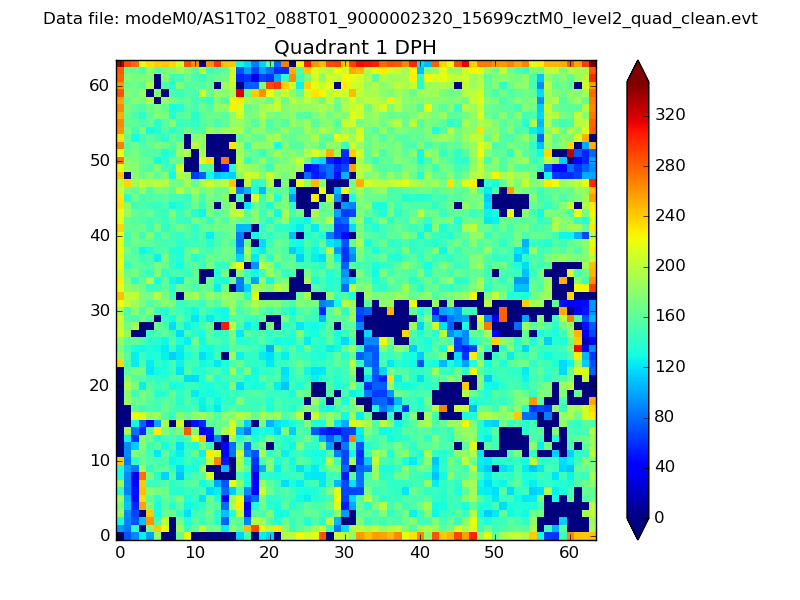 |
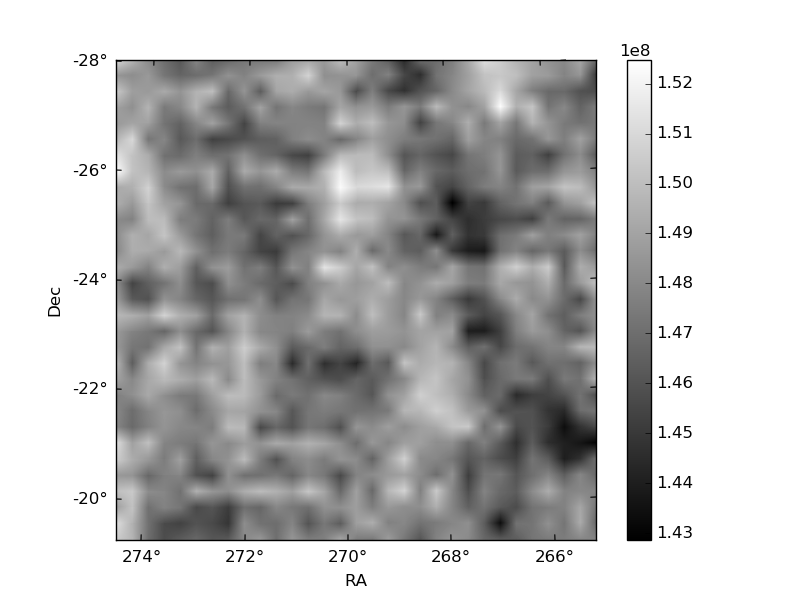
Quadrant B |
|---|---|---|---|
| Quadrant D | 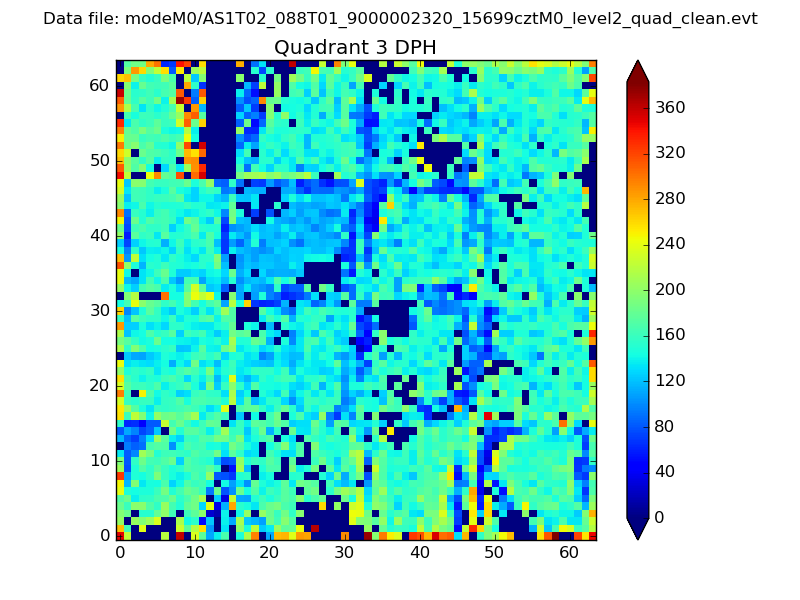 |
 |
Quadrant C |
| Plot type | Count rate plots | Images |
|---|---|---|
| Comparison with Poisson distribution Blue bars denote a histogram of data divided into 1 sec bins. Red curve is a Poisson curve with rate = median count rate of data. |
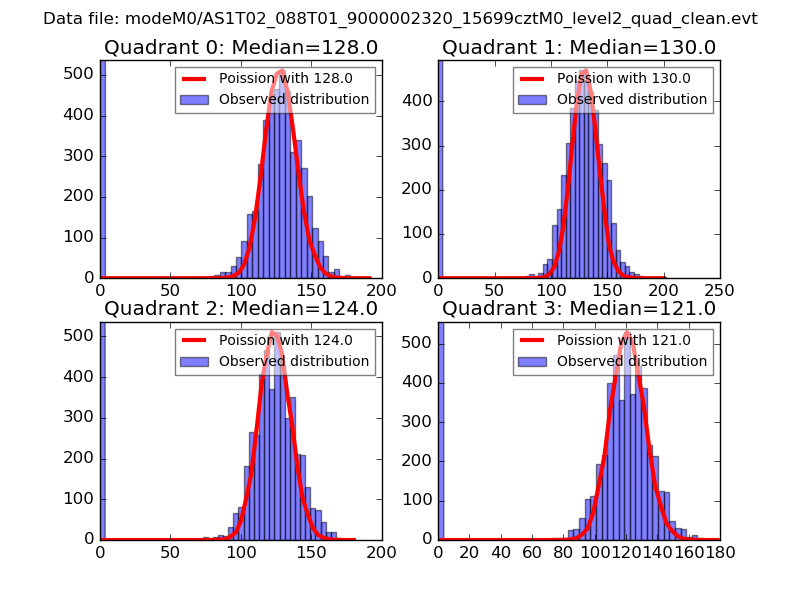 |
 |
| Quadrant-wise count rates Data is divided into 100 sec bins |
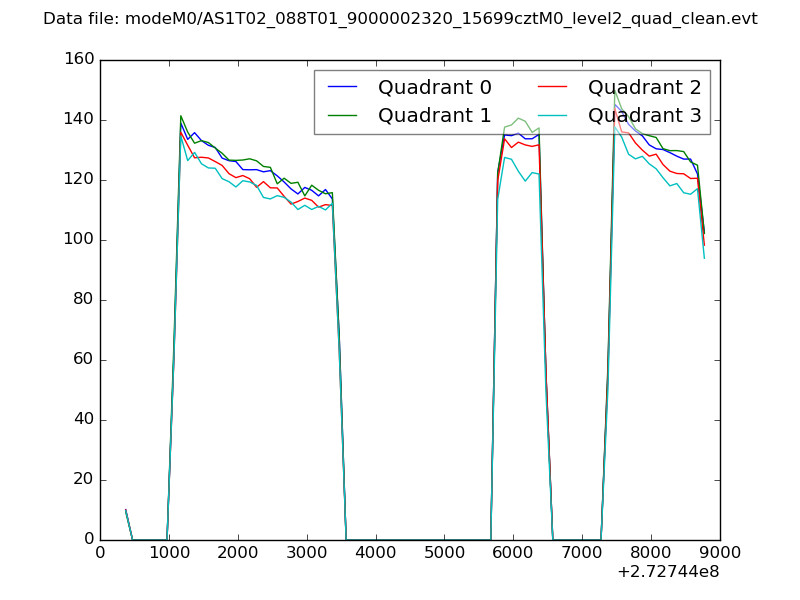 |
|
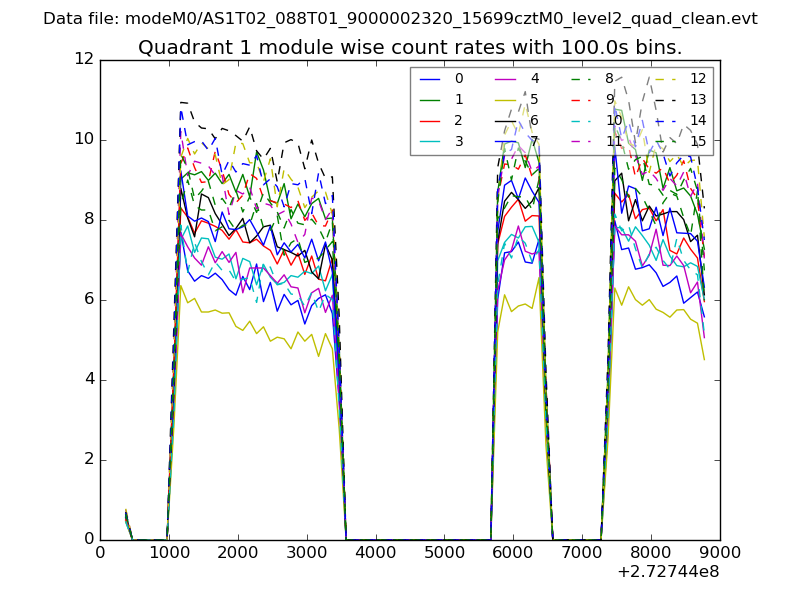
| Module-wise count rates for Quadrant A Data is divided into 100 sec bins |
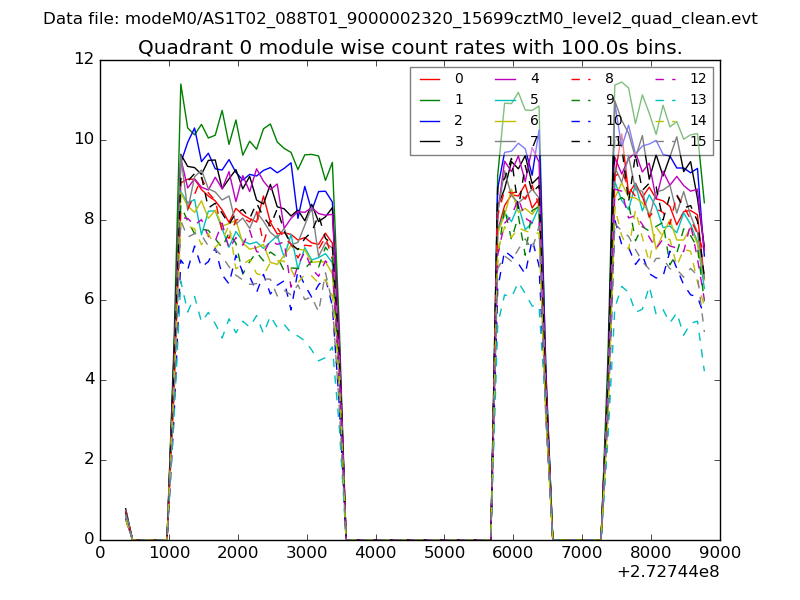 |
 |
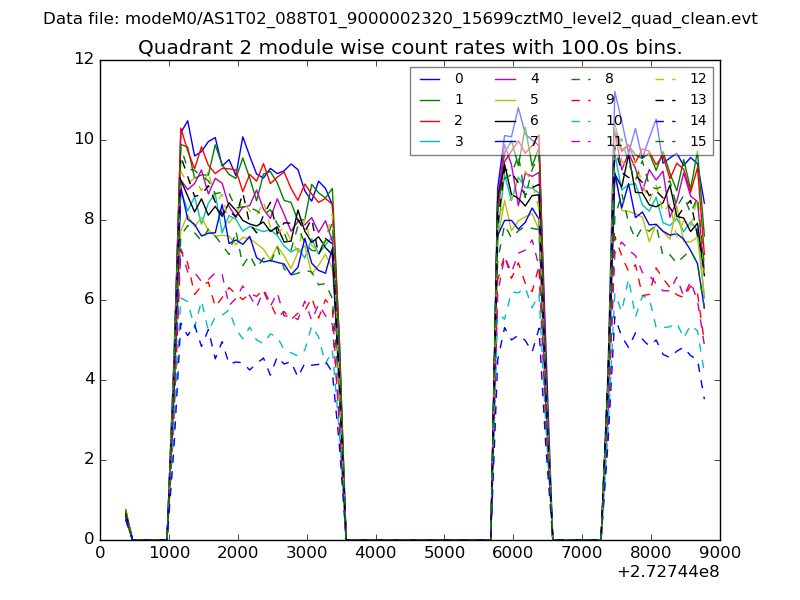
| Module-wise count rates for Quadrant B Data is divided into 100 sec bins |
 |
 |
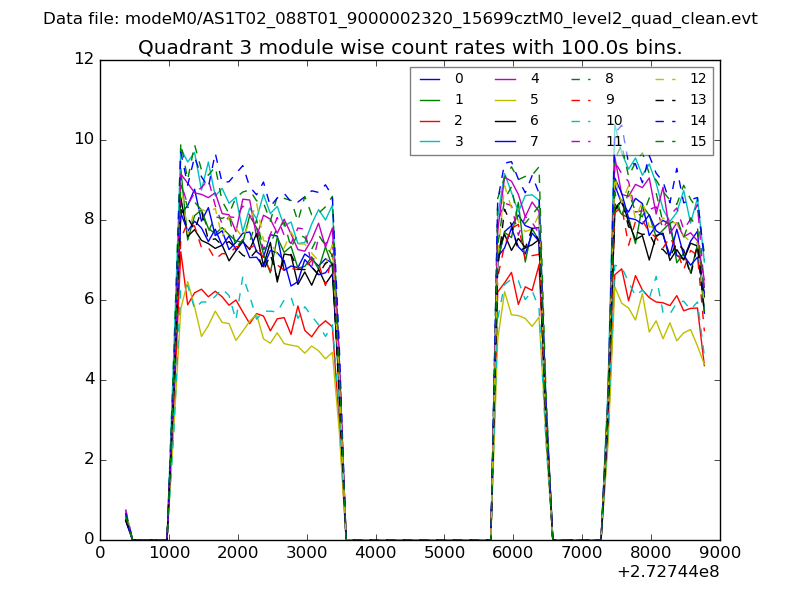
| Module-wise count rates for Quadrant C Data is divided into 100 sec bins |
 |
 |
| Module-wise count rates for Quadrant D Data is divided into 100 sec bins |
 |
 |
| Parameter | Plot |
|---|---|
| CZT HV Monitor | 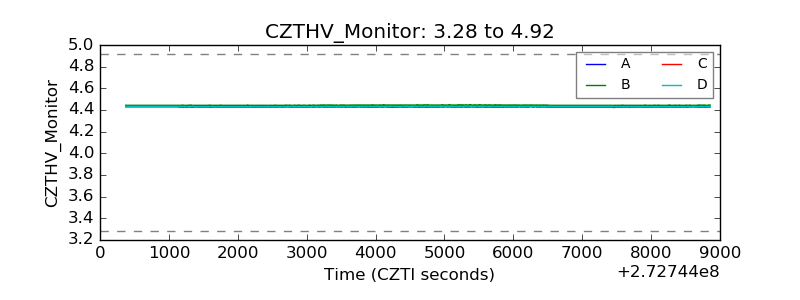 |
| D_VDD | 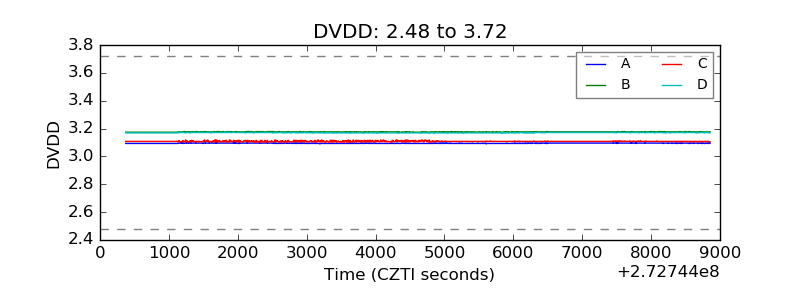 |
| Temperature 1 | 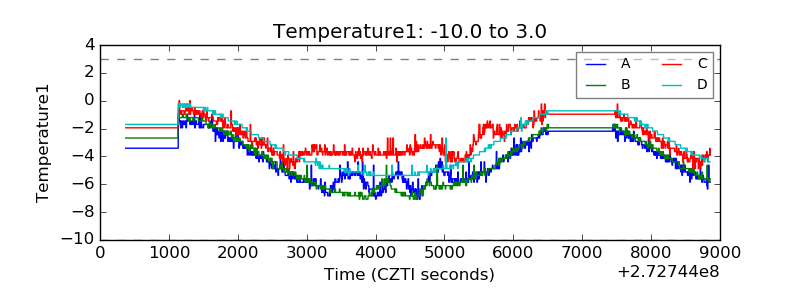 |
| Veto HV Monitor | 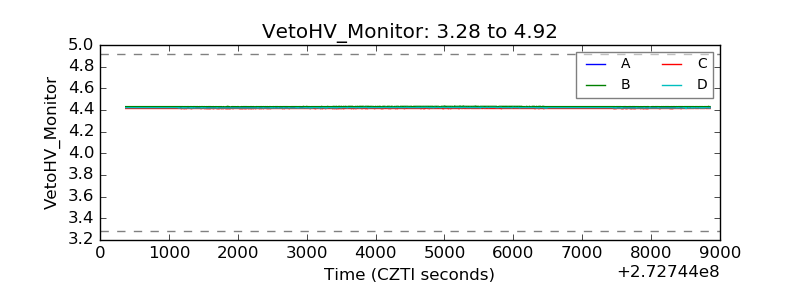 |
| Veto LLD | 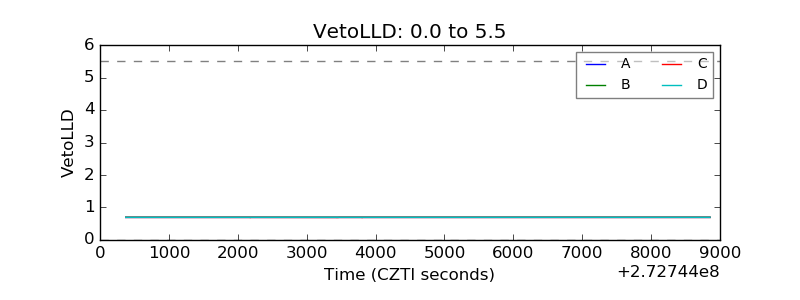 |
| Alpha Counter | 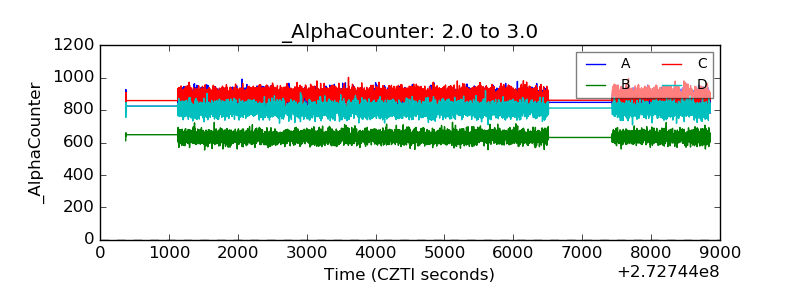 |
| _CPM_Rate | 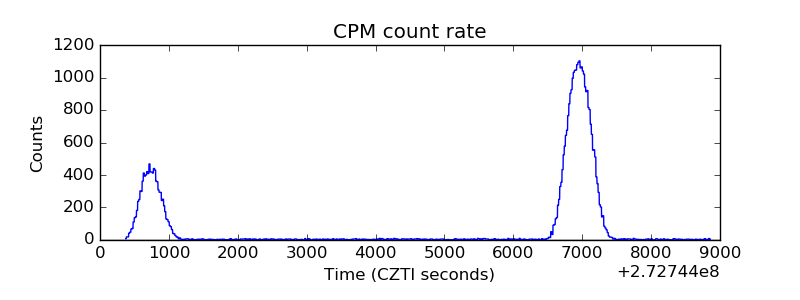 |
| CZT Counter | 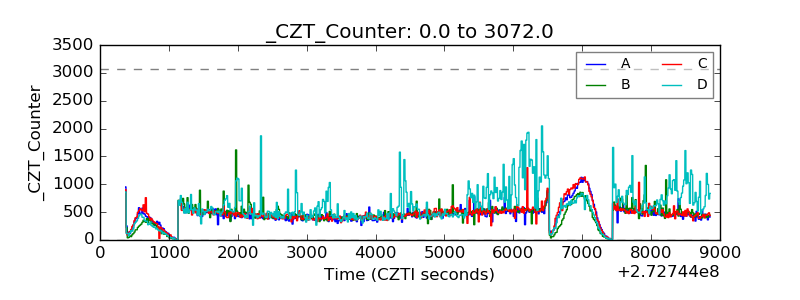 |
| +2.5 Volts monitor | 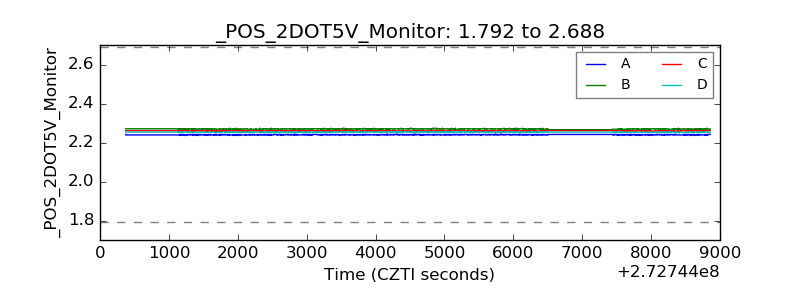 |
| +5 Volts monitor | 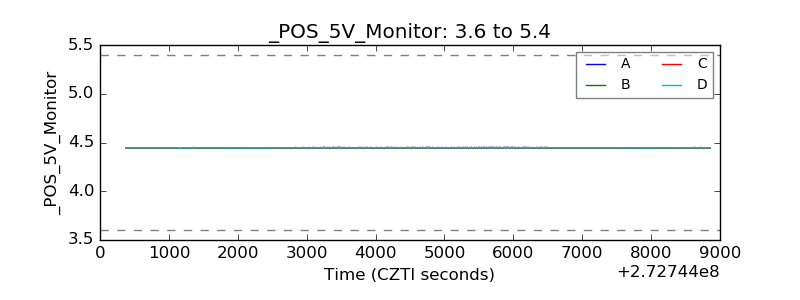 |
| _ROLL_ROT | 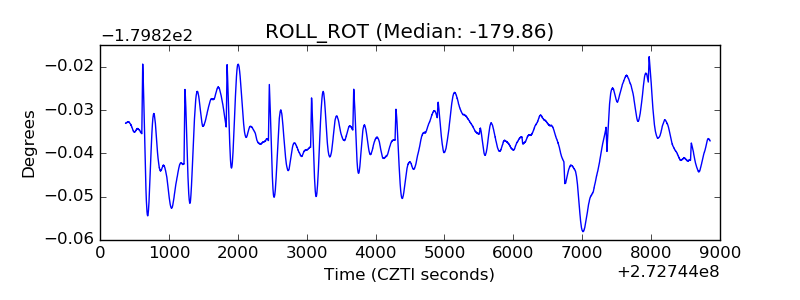 |
| _Roll_DEC | 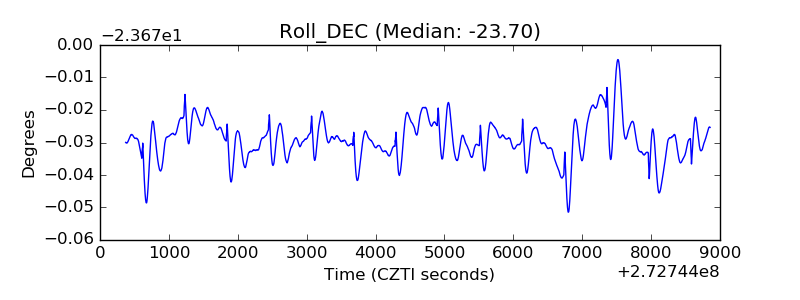 |
| _Roll_RA |  |
| Veto Counter | 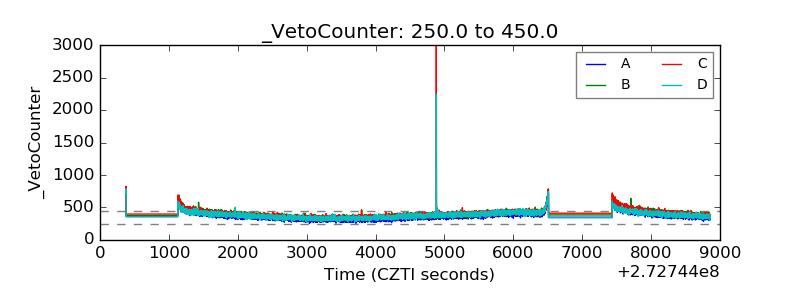 |