| Param | Original file | Final file |
|---|---|---|
| Filename | modeM0/AS1T02_088T01_9000002320_15700cztM0_level2.evt | modeM0/AS1T02_088T01_9000002320_15700cztM0_level2_quad_clean.evt |
| Size (bytes) | 449,101,440 | 87,848,640 |
| Size | 428.3 MB | 83.8 MB |
| Events in quadrant A | 3,034,180 | 563,463 |
| Events in quadrant B | 3,307,081 | 571,907 |
| Events in quadrant C | 3,098,897 | 544,480 |
| Events in quadrant D | 3,720,689 | 528,610 |
| Mode M9 | |||
|---|---|---|---|
| Quadrant | BADHDUFLAG | Total packets | Discarded packets |
| A | 0 | 20 | 0 |
| B | 0 | 20 | 0 |
| C | 0 | 20 | 0 |
| D | 0 | 20 | 0 |
| Mode M0 | |||
|---|---|---|---|
| Quadrant | BADHDUFLAG | Total packets | Discarded packets |
| A | 0 | 13257 | 3 |
| B | 0 | 13960 | 2 |
| C | 0 | 13321 | 2 |
| D | 0 | 15444 | 2 |
| Mode SS | |||
|---|---|---|---|
| Quadrant | BADHDUFLAG | Total packets | Discarded packets |
| A | 0 | 132 | 0 |
| B | 0 | 132 | 0 |
| C | 0 | 132 | 0 |
| D | 0 | 132 | 0 |
| Quadrant | Total seconds | Saturated seconds | Saturation percentage |
|---|---|---|---|
| A | 6484 | 12 | 0.185071% |
| B | 6484 | 33 | 0.508945% |
| C | 6484 | 79 | 1.218384% |
| D | 6484 | 38 | 0.586058% |
Noise dominated data is calculated using 1-second bins in cleaned event files. If a bin has >2000 counts, and if more than 50% of those come from <1% of pixels, then it is considered to be noise-dominated and hence unusable.
| Quadrant | # 1 sec bins | Bins with >0 counts | Bins with >2000 counts | High rate bins dominated by noise | Noise dominated (total time) | Noise dominated (detector-on time) | Marked lightcurve |
|---|---|---|---|---|---|---|---|
| A | 8480 | 6487 | 0 | 0 | 0.00% | 0.00% | 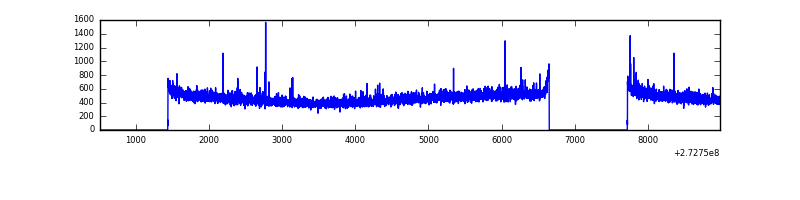 |
| B | 8480 | 6487 | 5 | 5 | 0.06% | 0.08% | 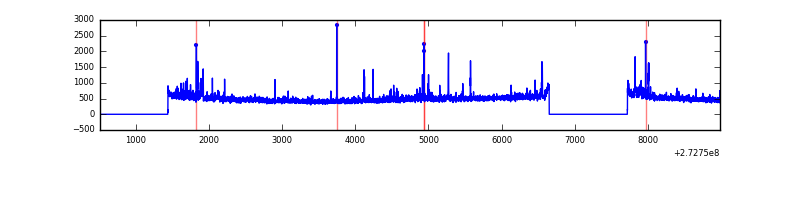 |
| C | 8480 | 6487 | 0 | 0 | 0.00% | 0.00% | 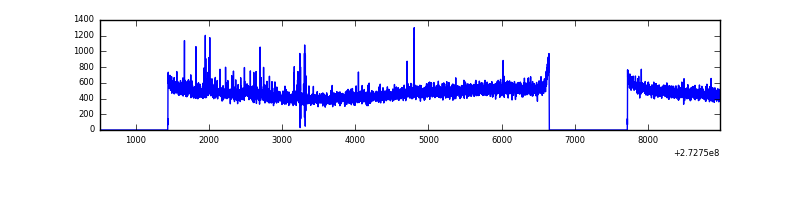 |
| D | 8480 | 6487 | 19 | 19 | 0.22% | 0.29% | 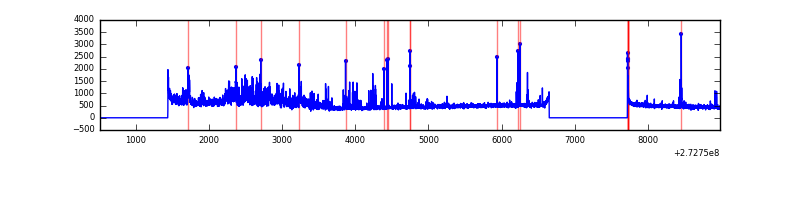 |
Top three noisy pixels from each quadrant. If the there are fewer than three noisy pixels in the level2.evt file, extra rows are filled as -1
| Pixel properties | Quadrant properties | ||||||
|---|---|---|---|---|---|---|---|
| Quadrant | DetID | PixID | Counts | Sigma | Mean | Median | Sigma |
| A | 9 | 143 | 11278 | 66.01 | 783 | 768 | 159.2 |
| A | 4 | 2 | 9819 | 56.84 | 783 | 768 | 159.2 |
| A | 0 | 226 | 6922 | 38.65 | 783 | 768 | 159.2 |
| B | 5 | 236 | 108351 | 719.28 | 788 | 771 | 149.6 |
| B | 4 | 216 | 36721 | 240.36 | 788 | 771 | 149.6 |
| B | 12 | 111 | 17177 | 109.69 | 788 | 771 | 149.6 |
| C | 14 | 238 | 128906 | 733.12 | 746 | 751 | 174.8 |
| C | 7 | 221 | 27474 | 152.87 | 746 | 751 | 174.8 |
| C | 3 | 233 | 10221 | 54.17 | 746 | 751 | 174.8 |
| D | 1 | 52 | 781709 | 4205.08 | 751 | 727 | 185.7 |
| D | 10 | 70 | 42896 | 227.05 | 751 | 727 | 185.7 |
| D | 12 | 221 | 30016 | 157.7 | 751 | 727 | 185.7 |
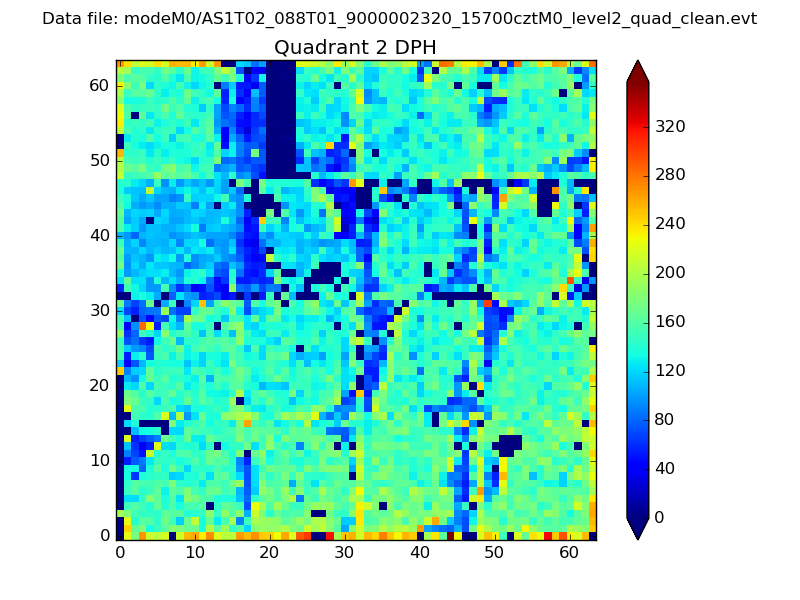
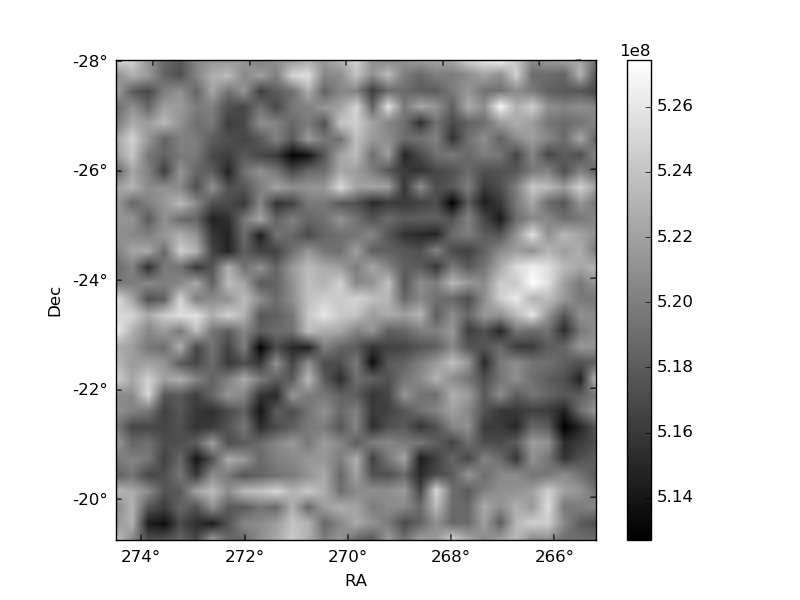
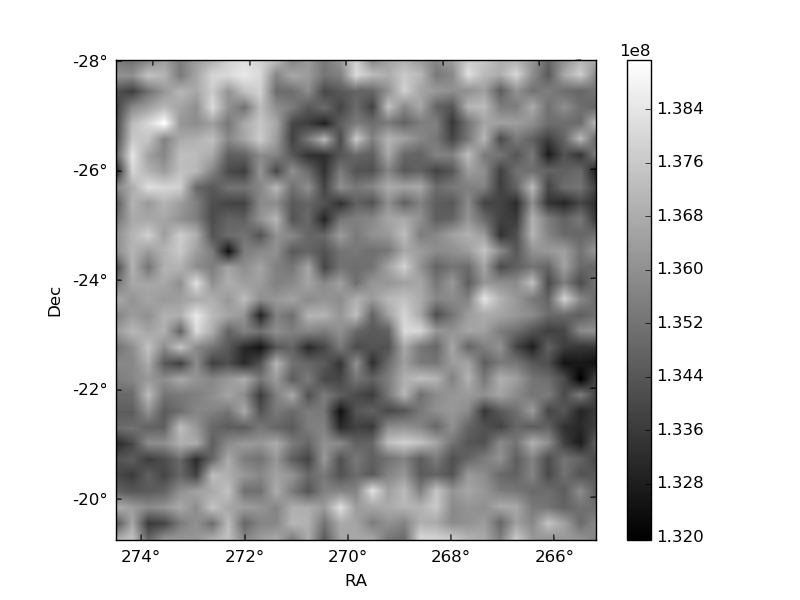
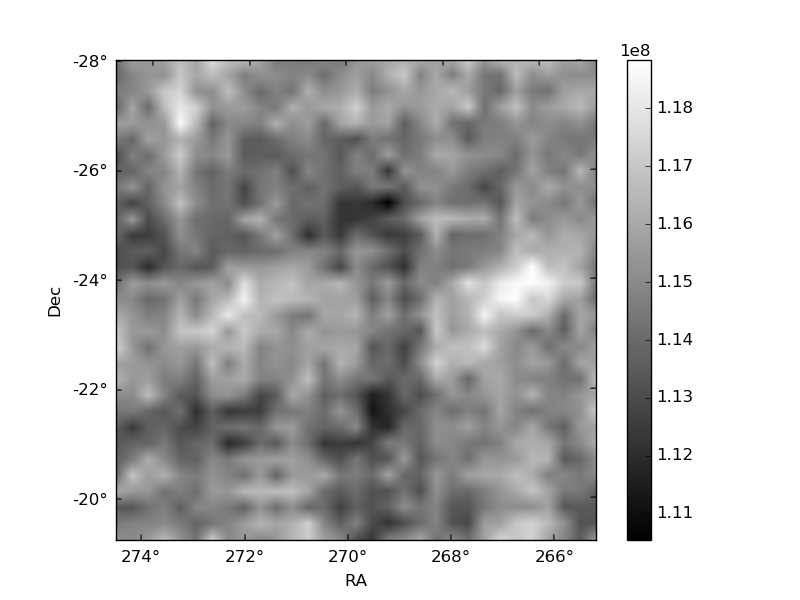
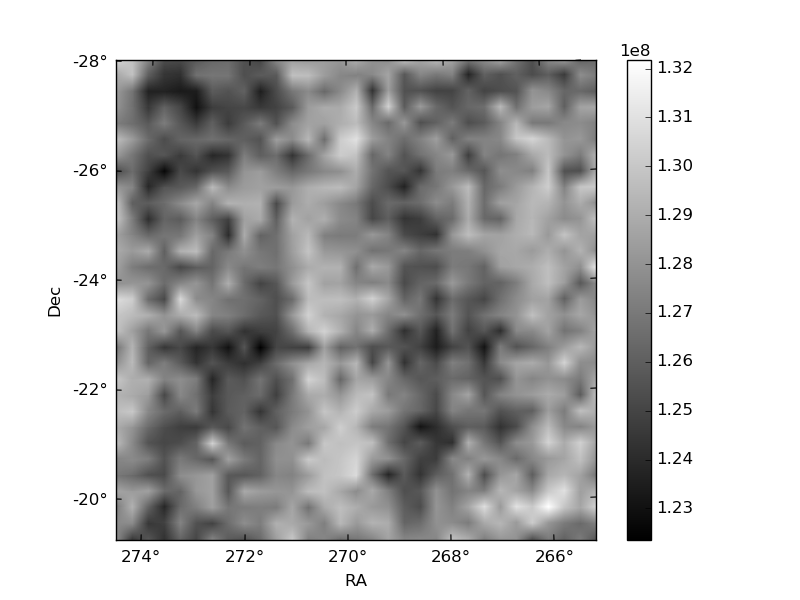
Histogram calculated using DETX and DETY for each event in the final _common_clean file
| Quadrant A | 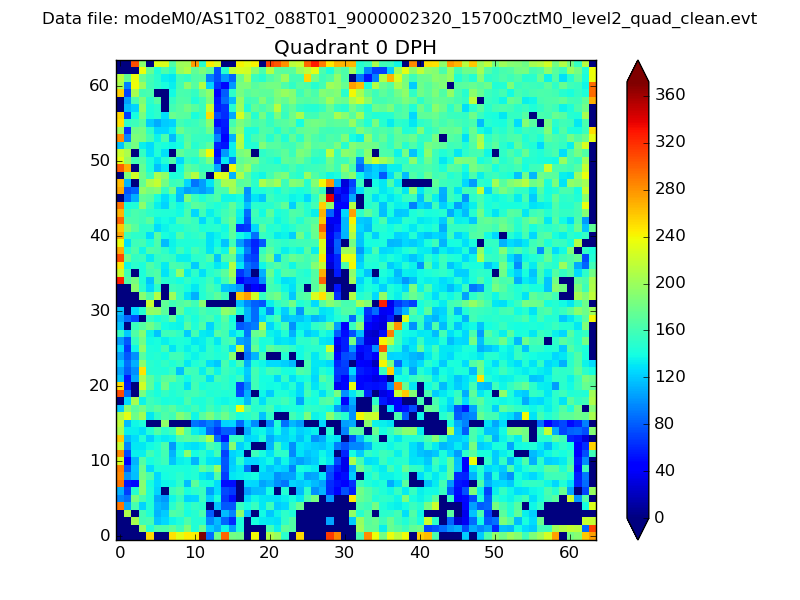 |
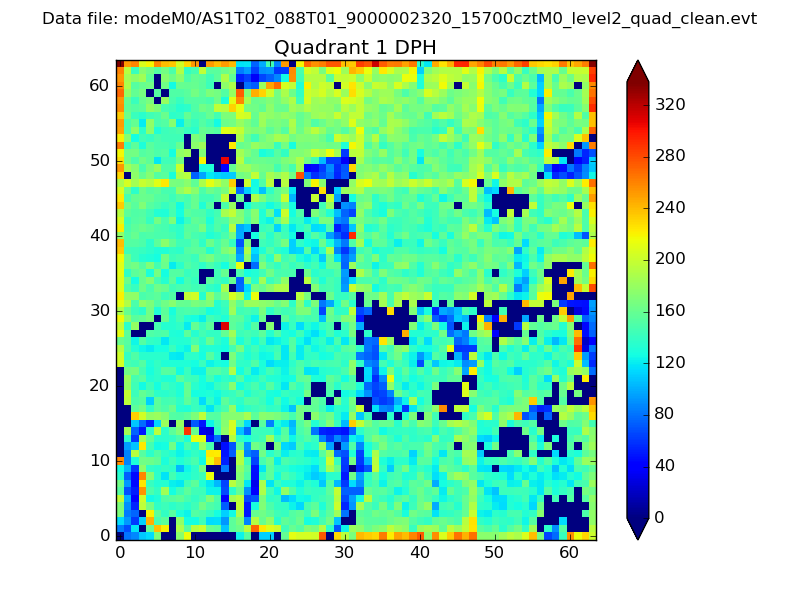 |
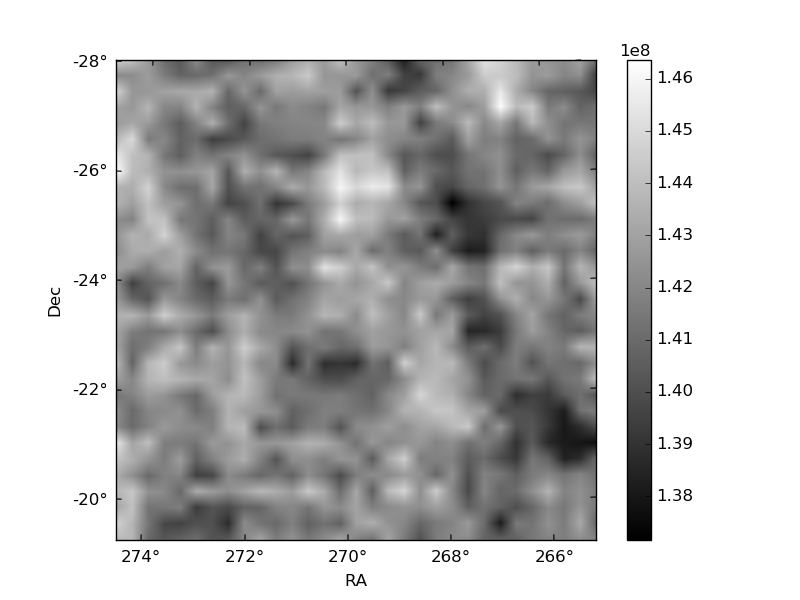
Quadrant B |
|---|---|---|---|
| Quadrant D | 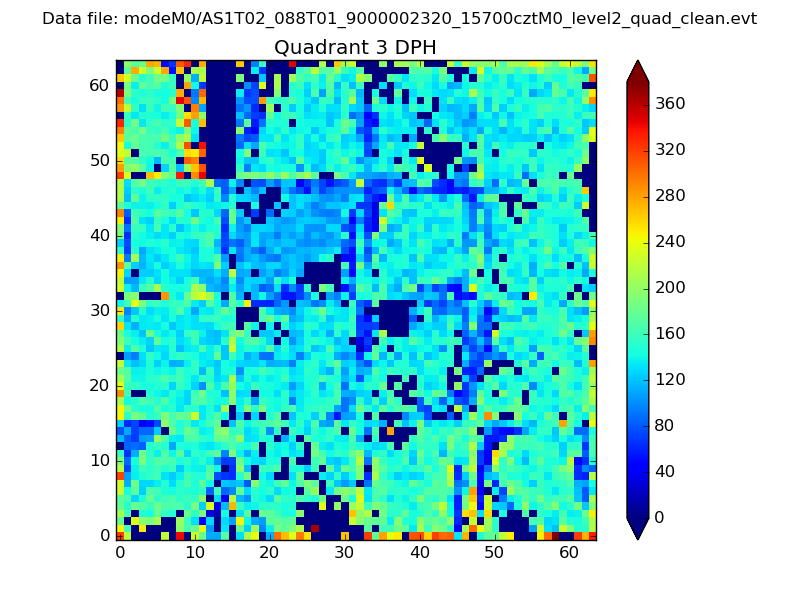 |
 |
Quadrant C |
| Plot type | Count rate plots | Images |
|---|---|---|
| Comparison with Poisson distribution Blue bars denote a histogram of data divided into 1 sec bins. Red curve is a Poisson curve with rate = median count rate of data. |
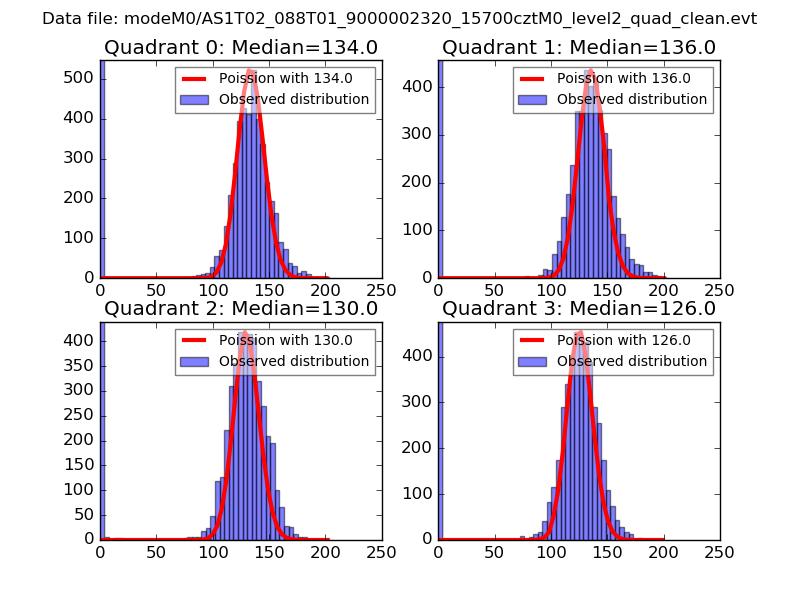 |
 |
| Quadrant-wise count rates Data is divided into 100 sec bins |
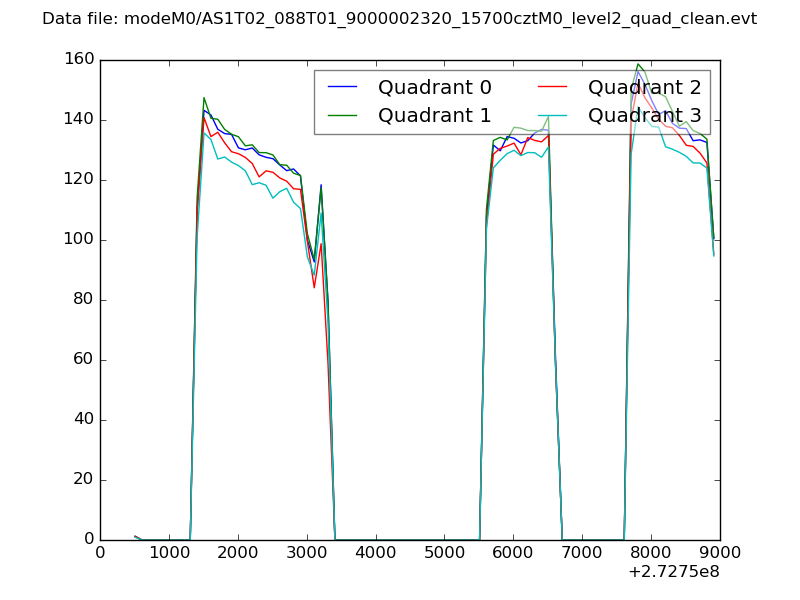 |
|
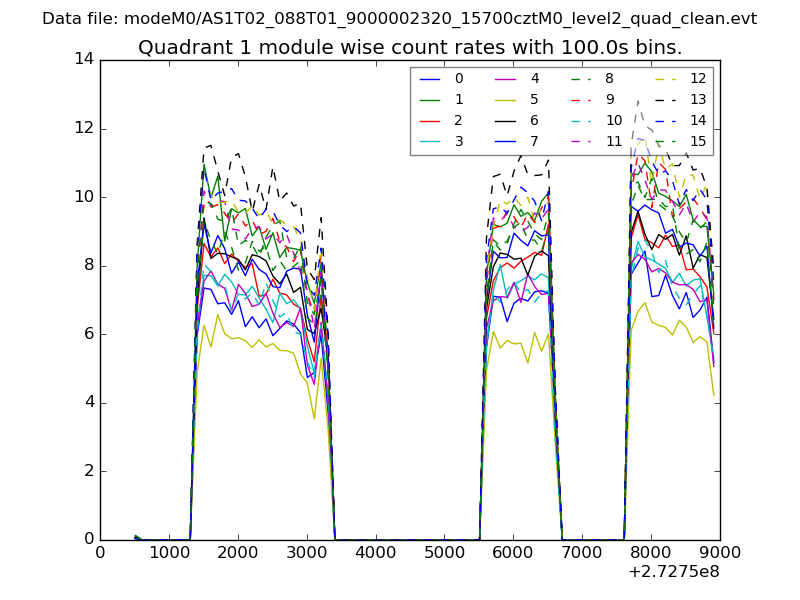
| Module-wise count rates for Quadrant A Data is divided into 100 sec bins |
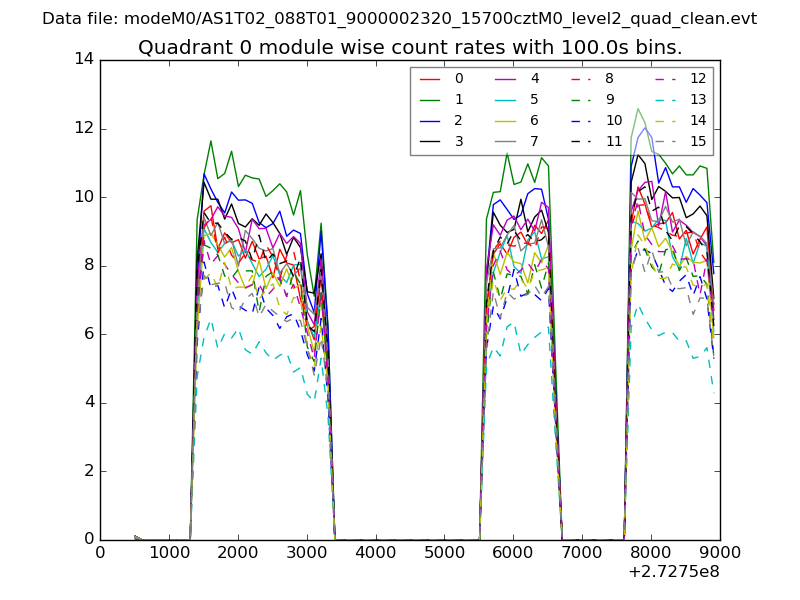 |
 |
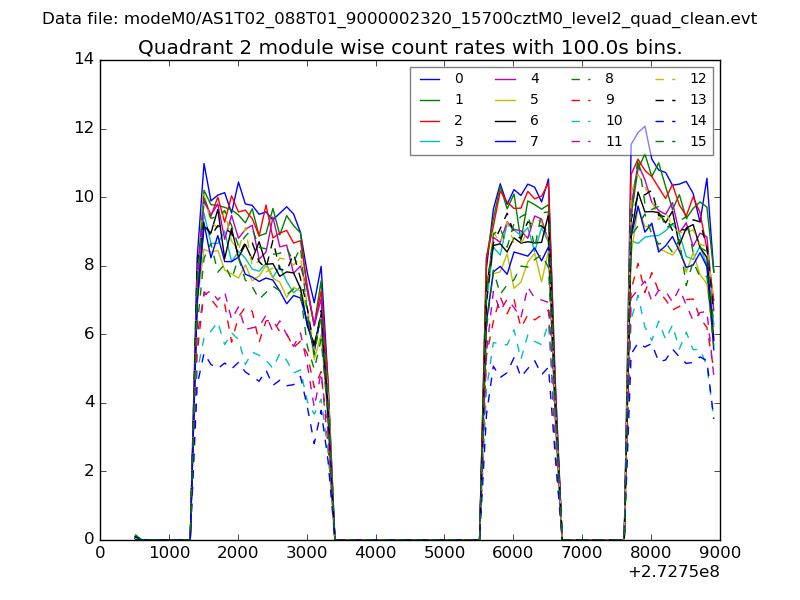
| Module-wise count rates for Quadrant B Data is divided into 100 sec bins |
 |
 |
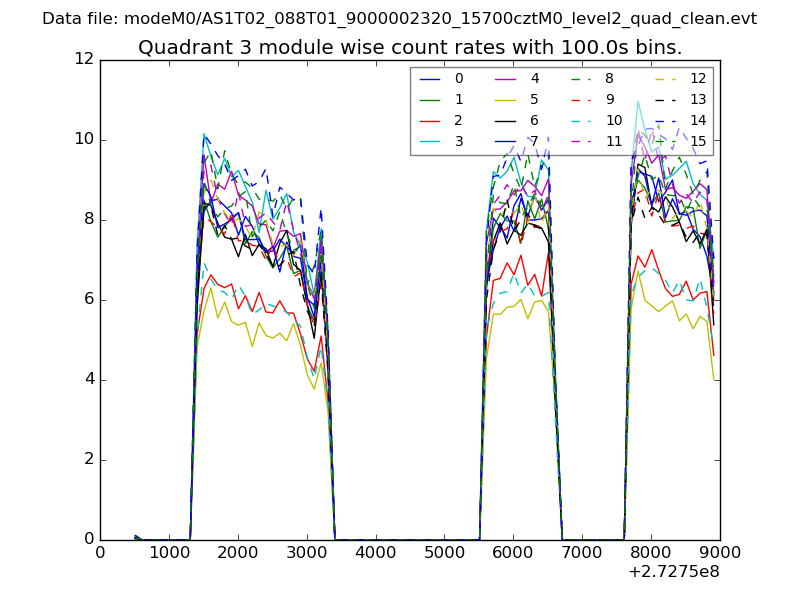
| Module-wise count rates for Quadrant C Data is divided into 100 sec bins |
 |
 |
| Module-wise count rates for Quadrant D Data is divided into 100 sec bins |
 |
 |
| Parameter | Plot |
|---|---|
| CZT HV Monitor | 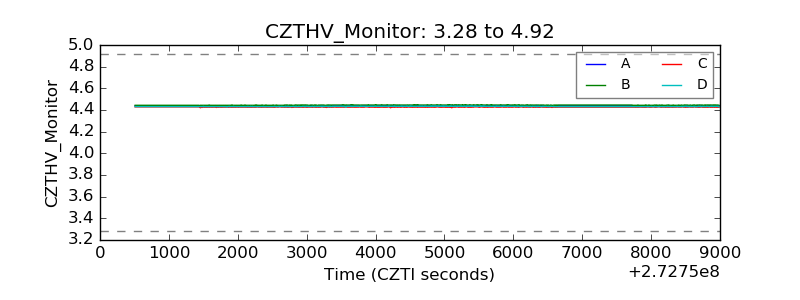 |
| D_VDD | 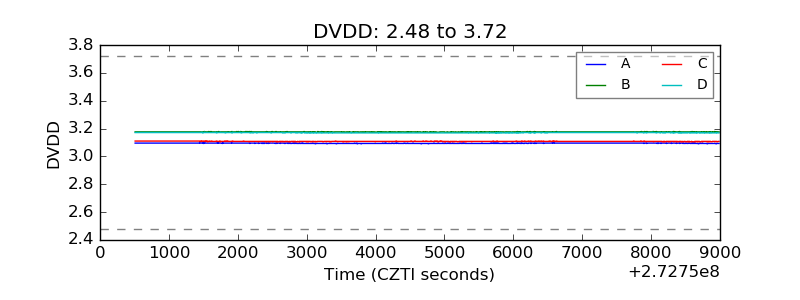 |
| Temperature 1 | 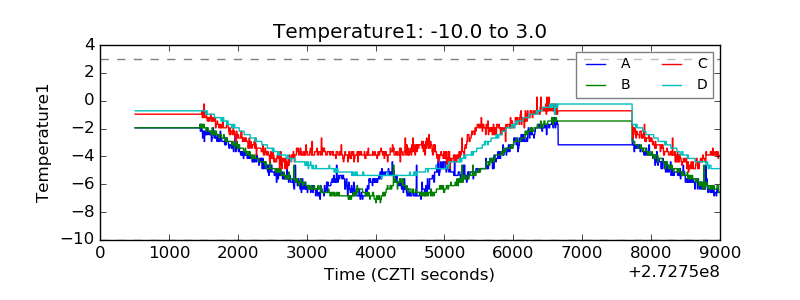 |
| Veto HV Monitor | 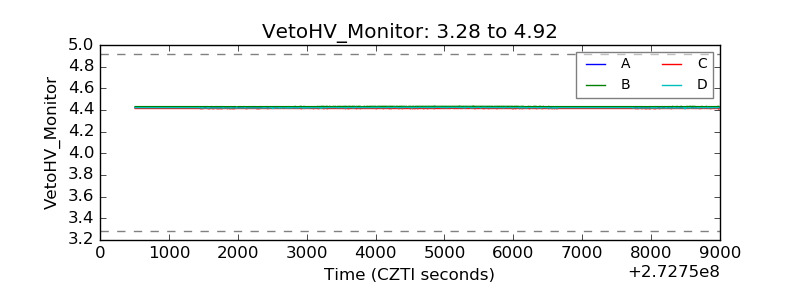 |
| Veto LLD | 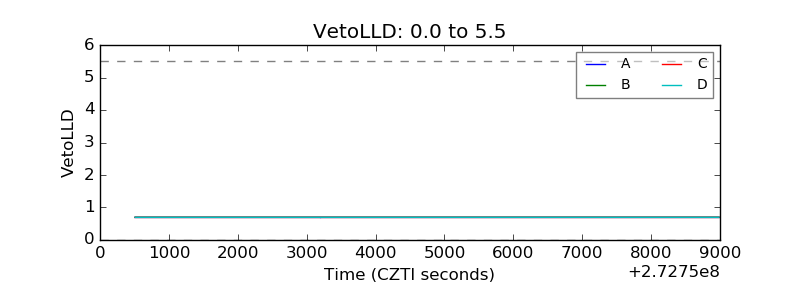 |
| Alpha Counter |  |
| _CPM_Rate |  |
| CZT Counter | 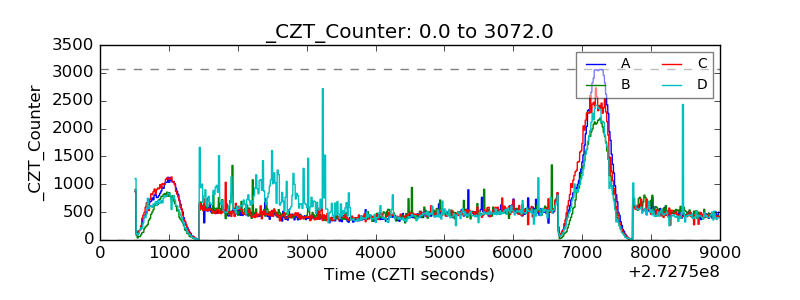 |
| +2.5 Volts monitor |  |
| +5 Volts monitor |  |
| _ROLL_ROT | 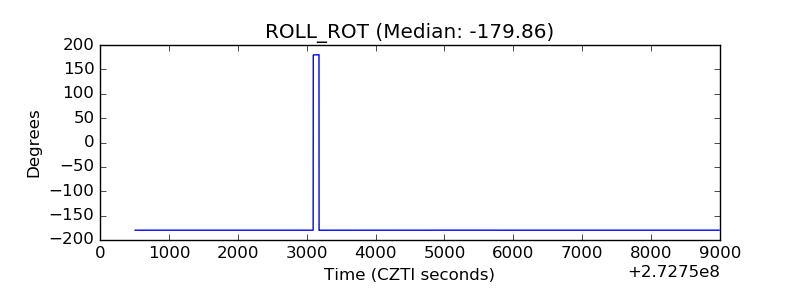 |
| _Roll_DEC | 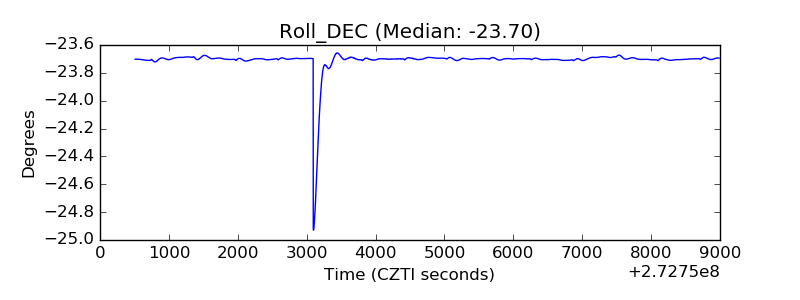 |
| _Roll_RA | 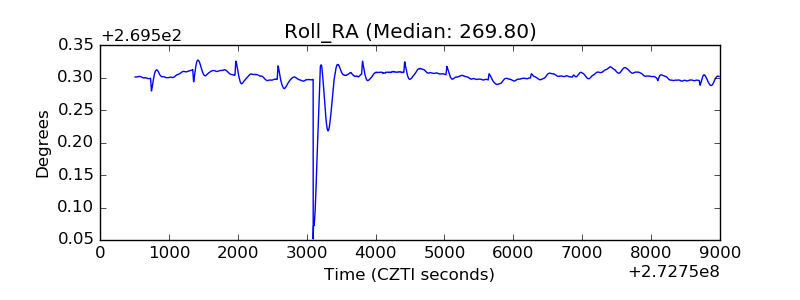 |
| Veto Counter | 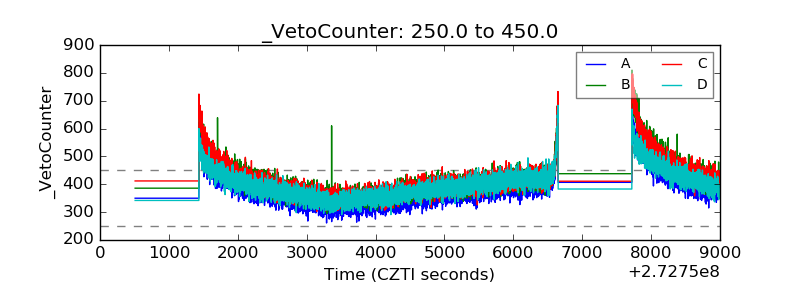 |