| Param | Original file | Final file |
|---|---|---|
| Filename | modeM0/AS1A04_198T01_9000002322cztM0_level2.fits | modeM0/AS1A04_198T01_9000002322cztM0_level2_quad_clean.evt |
| Size (bytes) | 998,248,320 | 916,810,560 |
| Size | 952.0 MB | 874.3 MB |
| Events in quadrant A | 6,028,862 | 5,335,119 |
| Events in quadrant B | 5,829,360 | 5,393,707 |
| Events in quadrant C | 6,025,624 | 5,175,221 |
| Events in quadrant D | 5,237,708 | 4,752,188 |
| Mode M0 | |||
|---|---|---|---|
| Quadrant | BADHDUFLAG | Total packets | Discarded packets |
| A | 0 | 224550 | 0 |
| B | 0 | 219391 | 0 |
| C | 0 | 228844 | 0 |
| D | 0 | 241911 | 0 |
| Mode SS | |||
|---|---|---|---|
| Quadrant | BADHDUFLAG | Total packets | Discarded packets |
| A | 0 | 2116 | 0 |
| B | 0 | 2116 | 0 |
| C | 0 | 2116 | 0 |
| D | 0 | 2116 | 0 |
| Mode M9 | |||
|---|---|---|---|
| Quadrant | BADHDUFLAG | Total packets | Discarded packets |
| A | 0 | 182 | 0 |
| B | 0 | 182 | 0 |
| C | 0 | 182 | 0 |
| D | 0 | 182 | 0 |
| Quadrant | Total seconds | Saturated seconds | Saturation percentage |
|---|---|---|---|
| A | 103723 | 2561 | 2.469076% |
| B | 103723 | 1648 | 1.588847% |
| C | 103723 | 1973 | 1.902182% |
| D | 103723 | 2759 | 2.659969% |
Noise dominated data is calculated using 1-second bins in cleaned event files. If a bin has >2000 counts, and if more than 50% of those come from <1% of pixels, then it is considered to be noise-dominated and hence unusable.
| Quadrant | # 1 sec bins | Bins with >0 counts | Bins with >2000 counts | High rate bins dominated by noise | Noise dominated (total time) | Noise dominated (detector-on time) | Marked lightcurve |
|---|---|---|---|---|---|---|---|
| A | 121968 | 103718 | 0 | 0 | 0.00% | 0.00% | 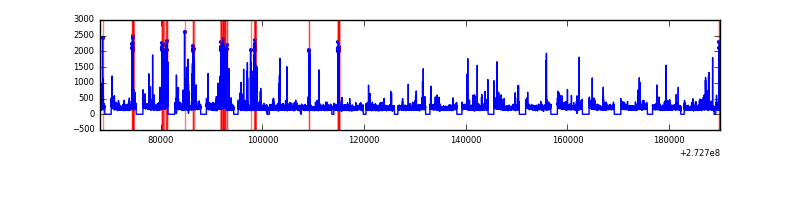 |
| B | 121968 | 103723 | 0 | 0 | 0.00% | 0.00% | 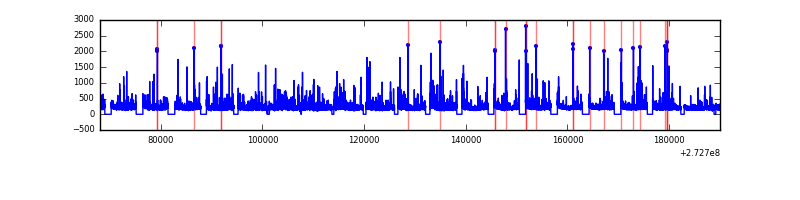 |
| C | 121968 | 103721 | 0 | 0 | 0.00% | 0.00% | 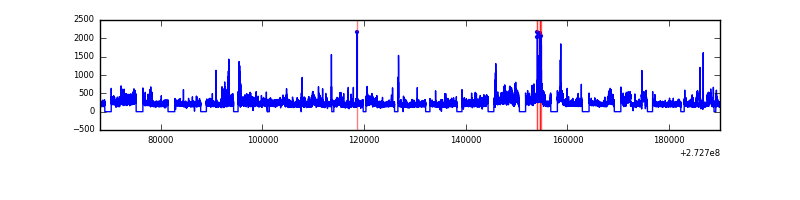 |
| D | 121968 | 103705 | 0 | 0 | 0.00% | 0.00% | 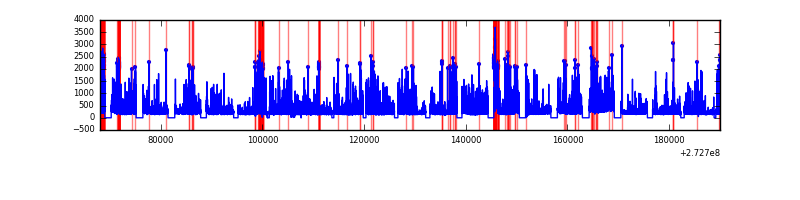 |
Top three noisy pixels from each quadrant. If the there are fewer than three noisy pixels in the level2.evt file, extra rows are filled as -1
| Pixel properties | Quadrant properties | ||||||
|---|---|---|---|---|---|---|---|
| Quadrant | DetID | PixID | Counts | Sigma | Mean | Median | Sigma |
| A | 0 | 29 | 5731 | 11.09 | 1567 | 1470 | 384.1 |
| A | 7 | 110 | 4760 | 8.57 | 1567 | 1470 | 384.1 |
| A | 15 | 236 | 4572 | 8.08 | 1567 | 1470 | 384.1 |
| B | 2 | 9 | 4723 | 10.7 | 1543 | 1467 | 304.4 |
| B | 2 | 8 | 3942 | 8.13 | 1543 | 1467 | 304.4 |
| B | 5 | 128 | 3888 | 7.95 | 1543 | 1467 | 304.4 |
| C | 1 | 81 | 4572 | 7.61 | 1591 | 1491 | 404.9 |
| C | 1 | 80 | 4562 | 7.58 | 1591 | 1491 | 404.9 |
| C | 12 | 241 | 4247 | 6.81 | 1591 | 1491 | 404.9 |
| D | 6 | 231 | 3852 | 6.3 | 1495 | 1364 | 394.9 |
| D | 3 | 14 | 3850 | 6.3 | 1495 | 1364 | 394.9 |
| D | 6 | 67 | 3566 | 5.58 | 1495 | 1364 | 394.9 |
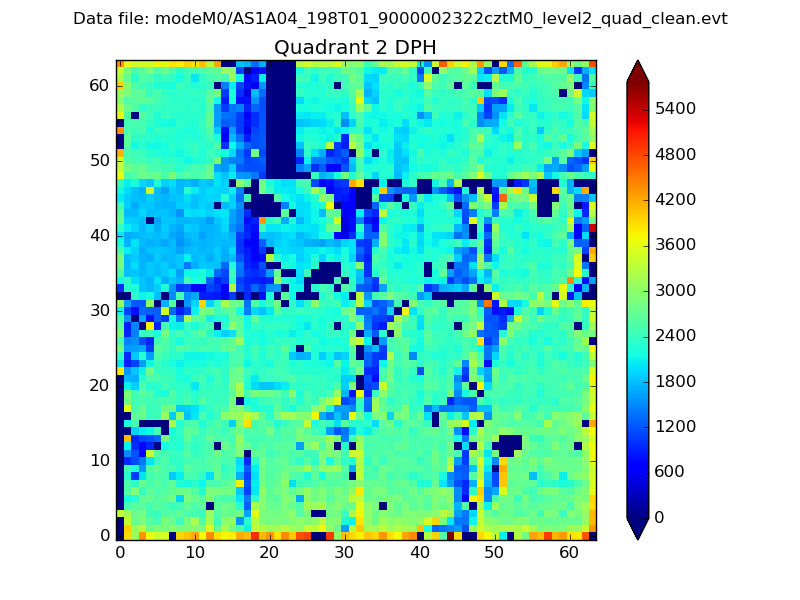
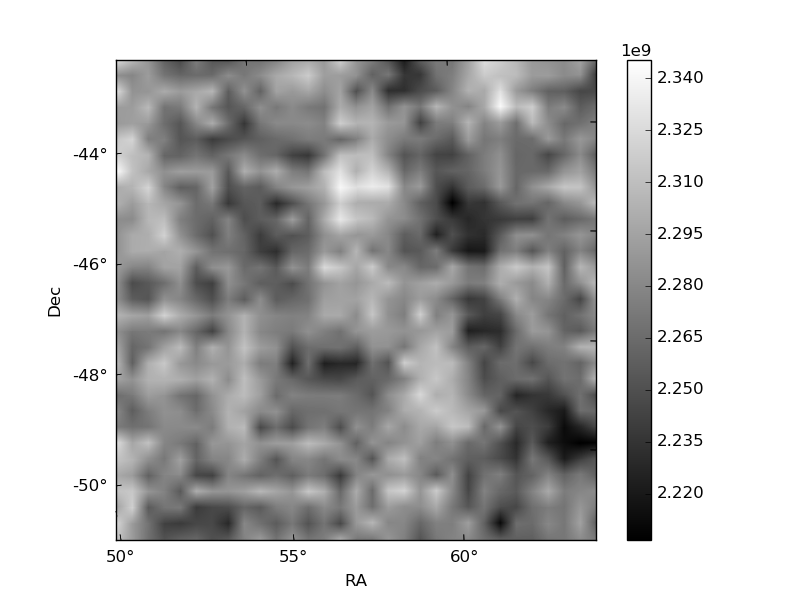
Histogram calculated using DETX and DETY for each event in the final _common_clean file
| Quadrant A | 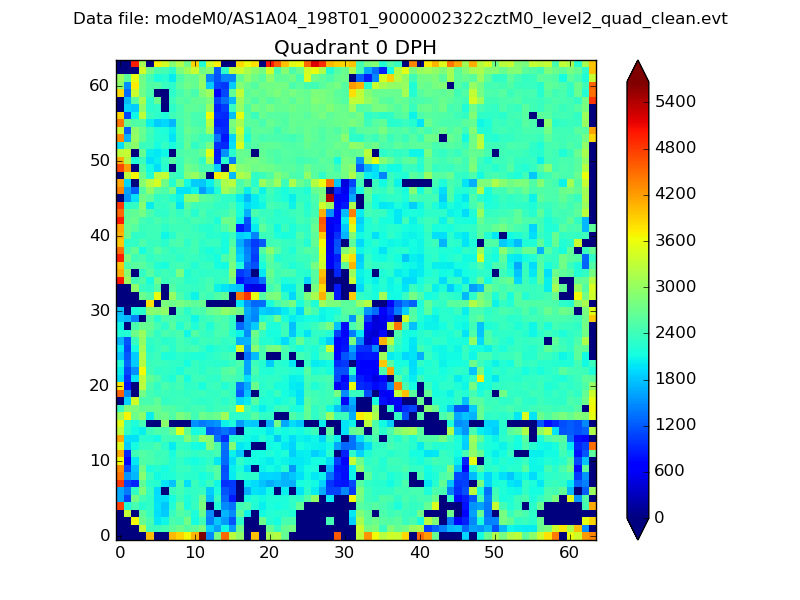 |
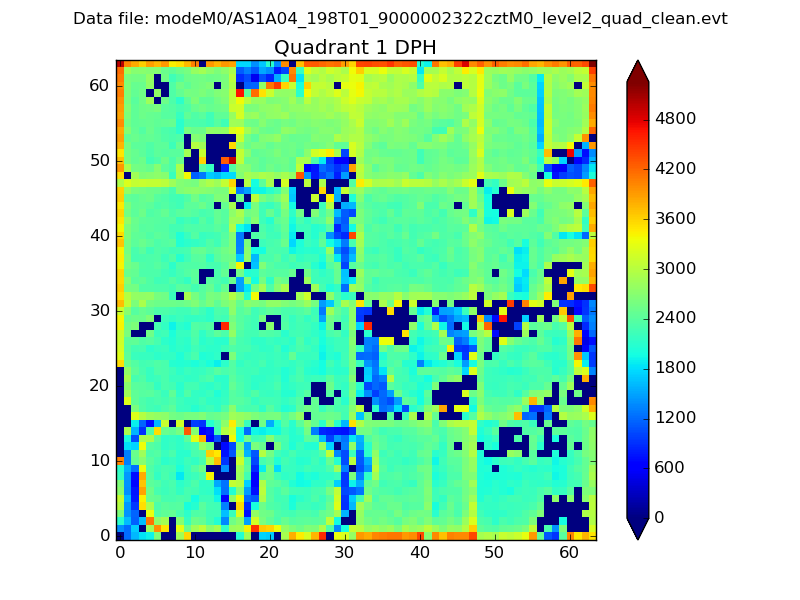 |
Quadrant B |
|---|---|---|---|
| Quadrant D | 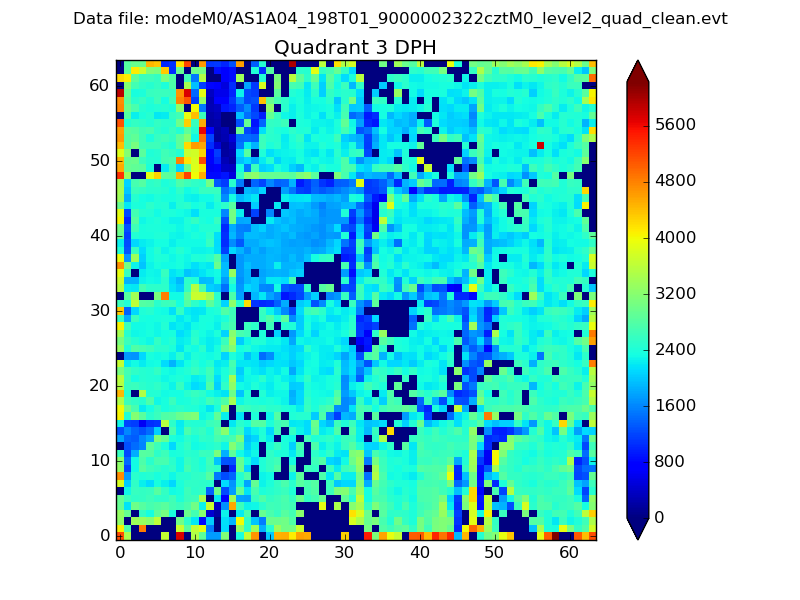 |
 |
Quadrant C |
| Plot type | Count rate plots | Images |
|---|---|---|
| Comparison with Poisson distribution Blue bars denote a histogram of data divided into 1 sec bins. Red curve is a Poisson curve with rate = median count rate of data. |
 |
 |
| Quadrant-wise count rates Data is divided into 100 sec bins |
 |
|
| Module-wise count rates for Quadrant A Data is divided into 100 sec bins |
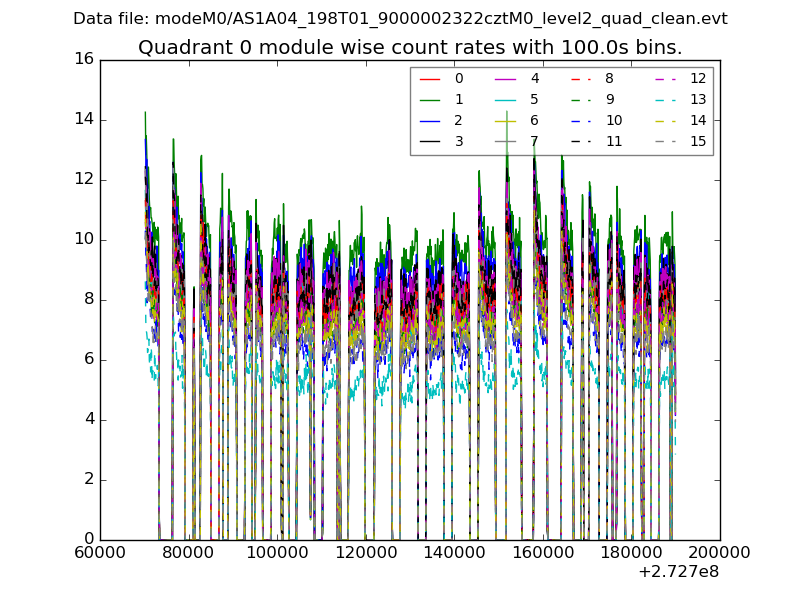 |
 |
| Module-wise count rates for Quadrant B Data is divided into 100 sec bins |
 |
 |
| Module-wise count rates for Quadrant C Data is divided into 100 sec bins |
 |
 |
| Module-wise count rates for Quadrant D Data is divided into 100 sec bins |
 |
 |
| Parameter | Plot |
|---|---|
| CZT HV Monitor | 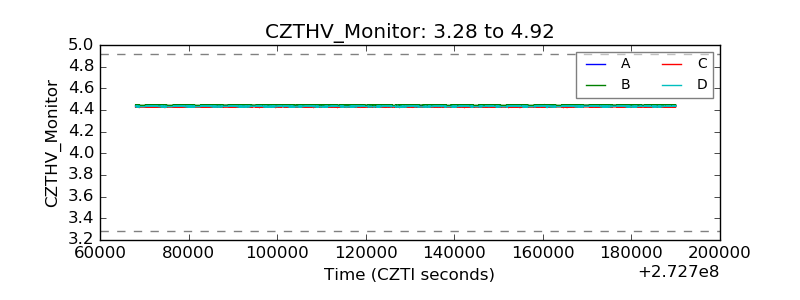 |
| D_VDD |  |
| Temperature 1 |  |
| Veto HV Monitor |  |
| Veto LLD | 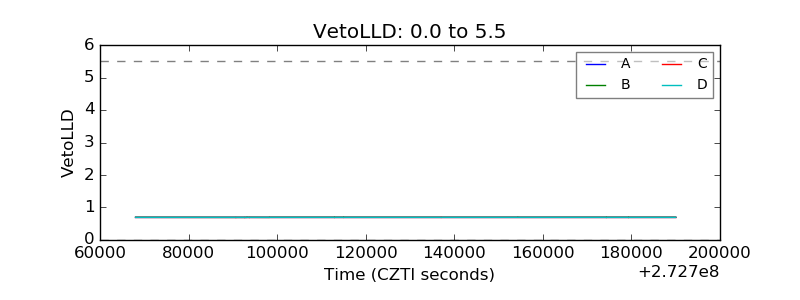 |
| Alpha Counter |  |
| _CPM_Rate | 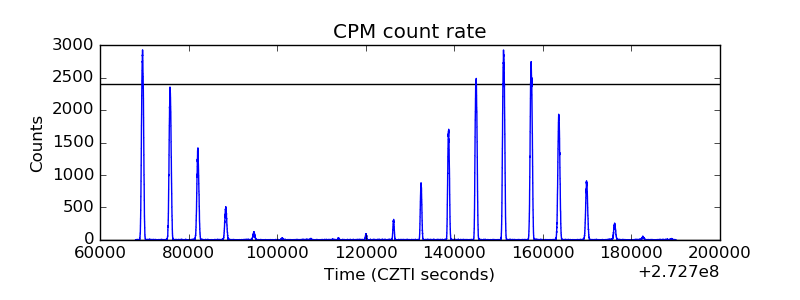 |
| CZT Counter |  |
| +2.5 Volts monitor |  |
| +5 Volts monitor |  |
| _ROLL_ROT |  |
| _Roll_DEC |  |
| _Roll_RA |  |
| Veto Counter | 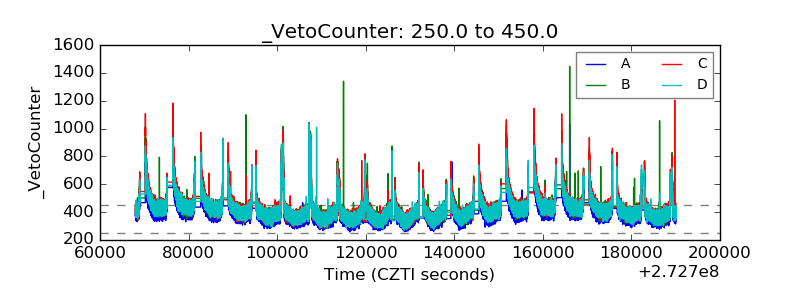 |