| Param | Original file | Final file |
|---|---|---|
| Filename | modeM0/AS1A04_198T01_9000002322_15703cztM0_level2.evt | modeM0/AS1A04_198T01_9000002322_15703cztM0_level2_quad_clean.evt |
| Size (bytes) | 191,041,920 | 31,582,080 |
| Size | 182.2 MB | 30.1 MB |
| Events in quadrant A | 1,176,339 | 197,317 |
| Events in quadrant B | 1,186,087 | 206,527 |
| Events in quadrant C | 1,224,725 | 200,969 |
| Events in quadrant D | 2,047,400 | 192,447 |
| Mode M0 | |||
|---|---|---|---|
| Quadrant | BADHDUFLAG | Total packets | Discarded packets |
| A | 0 | 4787 | 2 |
| B | 0 | 4816 | 1 |
| C | 0 | 4996 | 1 |
| D | 0 | 7507 | 1 |
| Mode SS | |||
|---|---|---|---|
| Quadrant | BADHDUFLAG | Total packets | Discarded packets |
| A | 0 | 46 | 0 |
| B | 0 | 46 | 0 |
| C | 0 | 46 | 0 |
| D | 0 | 46 | 0 |
| Mode M9 | |||
|---|---|---|---|
| Quadrant | BADHDUFLAG | Total packets | Discarded packets |
| A | 0 | 13 | 0 |
| B | 0 | 13 | 0 |
| C | 0 | 13 | 0 |
| D | 0 | 13 | 0 |
| Quadrant | Total seconds | Saturated seconds | Saturation percentage |
|---|---|---|---|
| A | 2194 | 18 | 0.820419% |
| B | 2194 | 24 | 1.093892% |
| C | 2194 | 33 | 1.504102% |
| D | 2194 | 316 | 14.402917% |
Noise dominated data is calculated using 1-second bins in cleaned event files. If a bin has >2000 counts, and if more than 50% of those come from <1% of pixels, then it is considered to be noise-dominated and hence unusable.
| Quadrant | # 1 sec bins | Bins with >0 counts | Bins with >2000 counts | High rate bins dominated by noise | Noise dominated (total time) | Noise dominated (detector-on time) | Marked lightcurve |
|---|---|---|---|---|---|---|---|
| A | 3470 | 2196 | 2 | 2 | 0.06% | 0.09% | 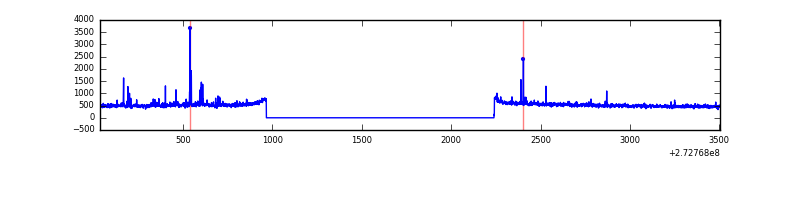 |
| B | 3470 | 2196 | 0 | 0 | 0.00% | 0.00% |  |
| C | 3470 | 2196 | 0 | 0 | 0.00% | 0.00% | 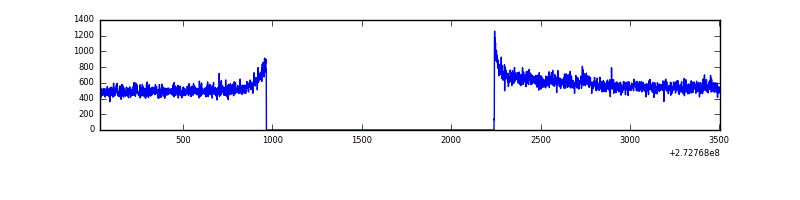 |
| D | 3470 | 2196 | 252 | 252 | 7.26% | 11.48% | 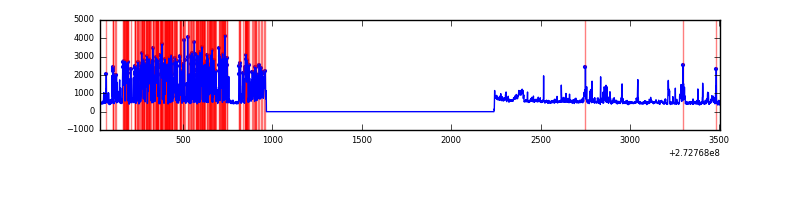 |
Top three noisy pixels from each quadrant. If the there are fewer than three noisy pixels in the level2.evt file, extra rows are filled as -1
| Pixel properties | Quadrant properties | ||||||
|---|---|---|---|---|---|---|---|
| Quadrant | DetID | PixID | Counts | Sigma | Mean | Median | Sigma |
| A | 9 | 143 | 46821 | 772.39 | 293 | 286 | 60.2 |
| A | 0 | 226 | 2569 | 37.89 | 293 | 286 | 60.2 |
| A | 12 | 194 | 2153 | 30.99 | 293 | 286 | 60.2 |
| B | 5 | 236 | 10313 | 173.1 | 297 | 290 | 57.9 |
| B | 12 | 111 | 6483 | 106.96 | 297 | 290 | 57.9 |
| B | 11 | 111 | 5509 | 90.14 | 297 | 290 | 57.9 |
| C | 3 | 233 | 50598 | 728.87 | 289 | 292 | 69.0 |
| C | 14 | 238 | 44870 | 645.87 | 289 | 292 | 69.0 |
| C | 13 | 61 | 2043 | 25.37 | 289 | 292 | 69.0 |
| D | 1 | 52 | 981089 | 14346.56 | 274 | 265 | 68.4 |
| D | 7 | 223 | 21435 | 309.65 | 274 | 265 | 68.4 |
| D | 2 | 234 | 7313 | 103.09 | 274 | 265 | 68.4 |
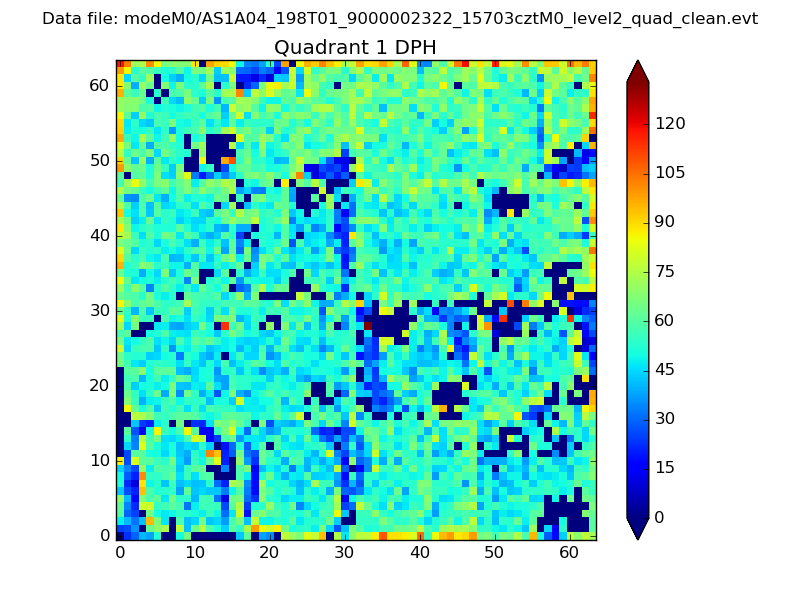
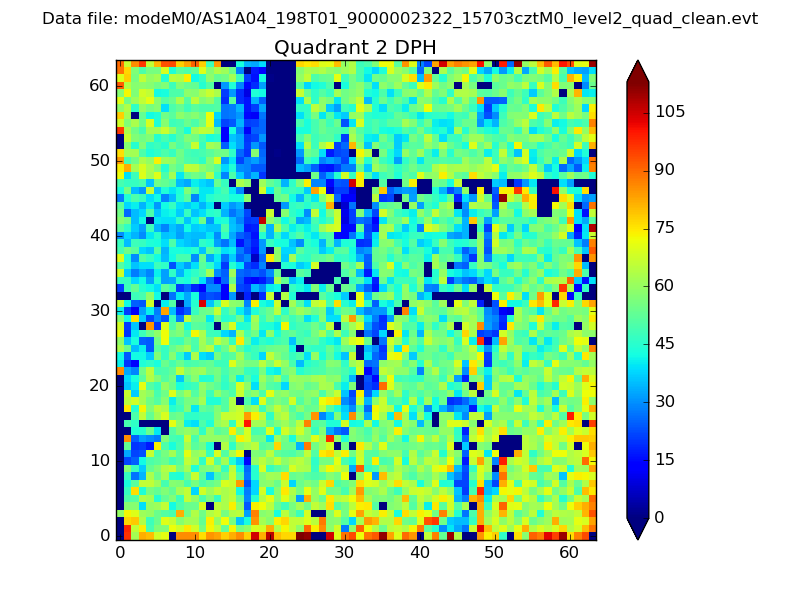
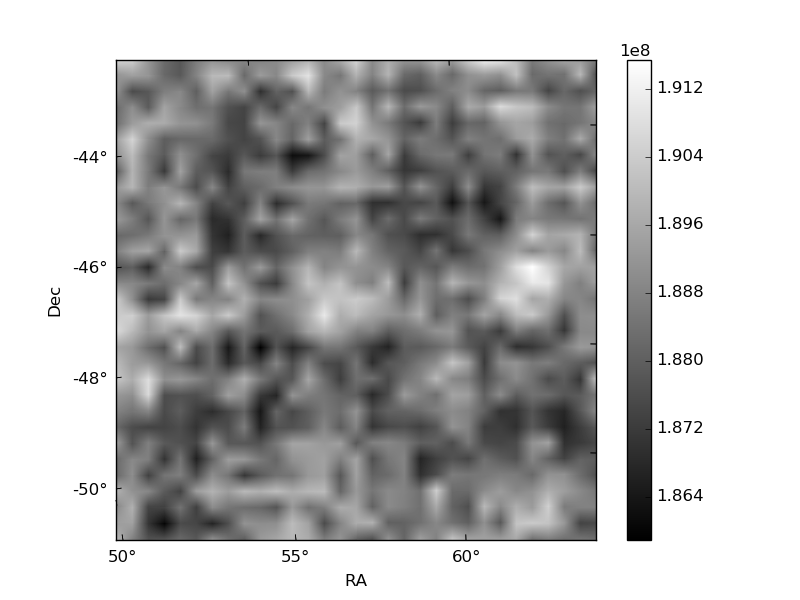
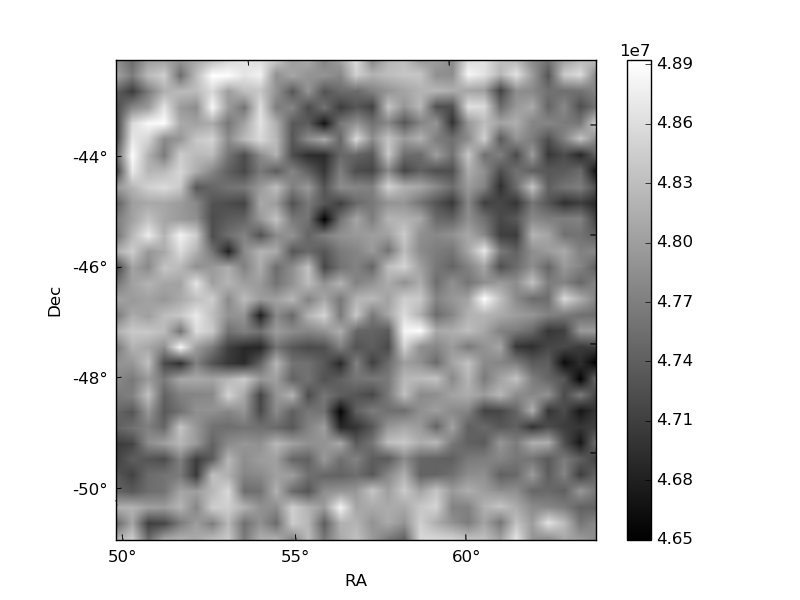
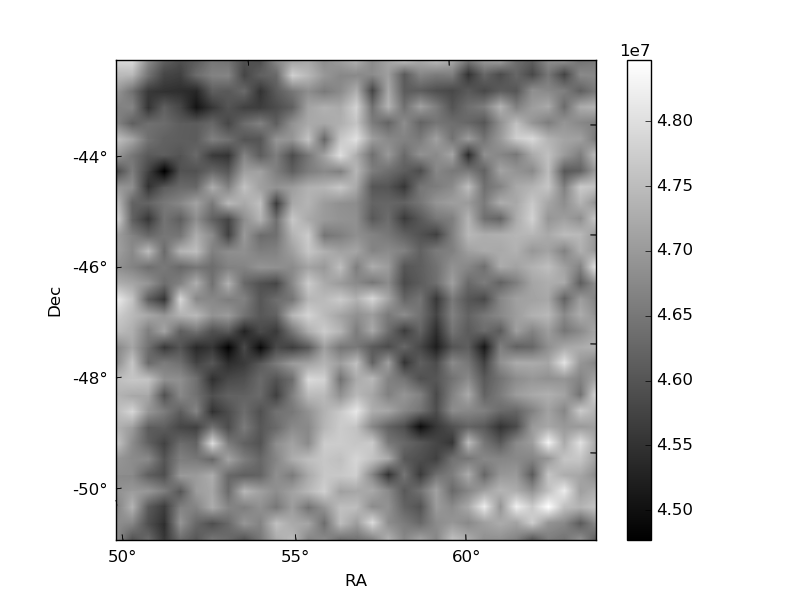
Histogram calculated using DETX and DETY for each event in the final _common_clean file
| Quadrant A | 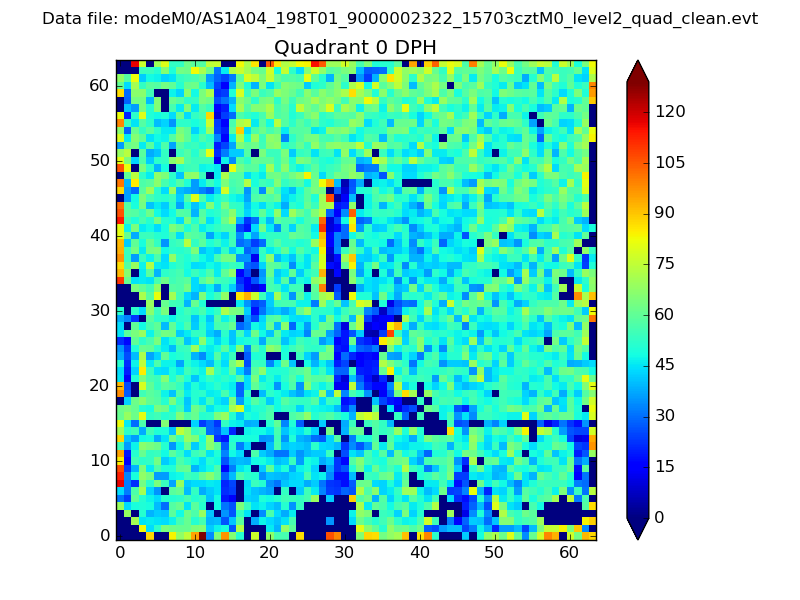 |
 |
Quadrant B |
|---|---|---|---|
| Quadrant D | 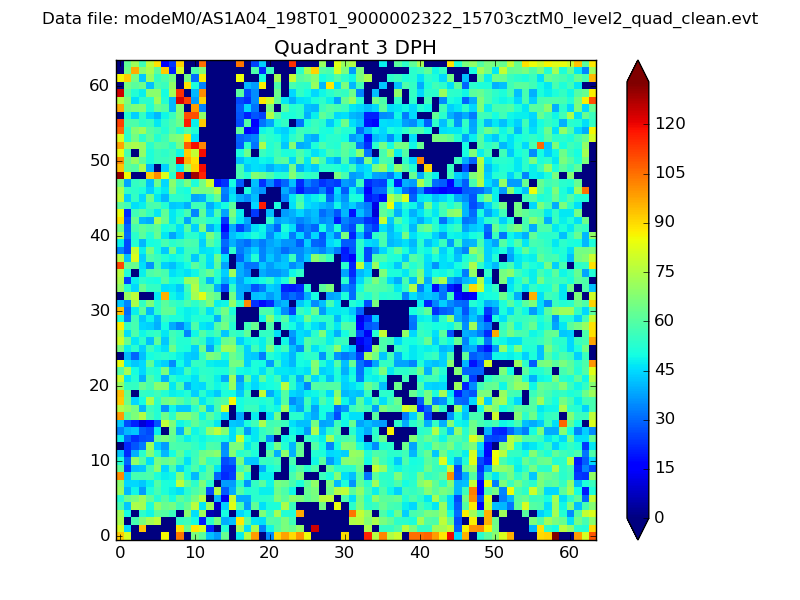 |
 |
Quadrant C |
| Plot type | Count rate plots | Images |
|---|---|---|
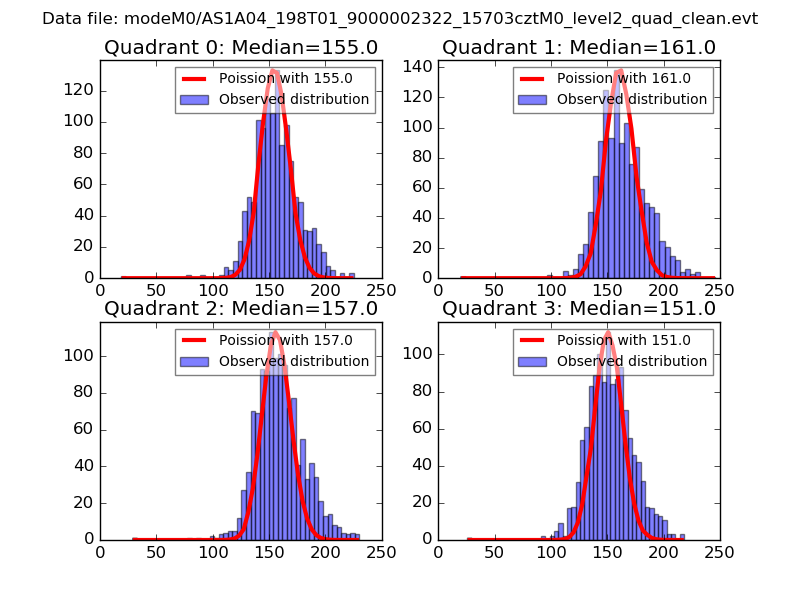
| Comparison with Poisson distribution Blue bars denote a histogram of data divided into 1 sec bins. Red curve is a Poisson curve with rate = median count rate of data. |
 |
 |
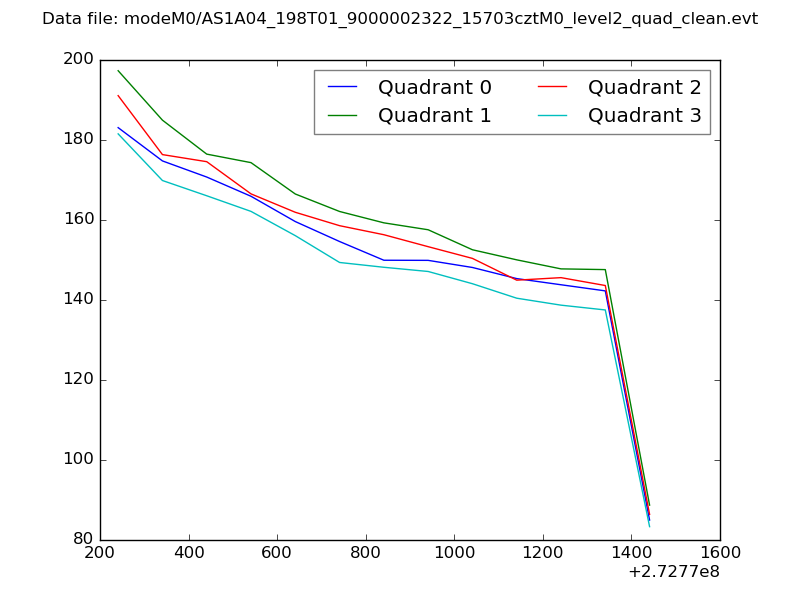
| Quadrant-wise count rates Data is divided into 100 sec bins |
 |
|
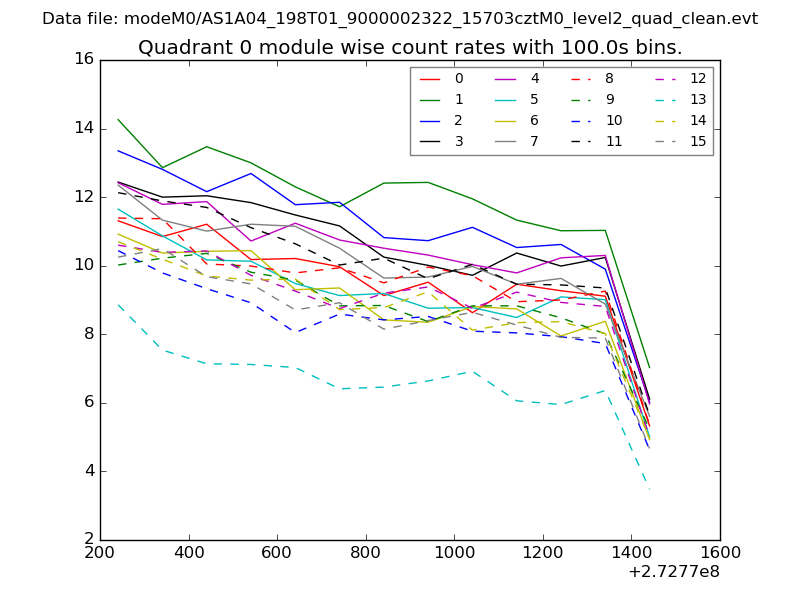
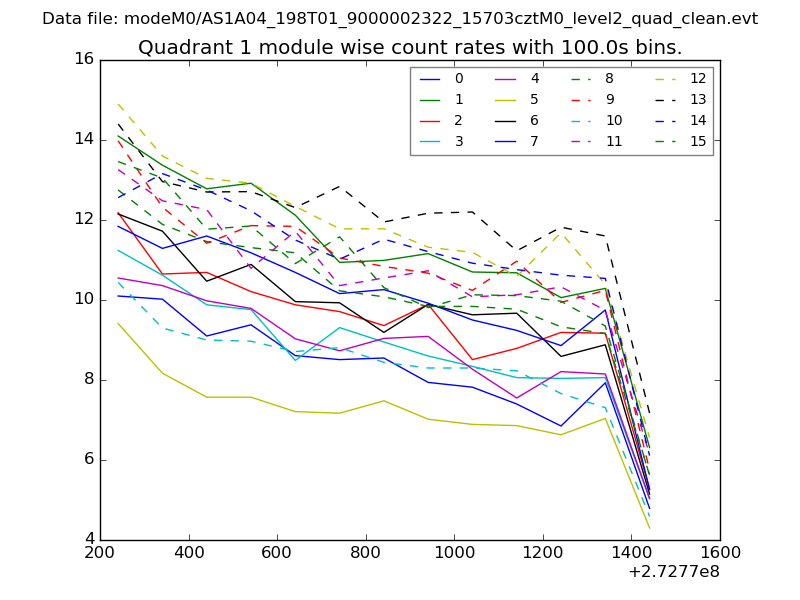
| Module-wise count rates for Quadrant A Data is divided into 100 sec bins |
 |
 |
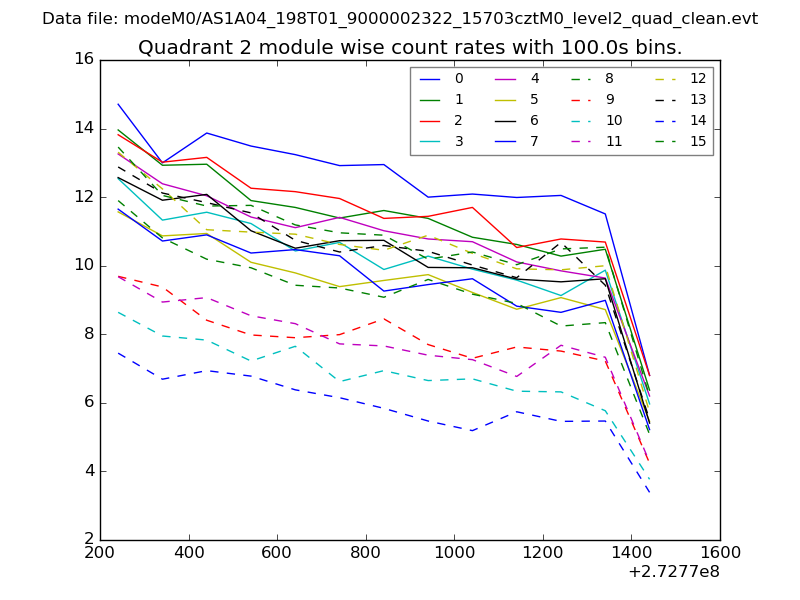
| Module-wise count rates for Quadrant B Data is divided into 100 sec bins |
 |
 |
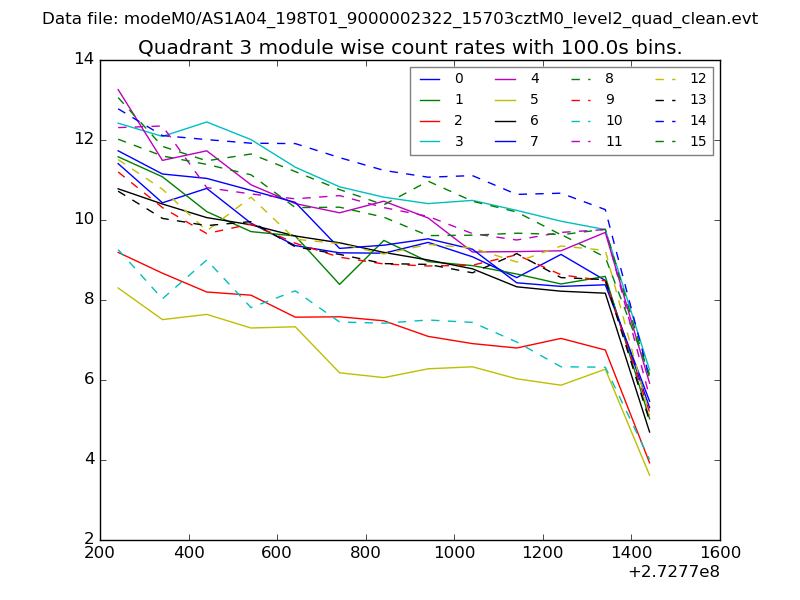
| Module-wise count rates for Quadrant C Data is divided into 100 sec bins |
 |
 |
| Module-wise count rates for Quadrant D Data is divided into 100 sec bins |
 |
 |
| Parameter | Plot |
|---|---|
| CZT HV Monitor | 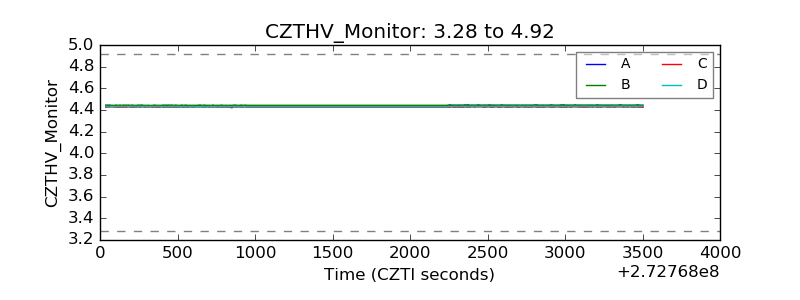 |
| D_VDD | 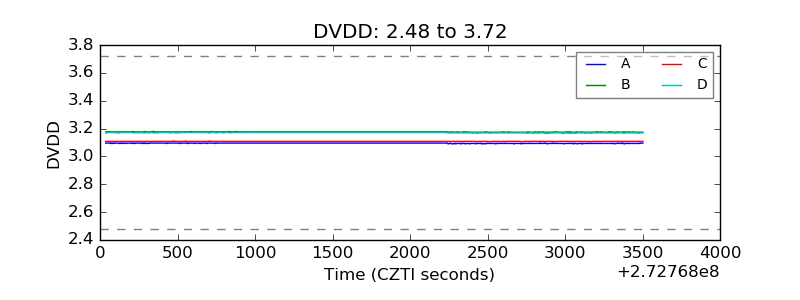 |
| Temperature 1 | 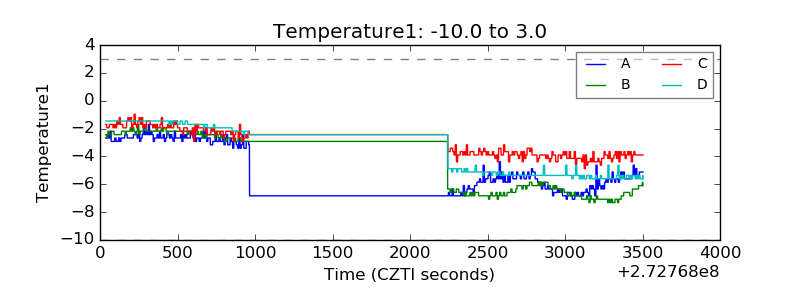 |
| Veto HV Monitor | 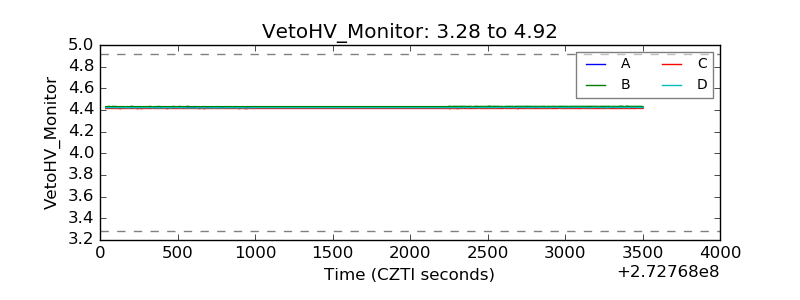 |
| Veto LLD | 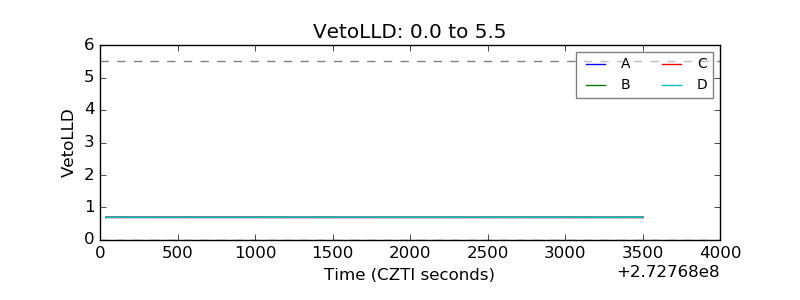 |
| Alpha Counter | 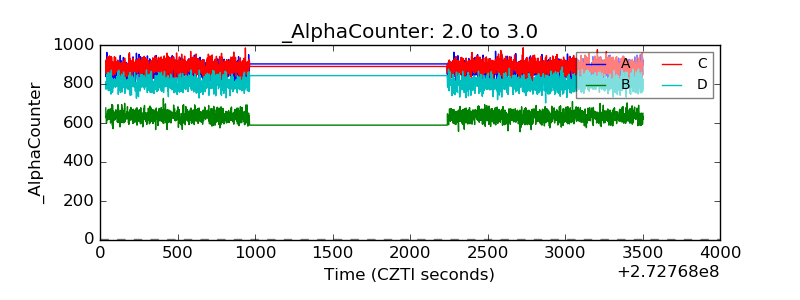 |
| _CPM_Rate | 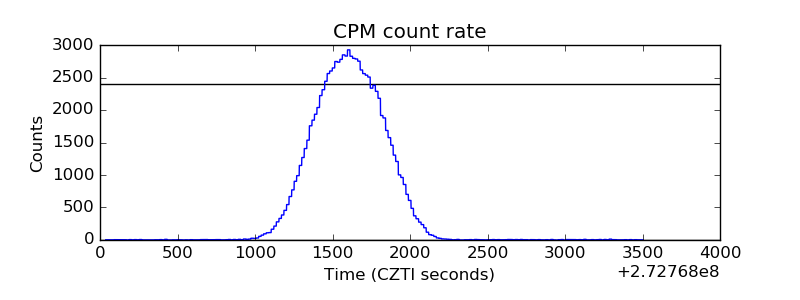 |
| CZT Counter | 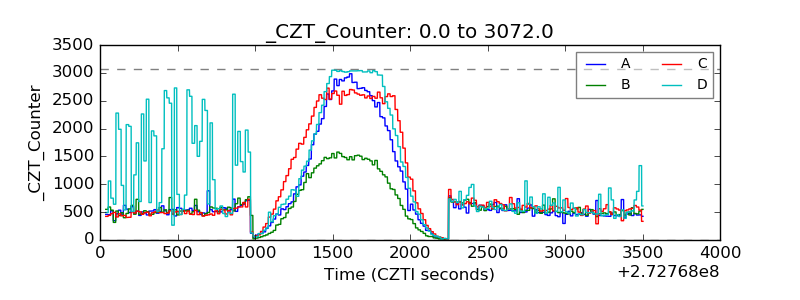 |
| +2.5 Volts monitor |  |
| +5 Volts monitor |  |
| _ROLL_ROT | 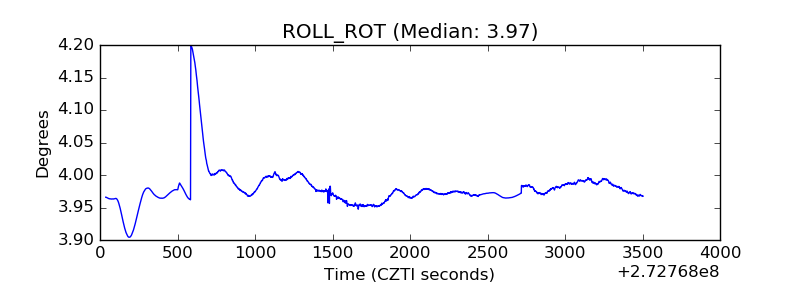 |
| _Roll_DEC |  |
| _Roll_RA | 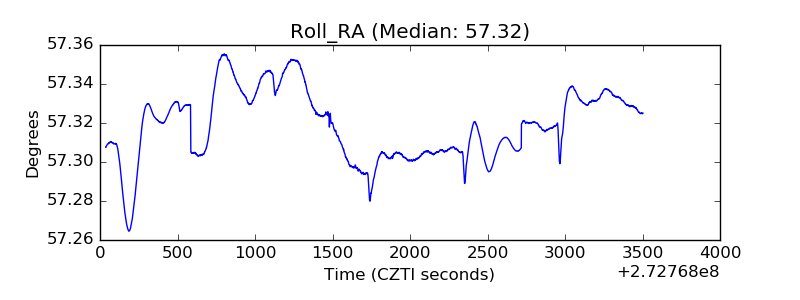 |
| Veto Counter | 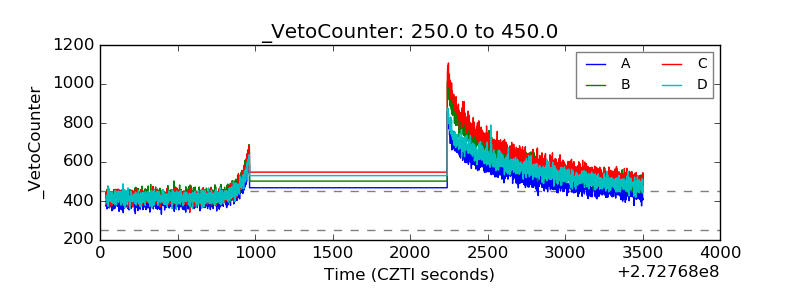 |