| Param | Original file | Final file |
|---|---|---|
| Filename | modeM0/AS1A04_198T01_9000002322_15705cztM0_level2.evt | modeM0/AS1A04_198T01_9000002322_15705cztM0_level2_quad_clean.evt |
| Size (bytes) | 473,333,760 | 98,510,400 |
| Size | 451.4 MB | 93.9 MB |
| Events in quadrant A | 4,256,281 | 625,021 |
| Events in quadrant B | 3,229,816 | 656,230 |
| Events in quadrant C | 3,229,127 | 640,393 |
| Events in quadrant D | 3,191,231 | 621,566 |
| Mode M0 | |||
|---|---|---|---|
| Quadrant | BADHDUFLAG | Total packets | Discarded packets |
| A | 0 | 16657 | 3 |
| B | 0 | 13406 | 2 |
| C | 0 | 13297 | 2 |
| D | 0 | 13464 | 2 |
| Mode SS | |||
|---|---|---|---|
| Quadrant | BADHDUFLAG | Total packets | Discarded packets |
| A | 0 | 130 | 0 |
| B | 0 | 130 | 0 |
| C | 0 | 130 | 0 |
| D | 0 | 130 | 0 |
| Mode M9 | |||
|---|---|---|---|
| Quadrant | BADHDUFLAG | Total packets | Discarded packets |
| A | 0 | 20 | 0 |
| B | 0 | 20 | 0 |
| C | 0 | 20 | 0 |
| D | 0 | 21 | 0 |
| Quadrant | Total seconds | Saturated seconds | Saturation percentage |
|---|---|---|---|
| A | 6300 | 524 | 8.317460% |
| B | 6300 | 48 | 0.761905% |
| C | 6300 | 72 | 1.142857% |
| D | 6300 | 20 | 0.317460% |
Noise dominated data is calculated using 1-second bins in cleaned event files. If a bin has >2000 counts, and if more than 50% of those come from <1% of pixels, then it is considered to be noise-dominated and hence unusable.
| Quadrant | # 1 sec bins | Bins with >0 counts | Bins with >2000 counts | High rate bins dominated by noise | Noise dominated (total time) | Noise dominated (detector-on time) | Marked lightcurve |
|---|---|---|---|---|---|---|---|
| A | 7641 | 6302 | 342 | 342 | 4.48% | 5.43% | 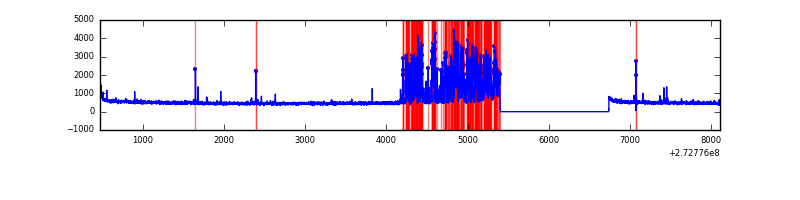 |
| B | 7641 | 6302 | 6 | 6 | 0.08% | 0.10% | 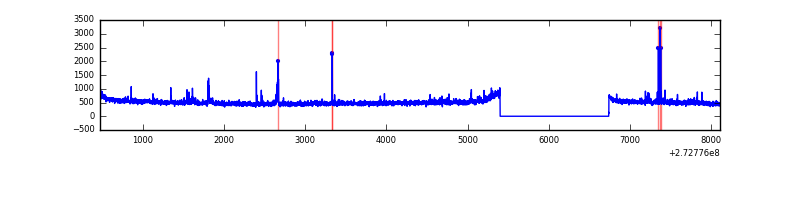 |
| C | 7641 | 6302 | 0 | 0 | 0.00% | 0.00% | 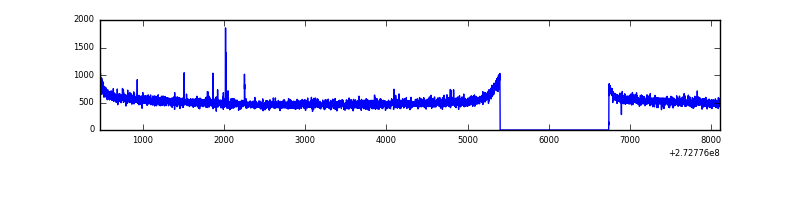 |
| D | 7641 | 6302 | 6 | 6 | 0.08% | 0.10% | 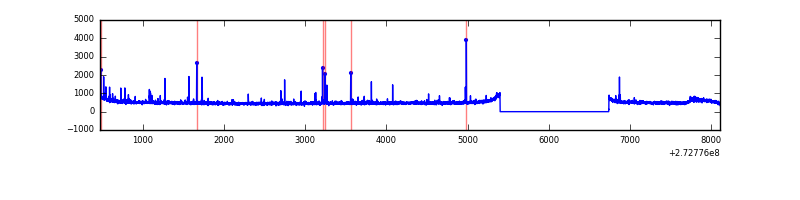 |
Top three noisy pixels from each quadrant. If the there are fewer than three noisy pixels in the level2.evt file, extra rows are filled as -1
| Pixel properties | Quadrant properties | ||||||
|---|---|---|---|---|---|---|---|
| Quadrant | DetID | PixID | Counts | Sigma | Mean | Median | Sigma |
| A | 13 | 248 | 1286901 | 8412.34 | 762 | 748 | 152.9 |
| A | 9 | 143 | 43199 | 277.66 | 762 | 748 | 152.9 |
| A | 0 | 226 | 6770 | 39.39 | 762 | 748 | 152.9 |
| B | 4 | 173 | 44840 | 296.79 | 799 | 780 | 148.5 |
| B | 5 | 236 | 27196 | 177.94 | 799 | 780 | 148.5 |
| B | 4 | 48 | 20330 | 131.69 | 799 | 780 | 148.5 |
| C | 14 | 238 | 122175 | 656.75 | 791 | 798 | 184.8 |
| C | 3 | 233 | 9571 | 47.47 | 791 | 798 | 184.8 |
| C | 9 | 54 | 8894 | 43.8 | 791 | 798 | 184.8 |
| D | 1 | 52 | 114895 | 591.13 | 796 | 774 | 193.1 |
| D | 9 | 68 | 57712 | 294.93 | 796 | 774 | 193.1 |
| D | 2 | 234 | 24106 | 120.86 | 796 | 774 | 193.1 |
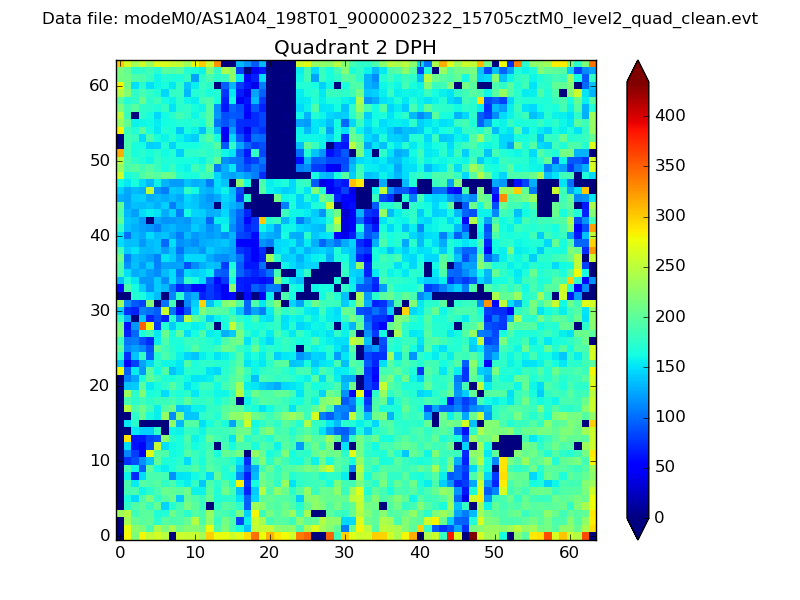
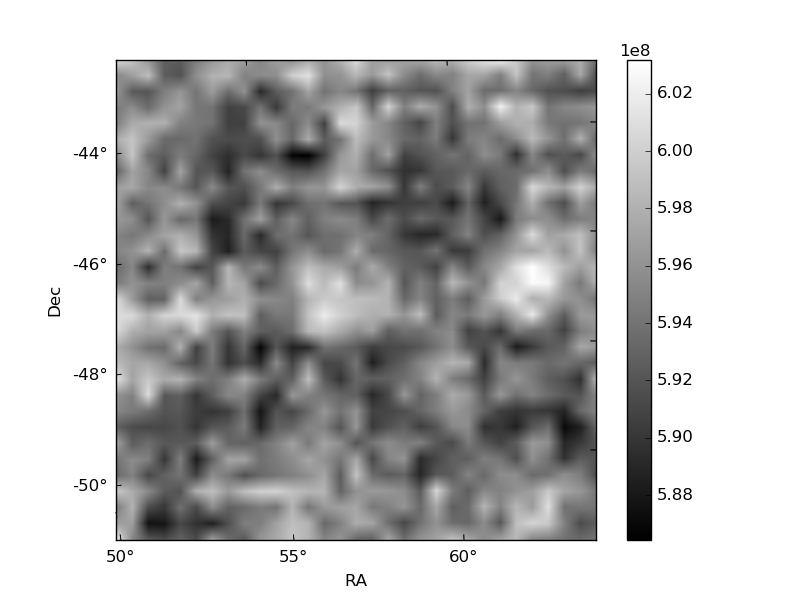
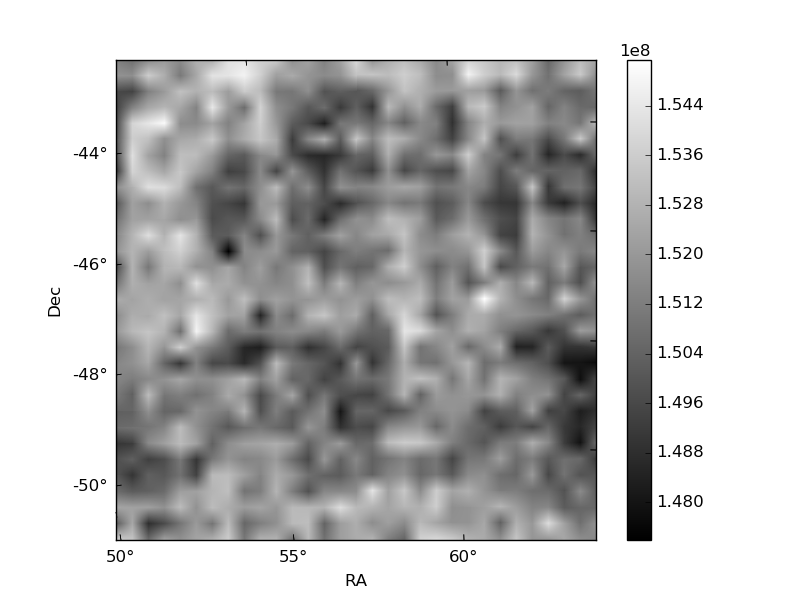
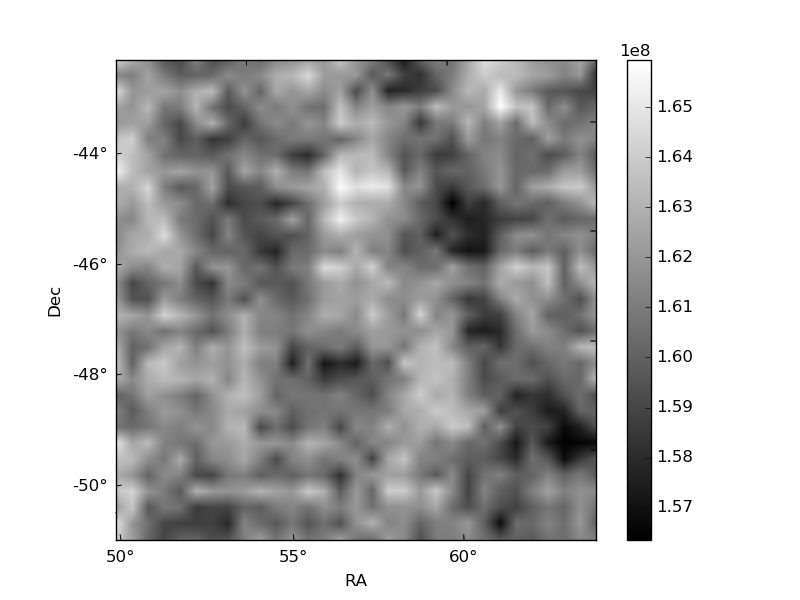
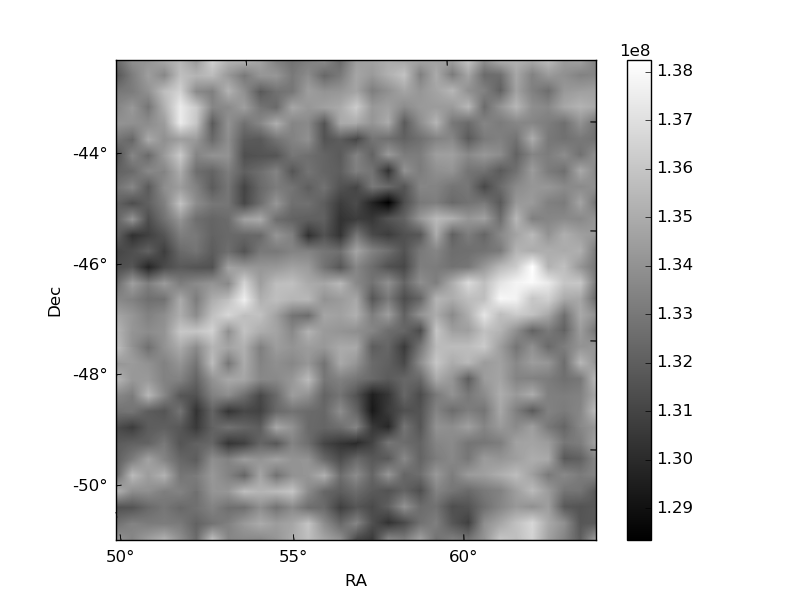
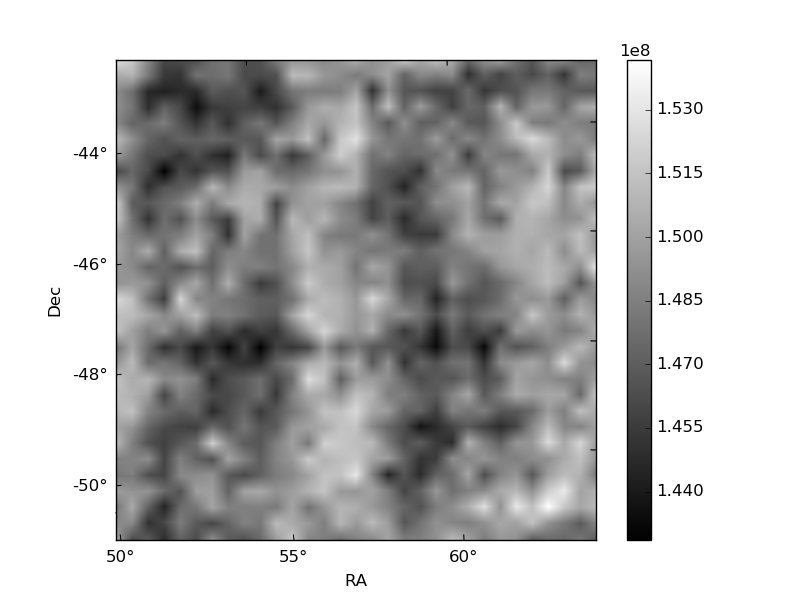
Histogram calculated using DETX and DETY for each event in the final _common_clean file
| Quadrant A | 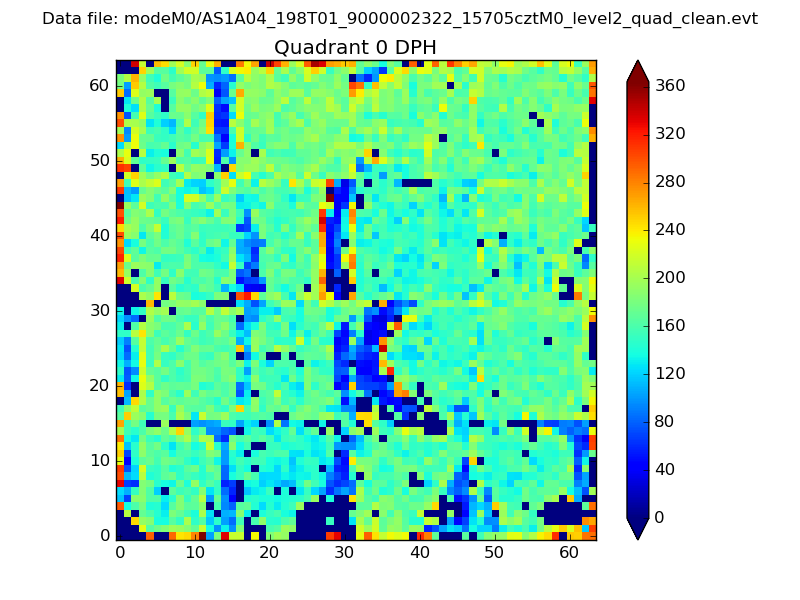 |
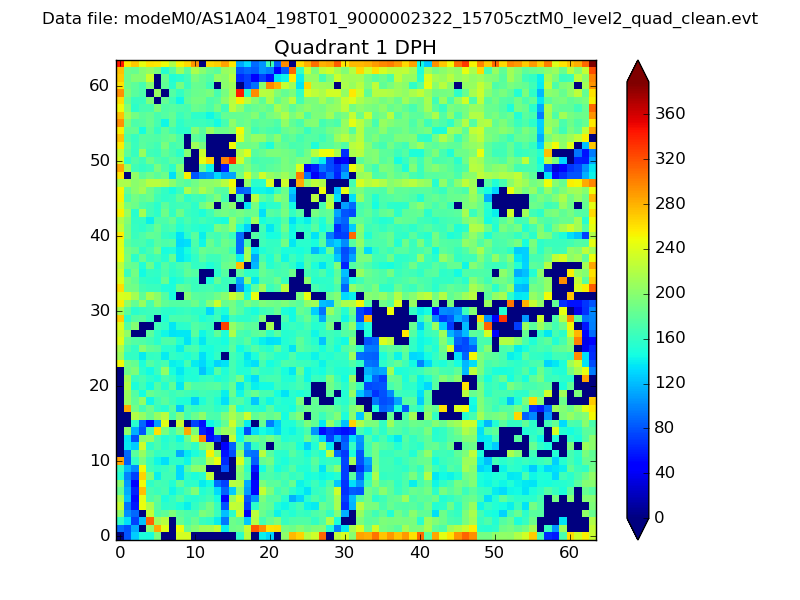 |
Quadrant B |
|---|---|---|---|
| Quadrant D | 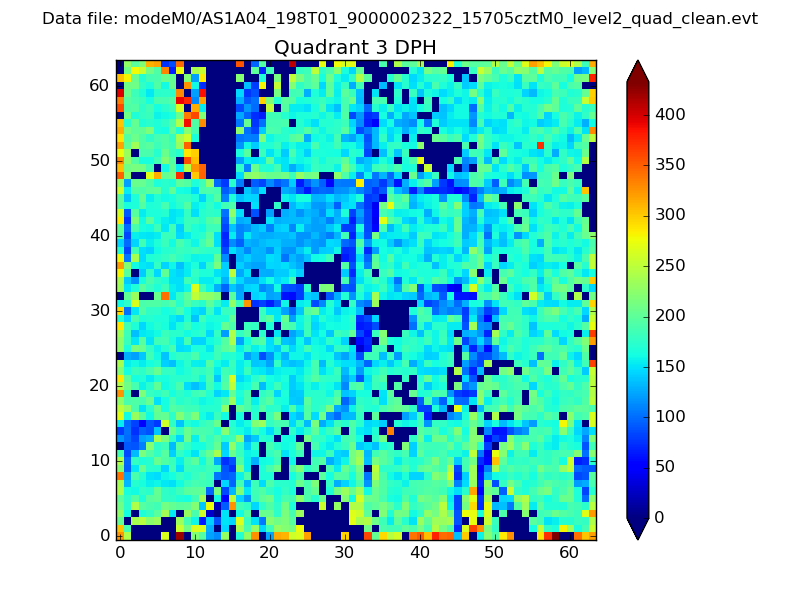 |
 |
Quadrant C |
| Plot type | Count rate plots | Images |
|---|---|---|
| Comparison with Poisson distribution Blue bars denote a histogram of data divided into 1 sec bins. Red curve is a Poisson curve with rate = median count rate of data. |
 |
 |
| Quadrant-wise count rates Data is divided into 100 sec bins |
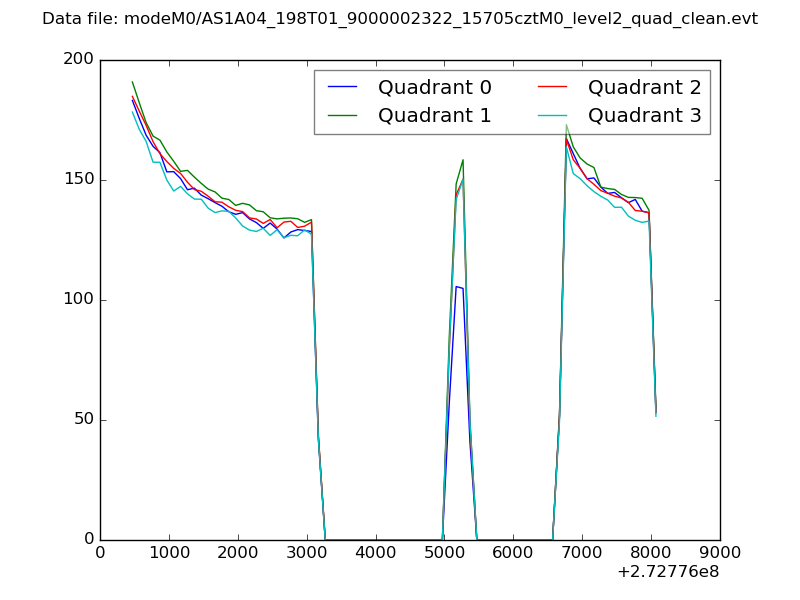 |
|
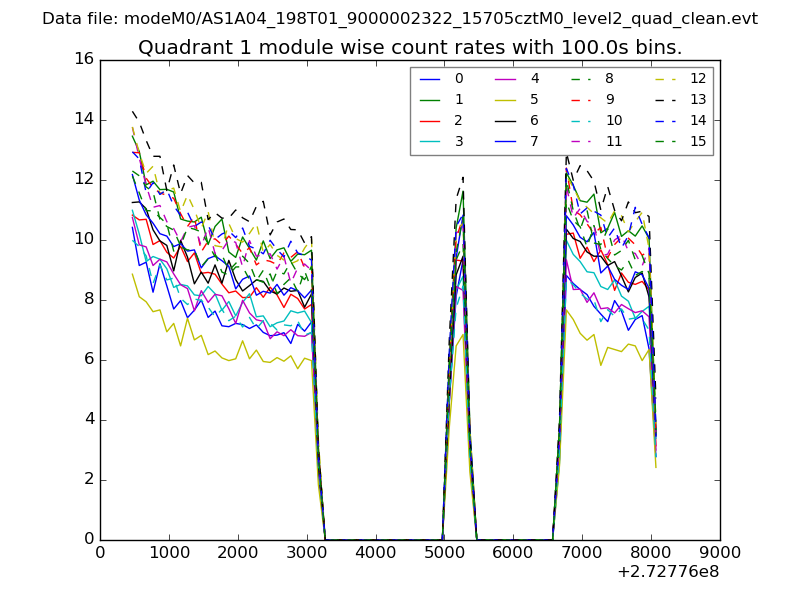
| Module-wise count rates for Quadrant A Data is divided into 100 sec bins |
 |
 |
| Module-wise count rates for Quadrant B Data is divided into 100 sec bins |
 |
 |
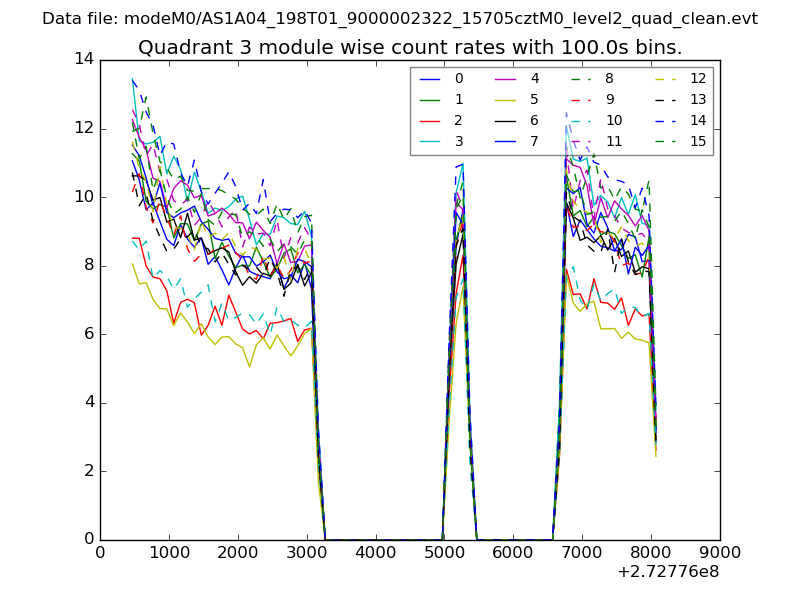
| Module-wise count rates for Quadrant C Data is divided into 100 sec bins |
 |
 |
| Module-wise count rates for Quadrant D Data is divided into 100 sec bins |
 |
 |
| Parameter | Plot |
|---|---|
| CZT HV Monitor | 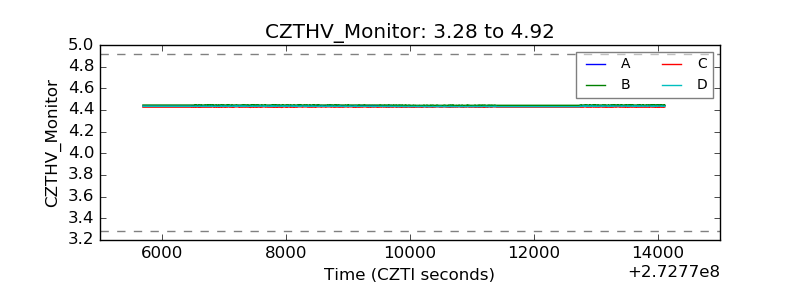 |
| D_VDD | 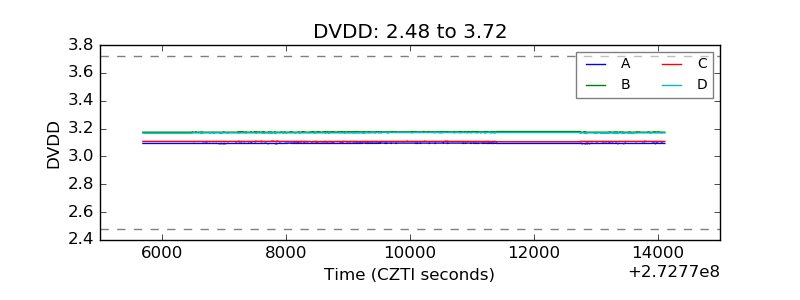 |
| Temperature 1 | 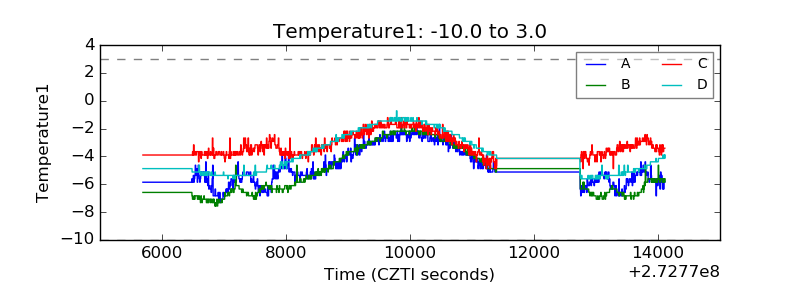 |
| Veto HV Monitor | 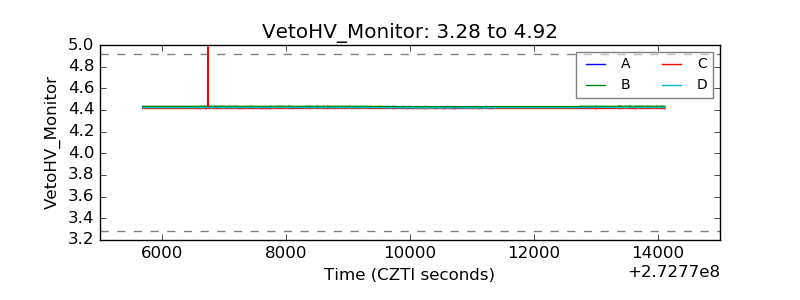 |
| Veto LLD | 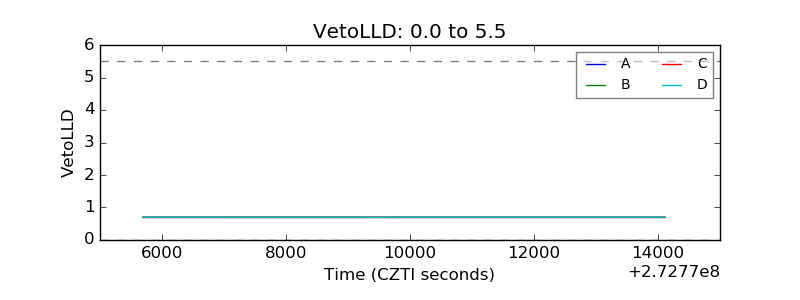 |
| Alpha Counter | 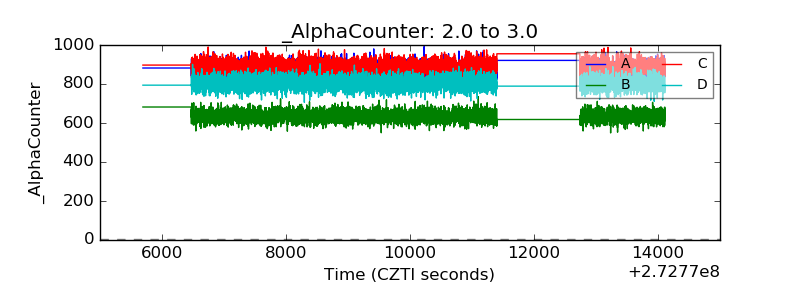 |
| _CPM_Rate | 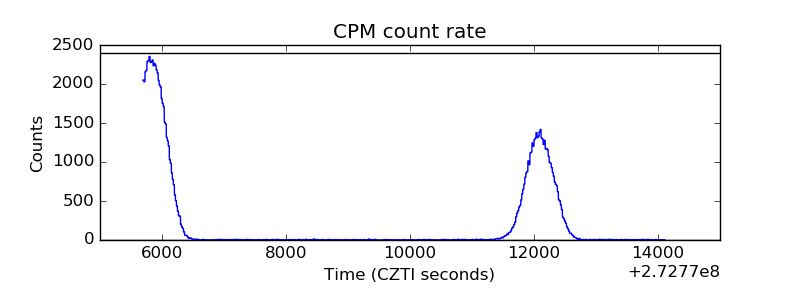 |
| CZT Counter | 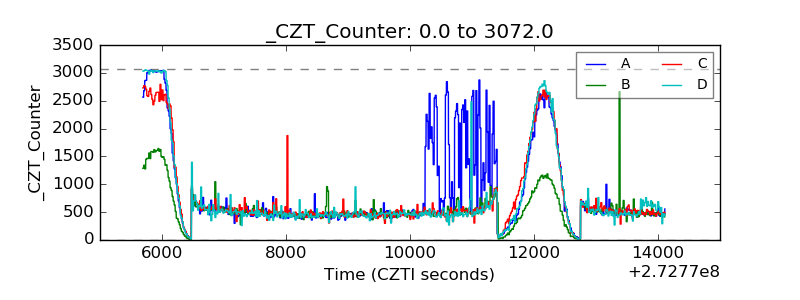 |
| +2.5 Volts monitor |  |
| +5 Volts monitor |  |
| _ROLL_ROT | 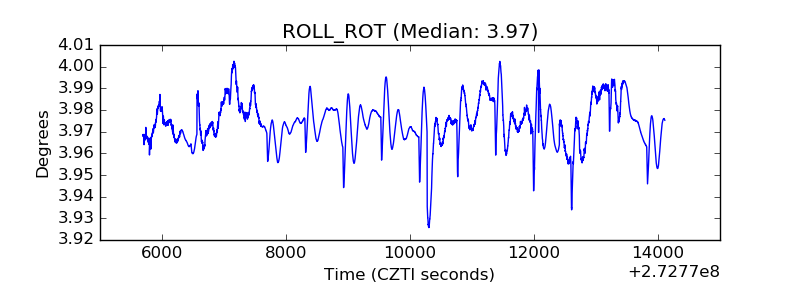 |
| _Roll_DEC | 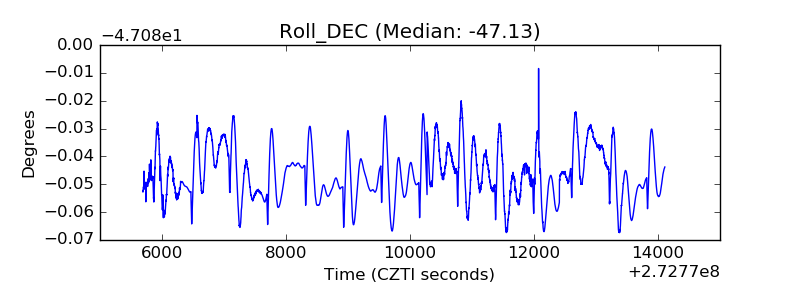 |
| _Roll_RA | 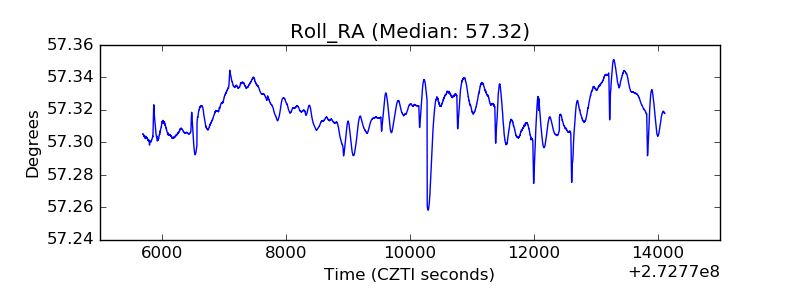 |
| Veto Counter | 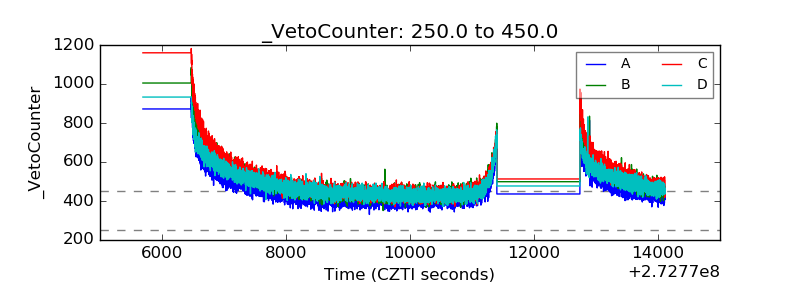 |