| Param | Original file | Final file |
|---|---|---|
| Filename | modeM0/AS1A04_198T01_9000002322_15709cztM0_level2.evt | modeM0/AS1A04_198T01_9000002322_15709cztM0_level2_quad_clean.evt |
| Size (bytes) | 556,937,280 | 100,615,680 |
| Size | 531.1 MB | 96.0 MB |
| Events in quadrant A | 3,963,332 | 623,142 |
| Events in quadrant B | 4,076,484 | 634,454 |
| Events in quadrant C | 4,070,308 | 623,533 |
| Events in quadrant D | 4,214,689 | 610,592 |
| Mode M0 | |||
|---|---|---|---|
| Quadrant | BADHDUFLAG | Total packets | Discarded packets |
| A | 0 | 17197 | 3 |
| B | 0 | 17211 | 2 |
| C | 0 | 16985 | 2 |
| D | 0 | 17949 | 2 |
| Mode SS | |||
|---|---|---|---|
| Quadrant | BADHDUFLAG | Total packets | Discarded packets |
| A | 0 | 162 | 0 |
| B | 0 | 162 | 0 |
| C | 0 | 162 | 0 |
| D | 0 | 162 | 0 |
| Mode M9 | |||
|---|---|---|---|
| Quadrant | BADHDUFLAG | Total packets | Discarded packets |
| A | 0 | 1 | 0 |
| B | 0 | 1 | 0 |
| C | 0 | 1 | 0 |
| D | 0 | 1 | 0 |
| Quadrant | Total seconds | Saturated seconds | Saturation percentage |
|---|---|---|---|
| A | 7978 | 417 | 5.226874% |
| B | 7978 | 415 | 5.201805% |
| C | 7978 | 412 | 5.164202% |
| D | 7978 | 409 | 5.126598% |
Noise dominated data is calculated using 1-second bins in cleaned event files. If a bin has >2000 counts, and if more than 50% of those come from <1% of pixels, then it is considered to be noise-dominated and hence unusable.
| Quadrant | # 1 sec bins | Bins with >0 counts | Bins with >2000 counts | High rate bins dominated by noise | Noise dominated (total time) | Noise dominated (detector-on time) | Marked lightcurve |
|---|---|---|---|---|---|---|---|
| A | 8064 | 7980 | 22 | 22 | 0.27% | 0.28% | 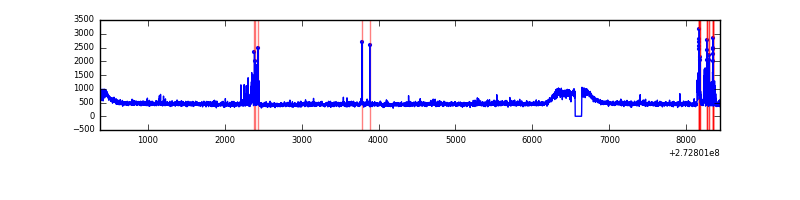 |
| B | 8064 | 7980 | 2 | 2 | 0.02% | 0.03% | 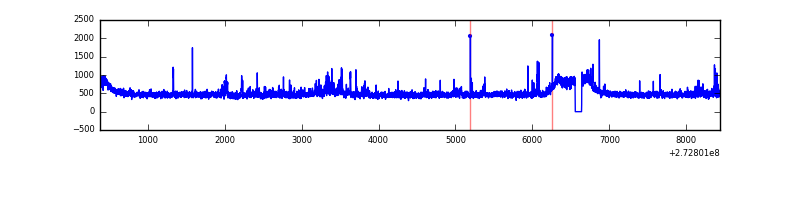 |
| C | 8064 | 7980 | 0 | 0 | 0.00% | 0.00% | 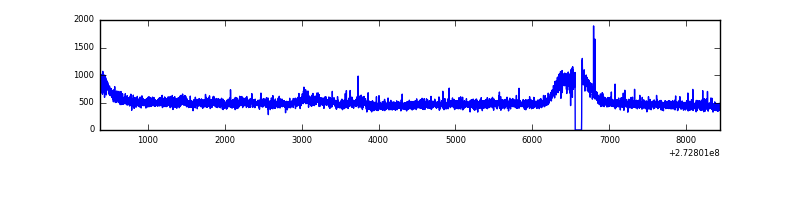 |
| D | 8064 | 7980 | 43 | 43 | 0.53% | 0.54% | 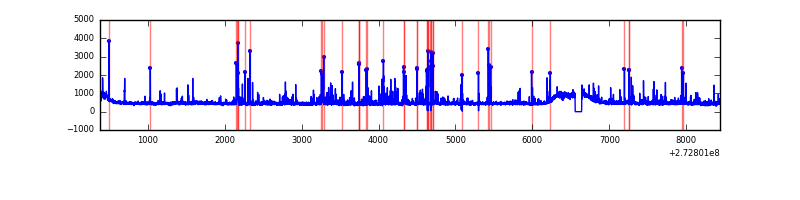 |
Top three noisy pixels from each quadrant. If the there are fewer than three noisy pixels in the level2.evt file, extra rows are filled as -1
| Pixel properties | Quadrant properties | ||||||
|---|---|---|---|---|---|---|---|
| Quadrant | DetID | PixID | Counts | Sigma | Mean | Median | Sigma |
| A | 13 | 248 | 176672 | 883.31 | 978 | 951 | 198.9 |
| A | 9 | 143 | 23080 | 111.24 | 978 | 951 | 198.9 |
| A | 0 | 226 | 8735 | 39.13 | 978 | 951 | 198.9 |
| B | 4 | 216 | 61845 | 322.37 | 971 | 945 | 188.9 |
| B | 10 | 245 | 53858 | 280.09 | 971 | 945 | 188.9 |
| B | 3 | 209 | 34740 | 178.89 | 971 | 945 | 188.9 |
| C | 3 | 233 | 218999 | 978.87 | 948 | 952 | 222.8 |
| C | 14 | 238 | 141758 | 632.12 | 948 | 952 | 222.8 |
| C | 10 | 22 | 10258 | 41.78 | 948 | 952 | 222.8 |
| D | 1 | 52 | 376761 | 1473.54 | 963 | 938 | 255.0 |
| D | 12 | 221 | 38788 | 148.4 | 963 | 938 | 255.0 |
| D | 12 | 110 | 34220 | 130.49 | 963 | 938 | 255.0 |
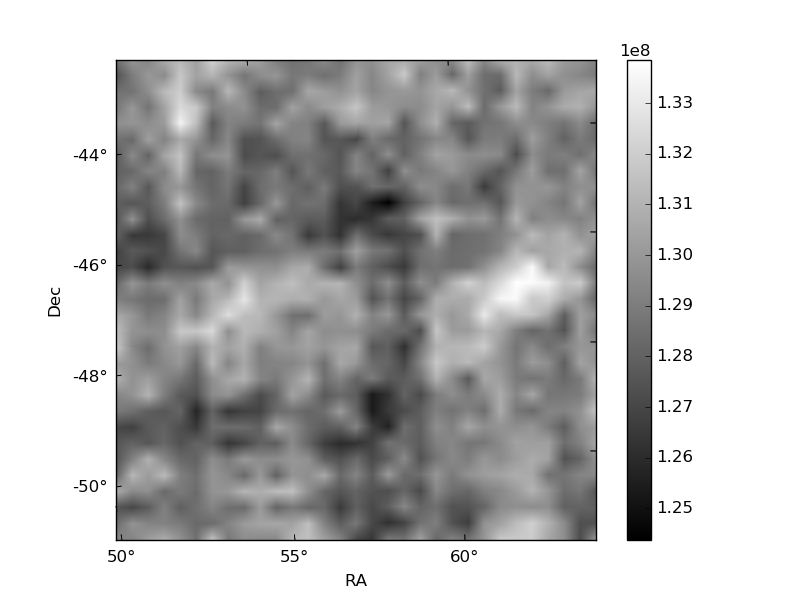
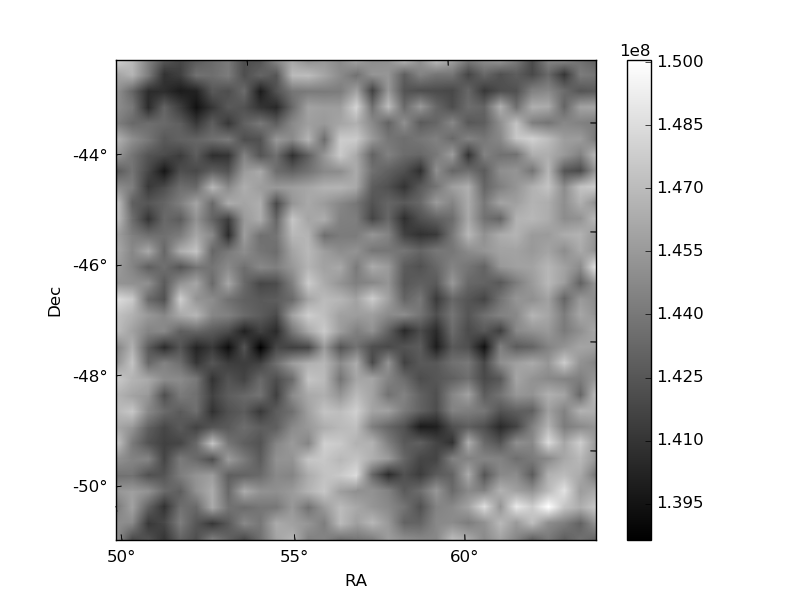
Histogram calculated using DETX and DETY for each event in the final _common_clean file
| Quadrant A | 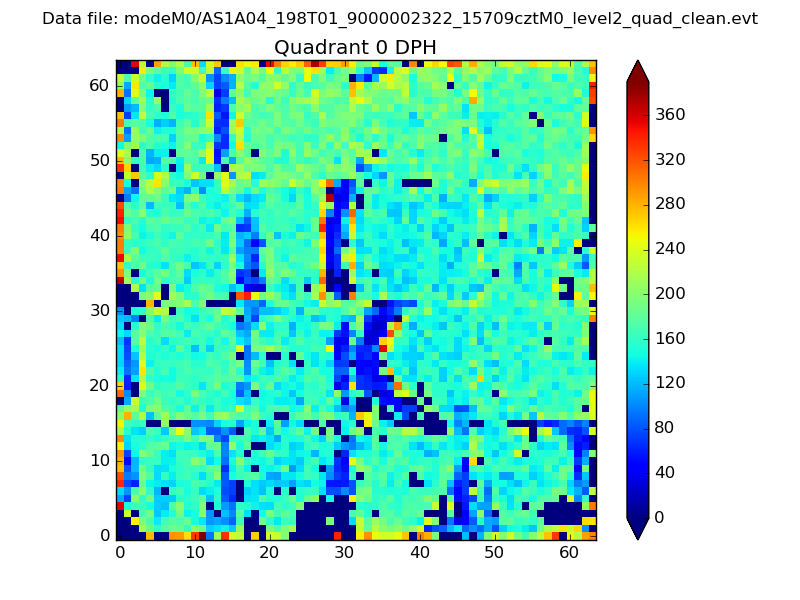 |
 |
Quadrant B |
|---|---|---|---|
| Quadrant D |  |
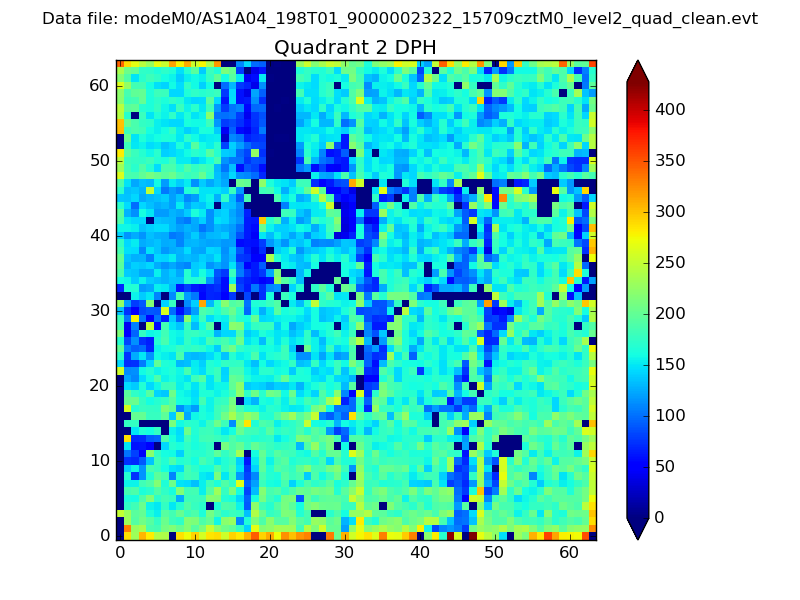 |
Quadrant C |
| Plot type | Count rate plots | Images |
|---|---|---|
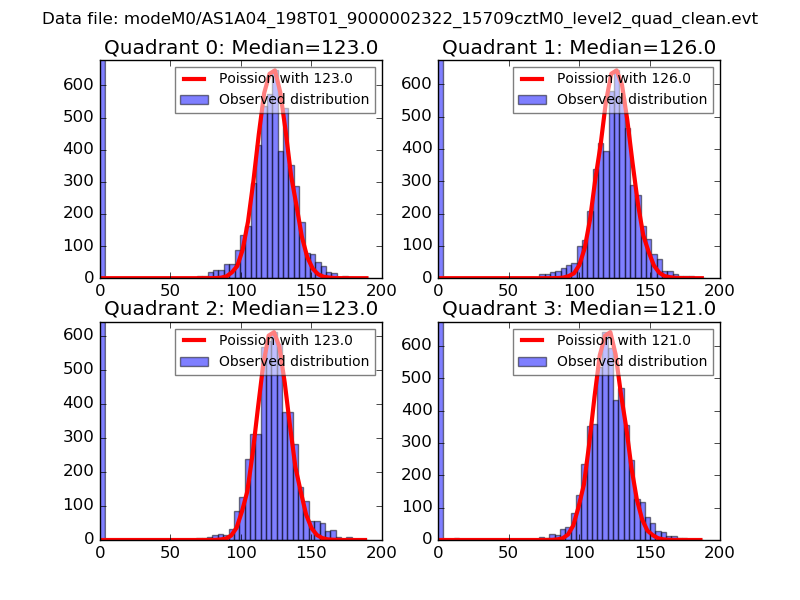
| Comparison with Poisson distribution Blue bars denote a histogram of data divided into 1 sec bins. Red curve is a Poisson curve with rate = median count rate of data. |
 |
 |
| Quadrant-wise count rates Data is divided into 100 sec bins |
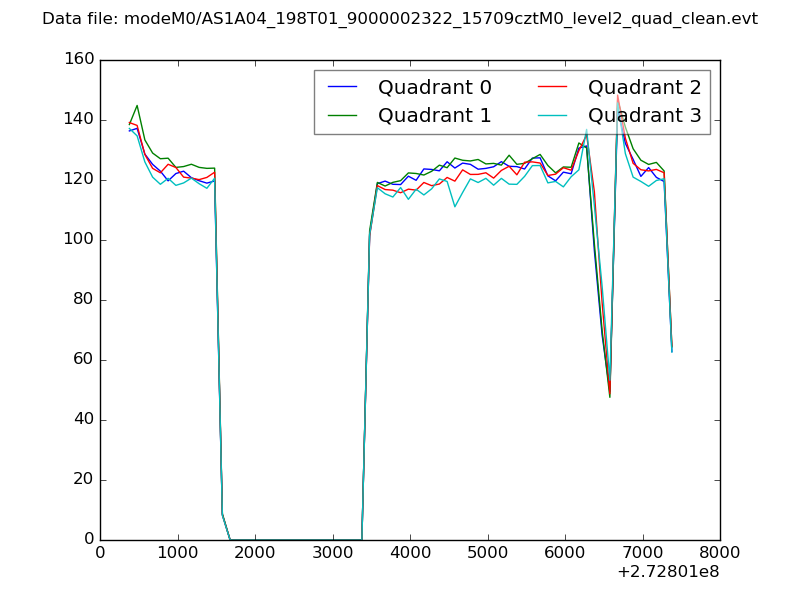 |
|
| Module-wise count rates for Quadrant A Data is divided into 100 sec bins |
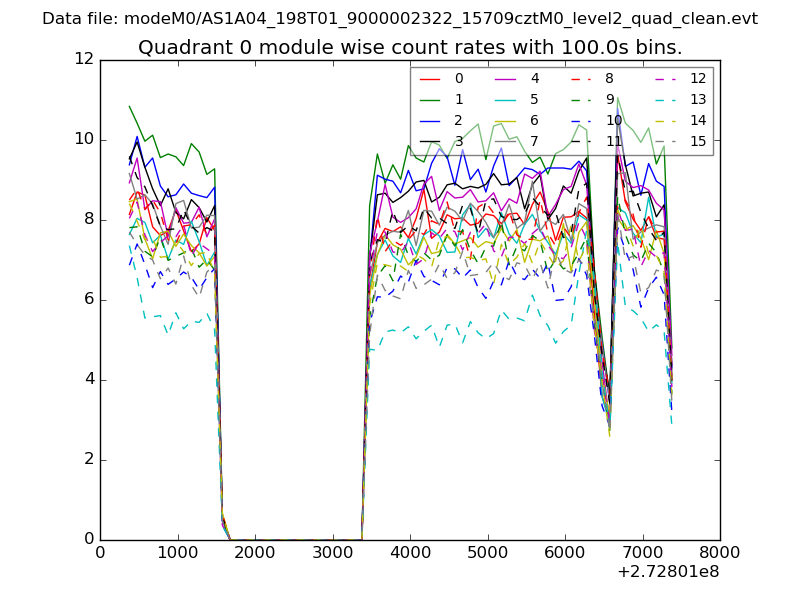 |
 |
| Module-wise count rates for Quadrant B Data is divided into 100 sec bins |
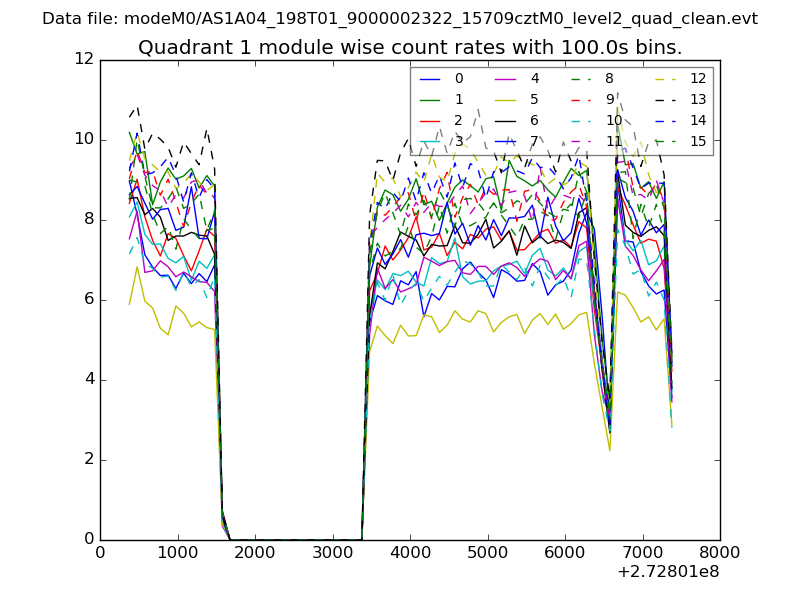 |
 |
| Module-wise count rates for Quadrant C Data is divided into 100 sec bins |
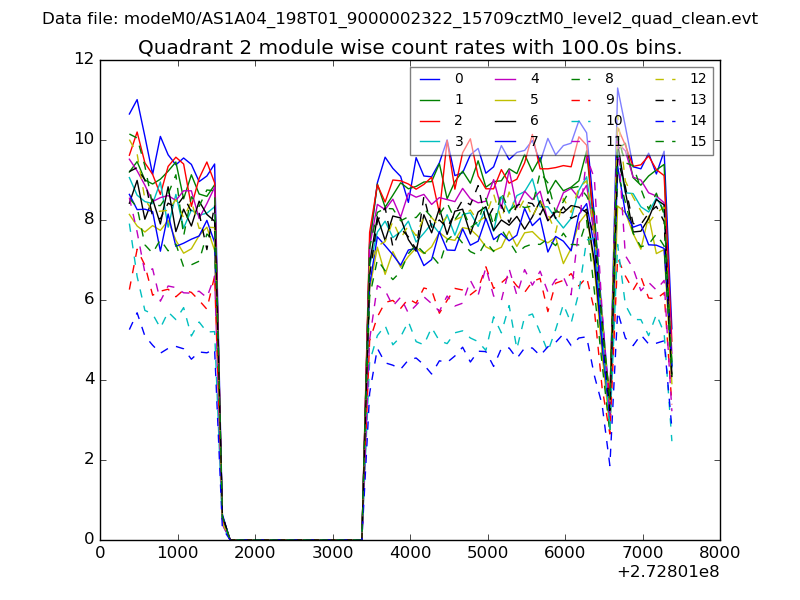 |
 |
| Module-wise count rates for Quadrant D Data is divided into 100 sec bins |
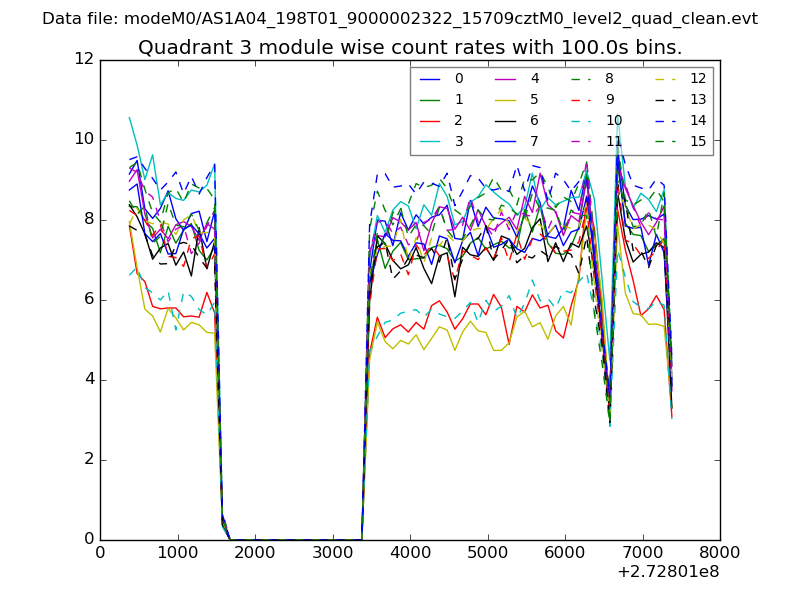 |
 |
| Parameter | Plot |
|---|---|
| CZT HV Monitor | 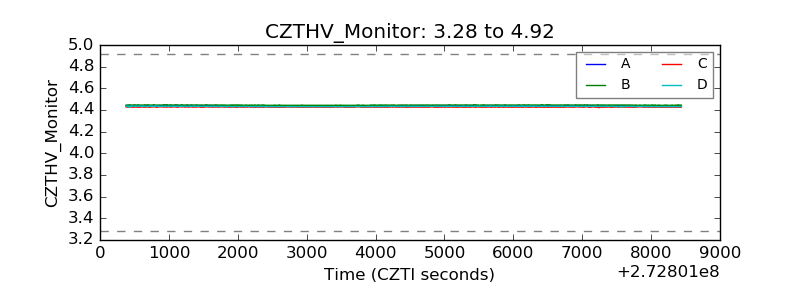 |
| D_VDD | 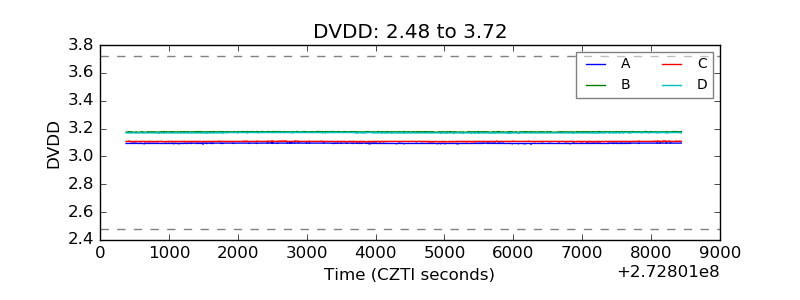 |
| Temperature 1 | 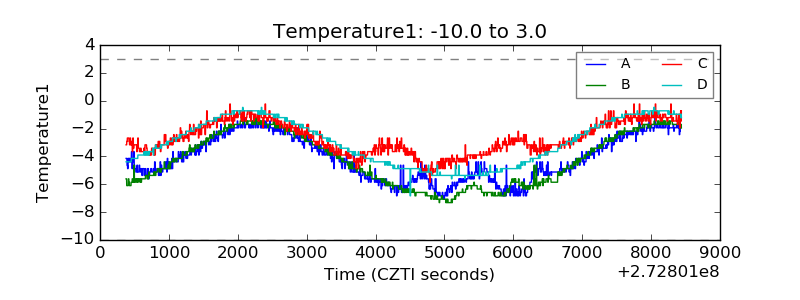 |
| Veto HV Monitor | 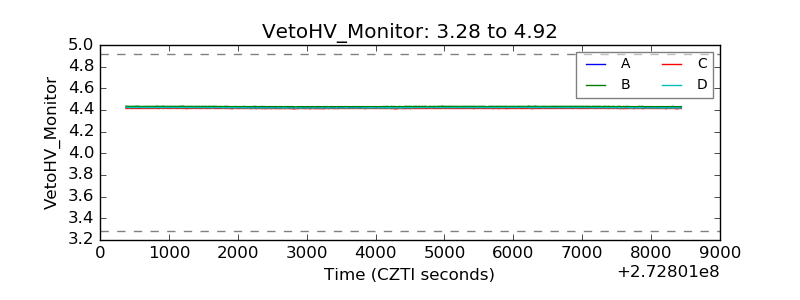 |
| Veto LLD | 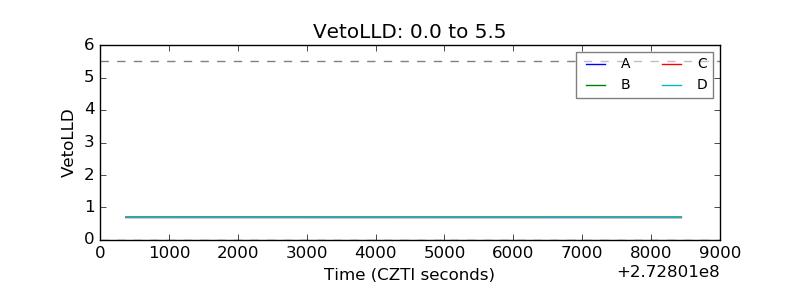 |
| Alpha Counter | 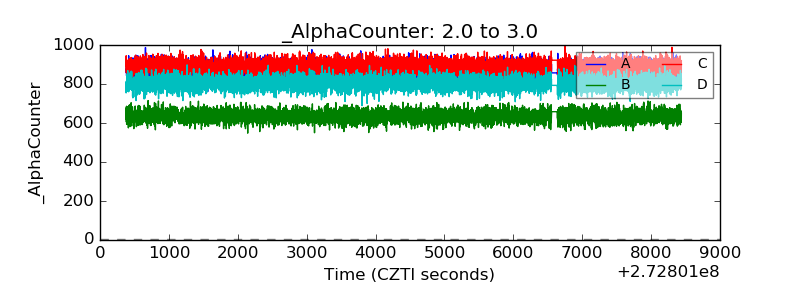 |
| _CPM_Rate | 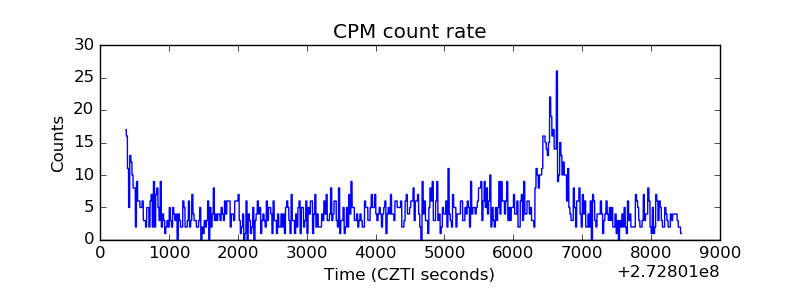 |
| CZT Counter | 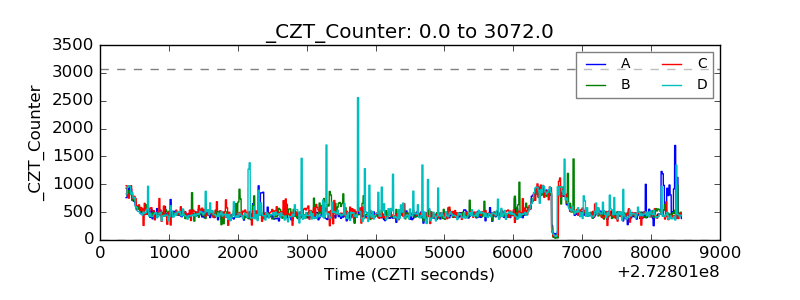 |
| +2.5 Volts monitor |  |
| +5 Volts monitor |  |
| _ROLL_ROT | 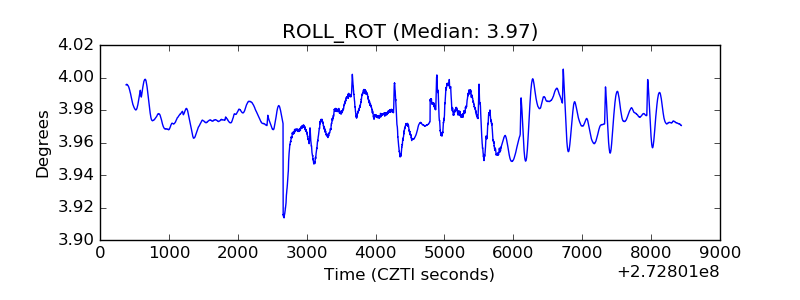 |
| _Roll_DEC | 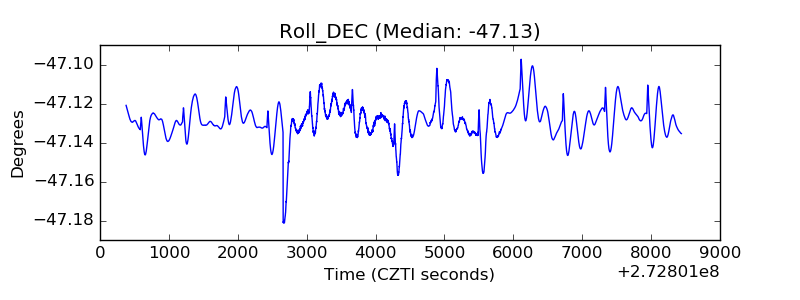 |
| _Roll_RA | 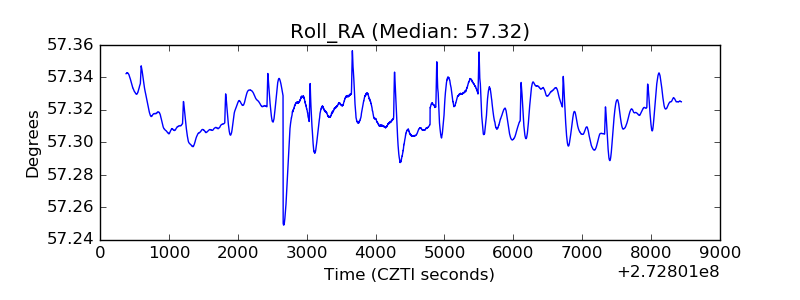 |
| Veto Counter | 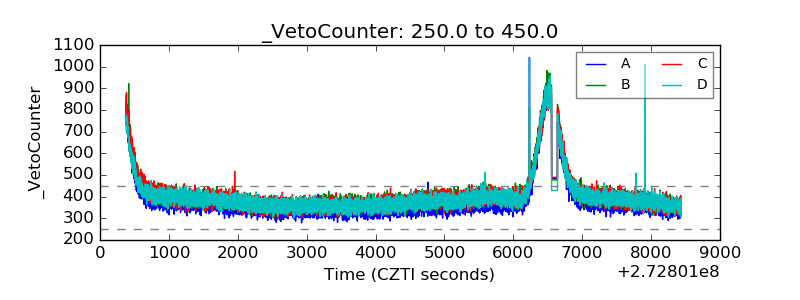 |