| Param | Original file | Final file |
|---|---|---|
| Filename | modeM0/AS1A04_198T01_9000002322_15710cztM0_level2.evt | modeM0/AS1A04_198T01_9000002322_15710cztM0_level2_quad_clean.evt |
| Size (bytes) | 494,441,280 | 83,678,400 |
| Size | 471.5 MB | 79.8 MB |
| Events in quadrant A | 3,620,537 | 507,184 |
| Events in quadrant B | 3,563,558 | 515,064 |
| Events in quadrant C | 3,633,567 | 503,154 |
| Events in quadrant D | 3,655,632 | 495,302 |
| Mode M0 | |||
|---|---|---|---|
| Quadrant | BADHDUFLAG | Total packets | Discarded packets |
| A | 0 | 15835 | 2 |
| B | 0 | 15309 | 1 |
| C | 0 | 15389 | 1 |
| D | 0 | 15954 | 1 |
| Mode SS | |||
|---|---|---|---|
| Quadrant | BADHDUFLAG | Total packets | Discarded packets |
| A | 0 | 150 | 0 |
| B | 0 | 150 | 0 |
| C | 0 | 150 | 0 |
| D | 0 | 150 | 0 |
| Mode M9 | |||
|---|---|---|---|
| Quadrant | BADHDUFLAG | Total packets | Discarded packets |
| A | 0 | 4 | 0 |
| B | 0 | 4 | 0 |
| C | 0 | 4 | 0 |
| D | 0 | 4 | 0 |
| Quadrant | Total seconds | Saturated seconds | Saturation percentage |
|---|---|---|---|
| A | 7371 | 147 | 1.994302% |
| B | 7371 | 78 | 1.058201% |
| C | 7371 | 90 | 1.221001% |
| D | 7371 | 68 | 0.922534% |
Noise dominated data is calculated using 1-second bins in cleaned event files. If a bin has >2000 counts, and if more than 50% of those come from <1% of pixels, then it is considered to be noise-dominated and hence unusable.
| Quadrant | # 1 sec bins | Bins with >0 counts | Bins with >2000 counts | High rate bins dominated by noise | Noise dominated (total time) | Noise dominated (detector-on time) | Marked lightcurve |
|---|---|---|---|---|---|---|---|
| A | 7767 | 7373 | 59 | 59 | 0.76% | 0.80% | 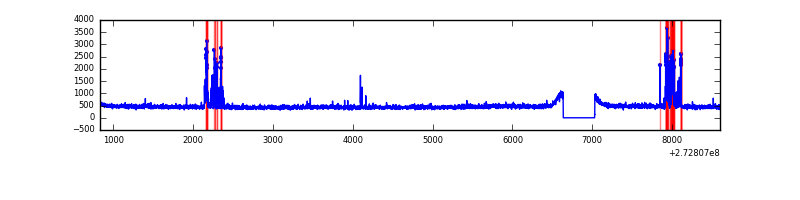 |
| B | 7767 | 7373 | 1 | 1 | 0.01% | 0.01% | 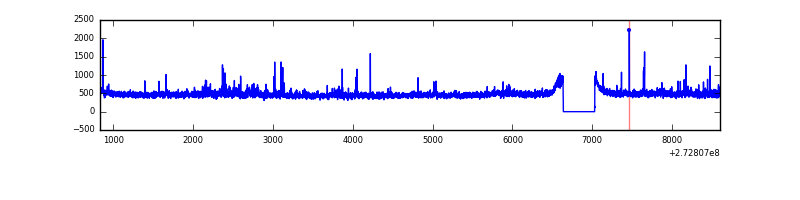 |
| C | 7767 | 7373 | 1 | 1 | 0.01% | 0.01% | 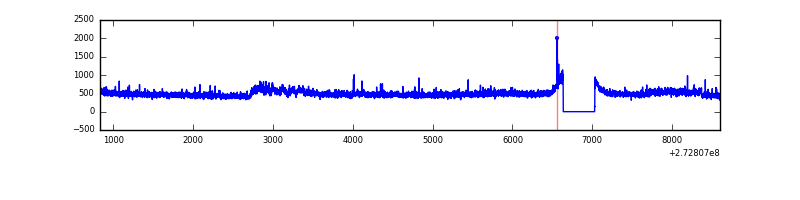 |
| D | 7767 | 7373 | 33 | 33 | 0.42% | 0.45% | 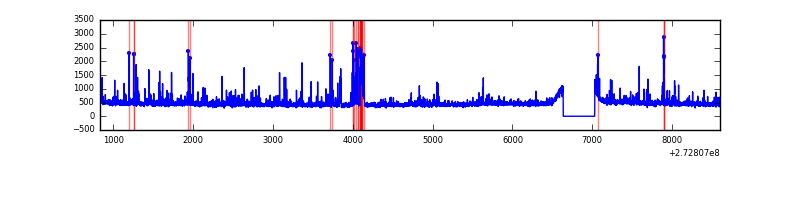 |
Top three noisy pixels from each quadrant. If the there are fewer than three noisy pixels in the level2.evt file, extra rows are filled as -1
| Pixel properties | Quadrant properties | ||||||
|---|---|---|---|---|---|---|---|
| Quadrant | DetID | PixID | Counts | Sigma | Mean | Median | Sigma |
| A | 13 | 248 | 282469 | 1610.64 | 861 | 841 | 174.9 |
| A | 9 | 143 | 21080 | 115.75 | 861 | 841 | 174.9 |
| A | 0 | 226 | 7583 | 38.56 | 861 | 841 | 174.9 |
| B | 3 | 209 | 46975 | 278.13 | 862 | 841 | 165.9 |
| B | 0 | 189 | 41770 | 246.75 | 862 | 841 | 165.9 |
| B | 5 | 236 | 26151 | 152.58 | 862 | 841 | 165.9 |
| C | 3 | 233 | 225025 | 1141.99 | 835 | 840 | 196.3 |
| C | 14 | 238 | 126686 | 641.05 | 835 | 840 | 196.3 |
| C | 9 | 54 | 12244 | 58.09 | 835 | 840 | 196.3 |
| D | 1 | 52 | 191753 | 865.76 | 844 | 823 | 220.5 |
| D | 5 | 51 | 120913 | 544.54 | 844 | 823 | 220.5 |
| D | 13 | 172 | 34304 | 151.82 | 844 | 823 | 220.5 |
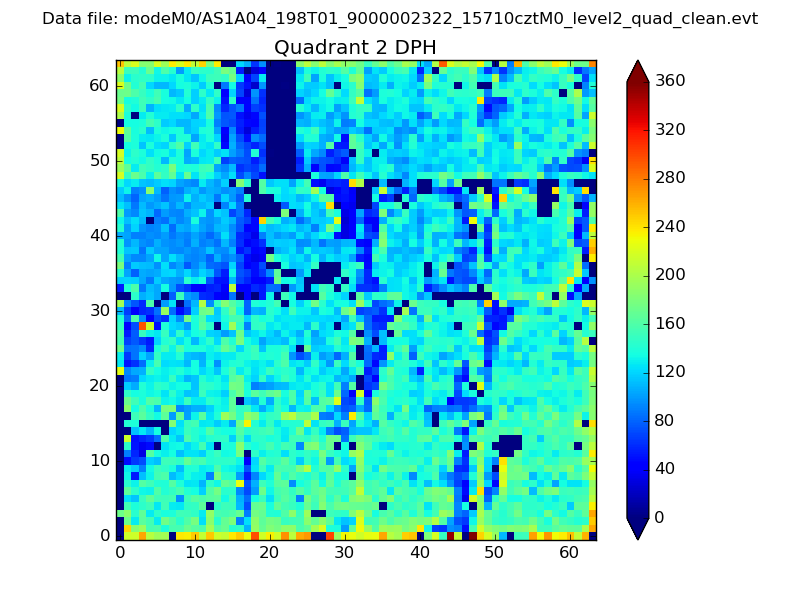
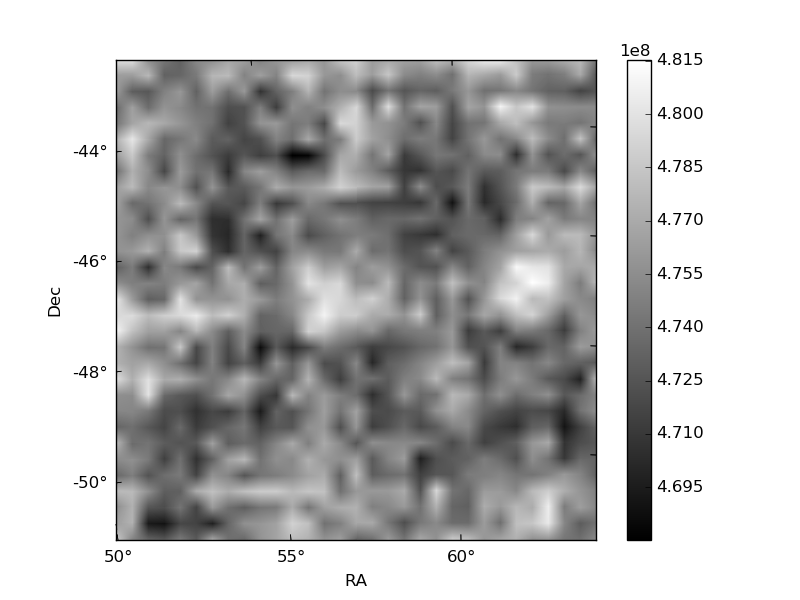
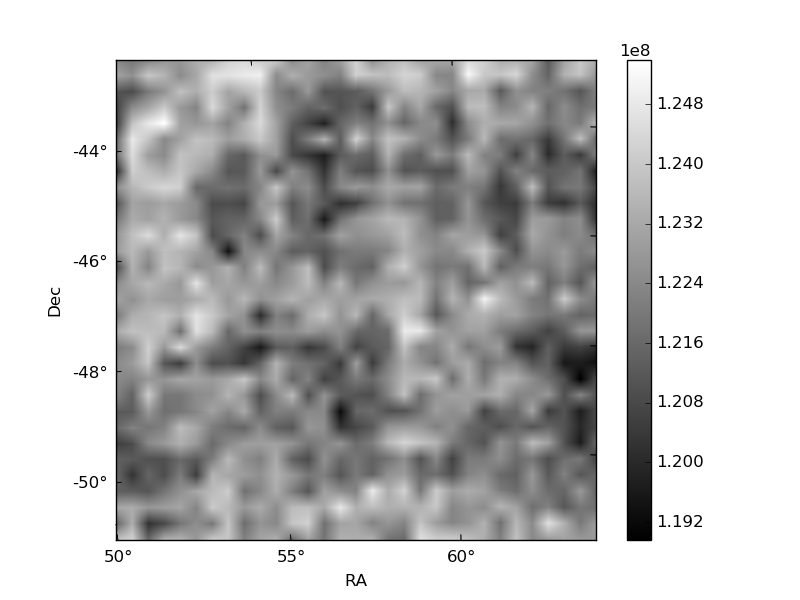
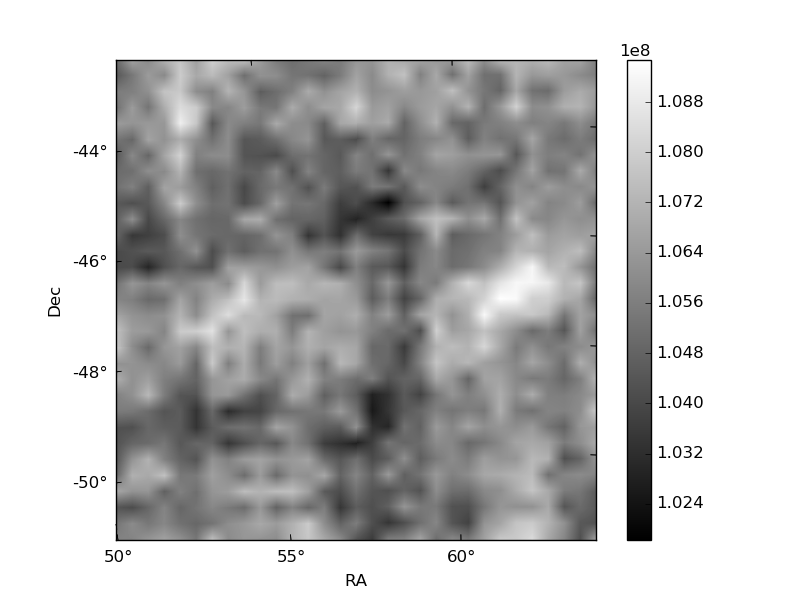
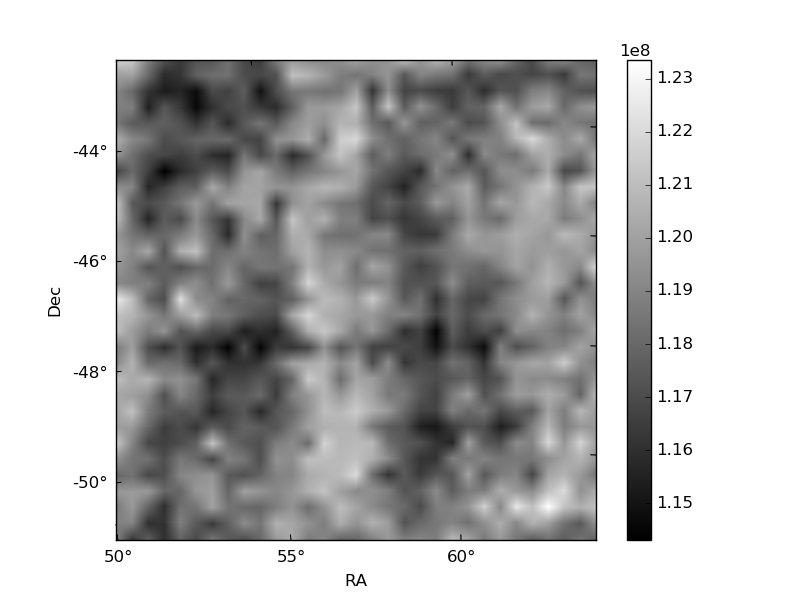
Histogram calculated using DETX and DETY for each event in the final _common_clean file
| Quadrant A | 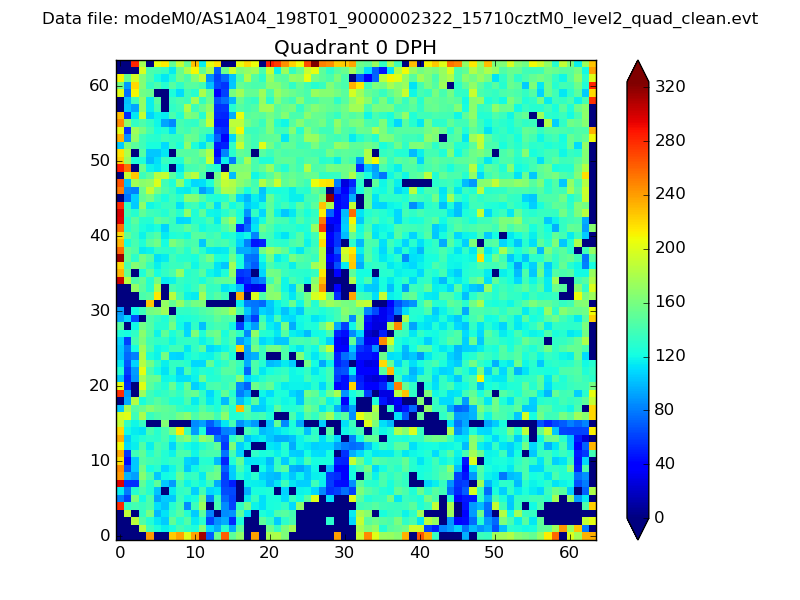 |
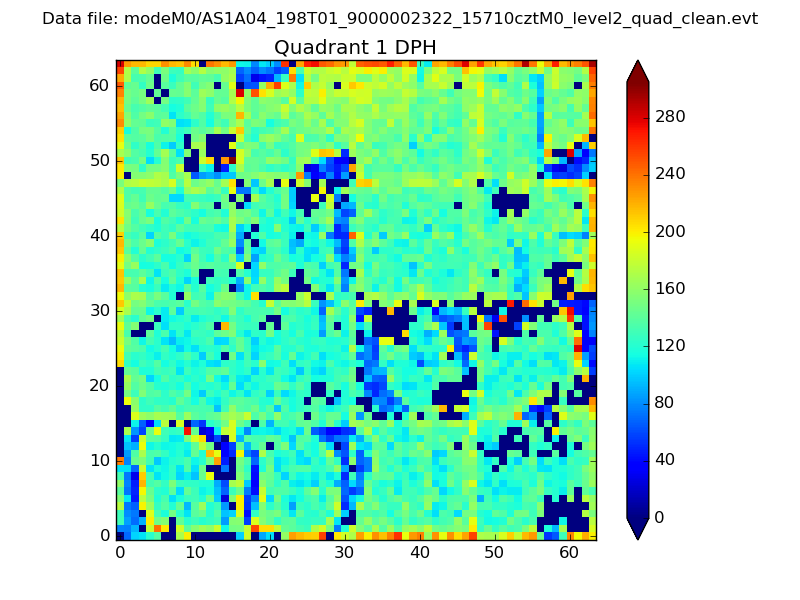 |
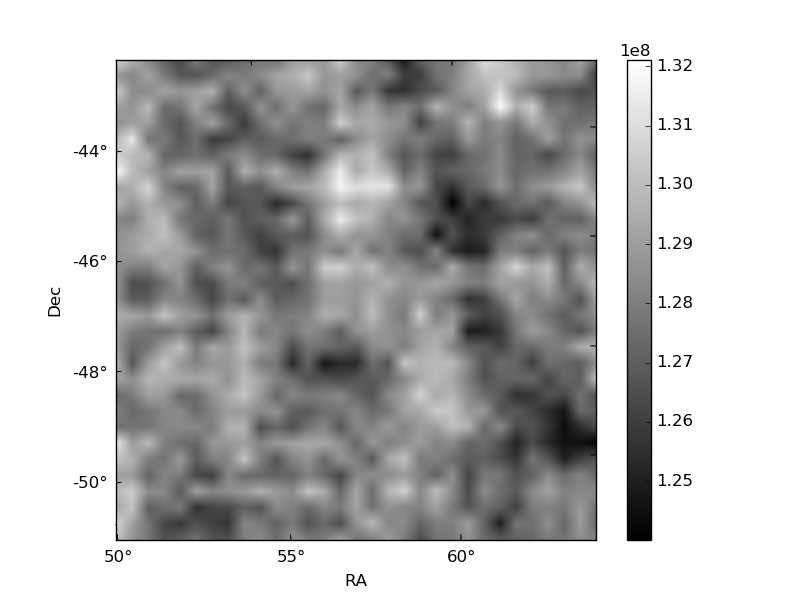
Quadrant B |
|---|---|---|---|
| Quadrant D | 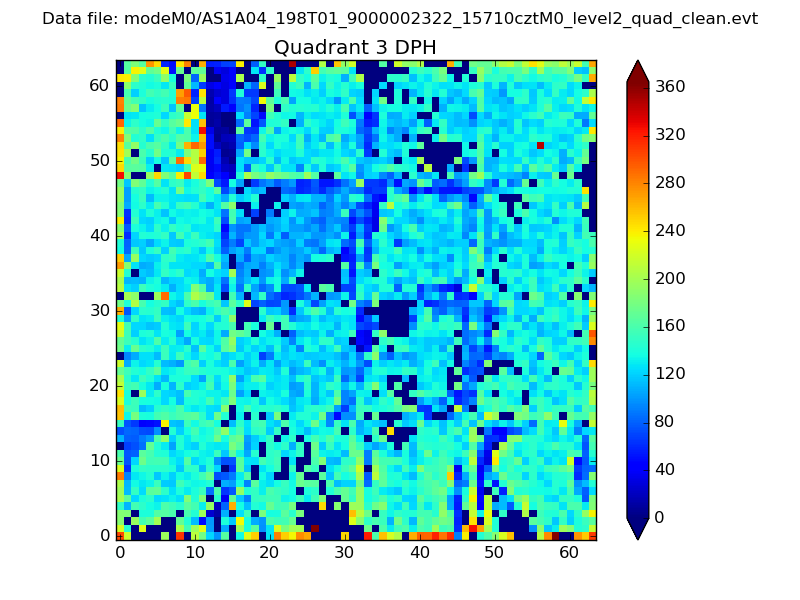 |
 |
Quadrant C |
| Plot type | Count rate plots | Images |
|---|---|---|
| Comparison with Poisson distribution Blue bars denote a histogram of data divided into 1 sec bins. Red curve is a Poisson curve with rate = median count rate of data. |
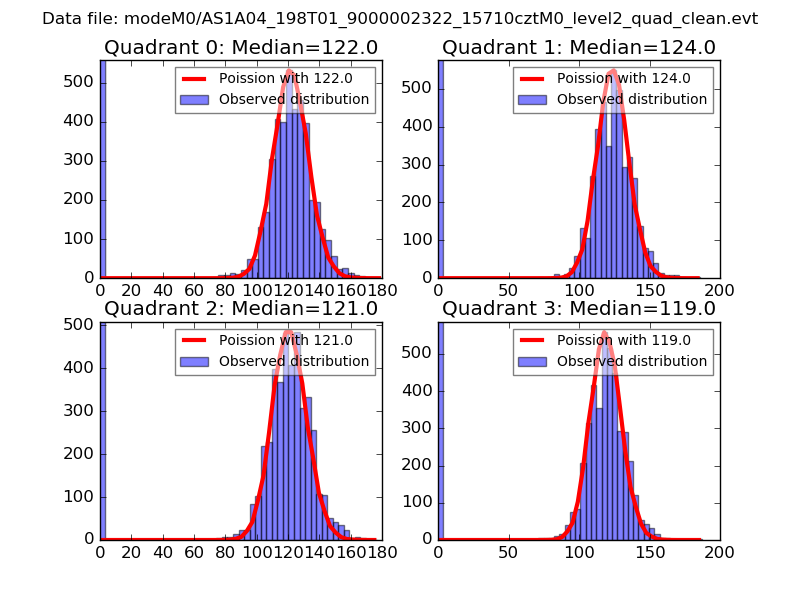 |
 |
| Quadrant-wise count rates Data is divided into 100 sec bins |
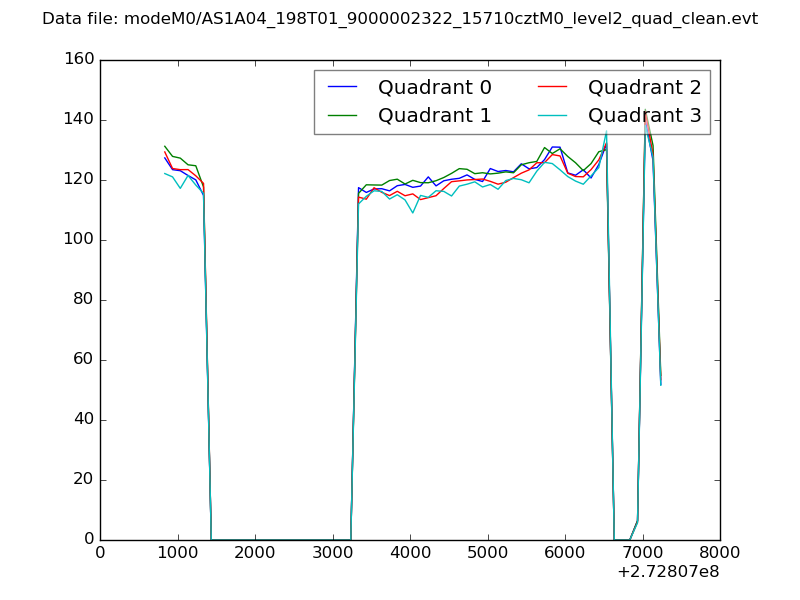 |
|
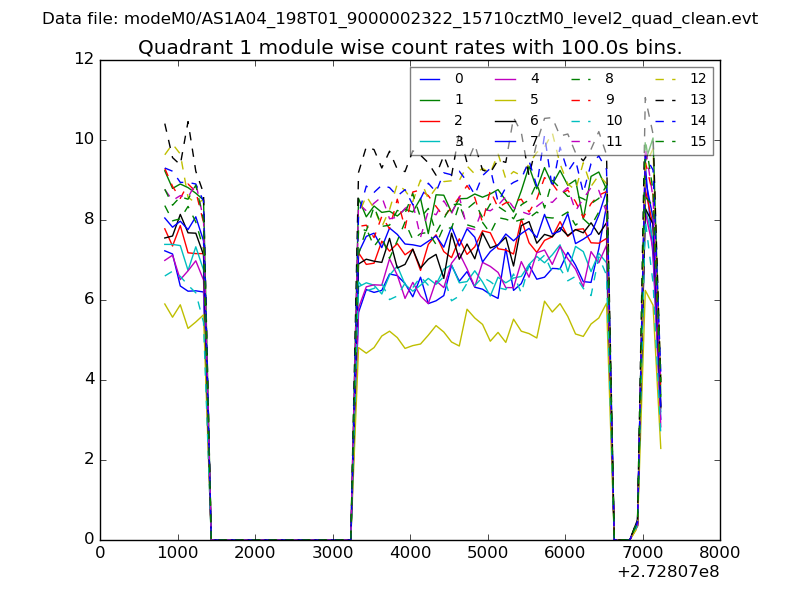
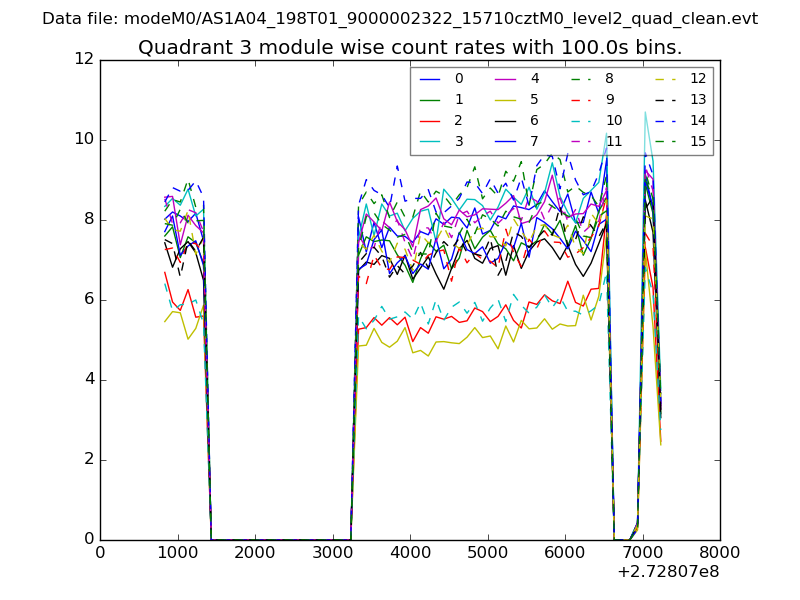
| Module-wise count rates for Quadrant A Data is divided into 100 sec bins |
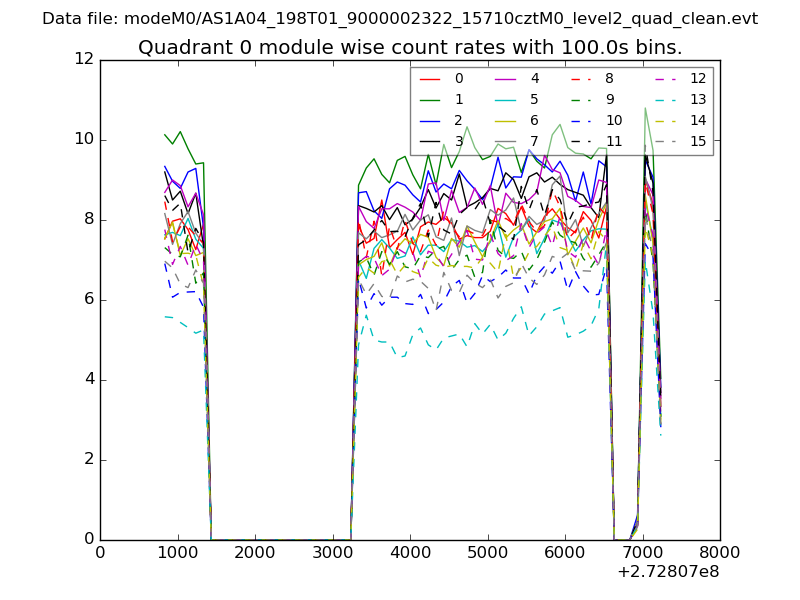 |
 |
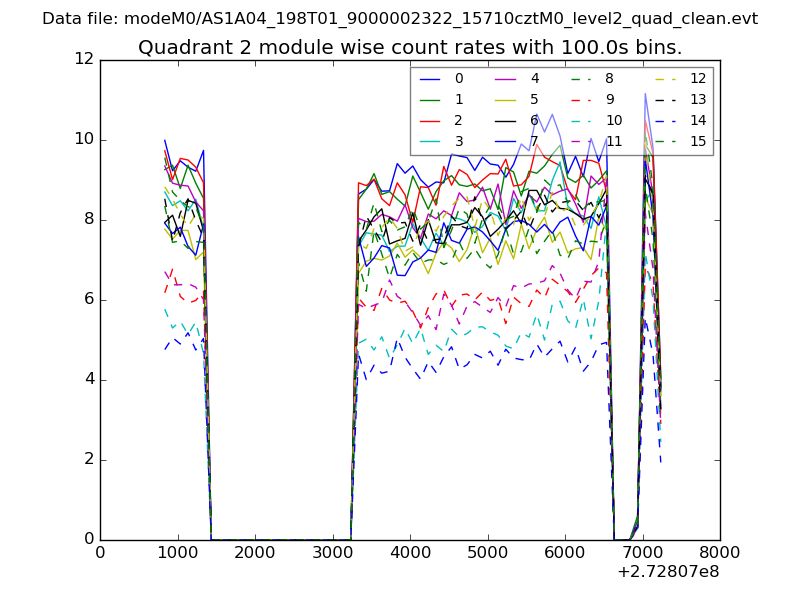
| Module-wise count rates for Quadrant B Data is divided into 100 sec bins |
 |
 |
| Module-wise count rates for Quadrant C Data is divided into 100 sec bins |
 |
 |
| Module-wise count rates for Quadrant D Data is divided into 100 sec bins |
 |
 |
| Parameter | Plot |
|---|---|
| CZT HV Monitor | 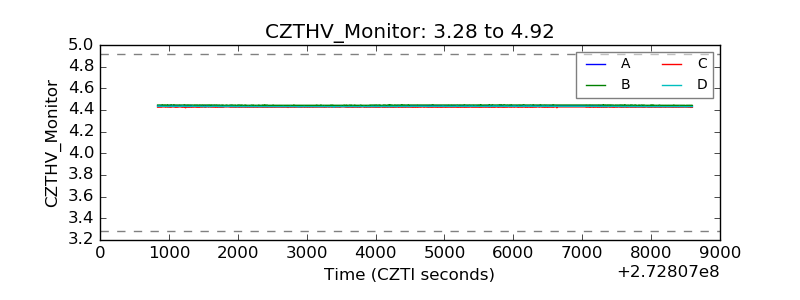 |
| D_VDD | 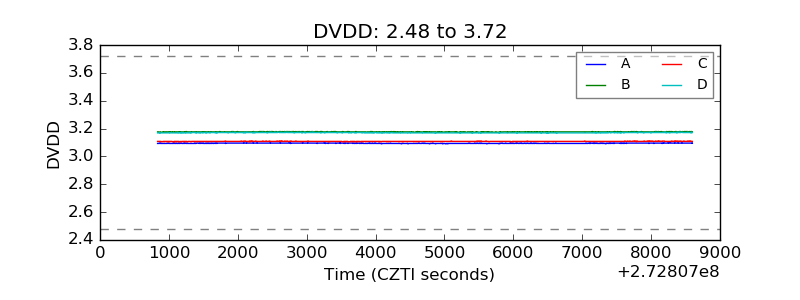 |
| Temperature 1 | 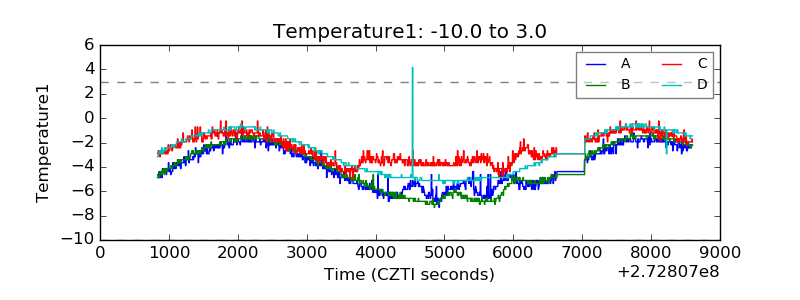 |
| Veto HV Monitor | 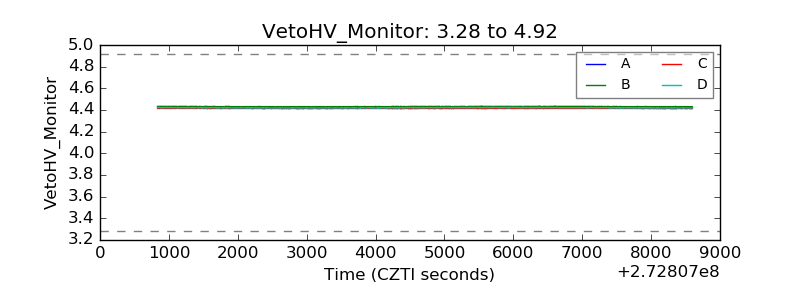 |
| Veto LLD | 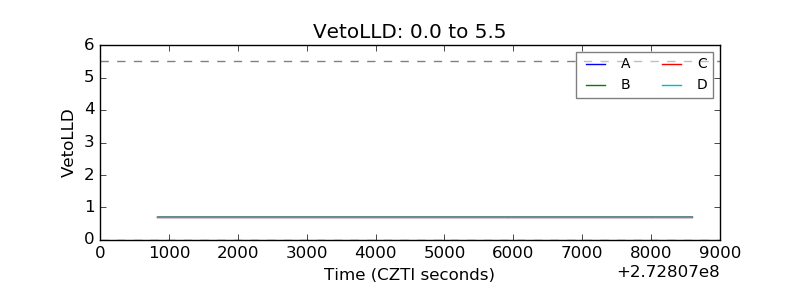 |
| Alpha Counter | 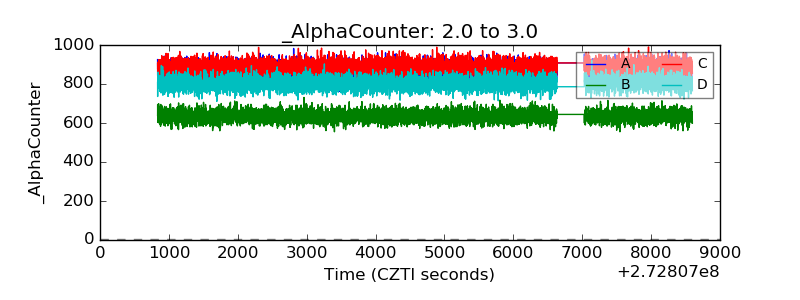 |
| _CPM_Rate | 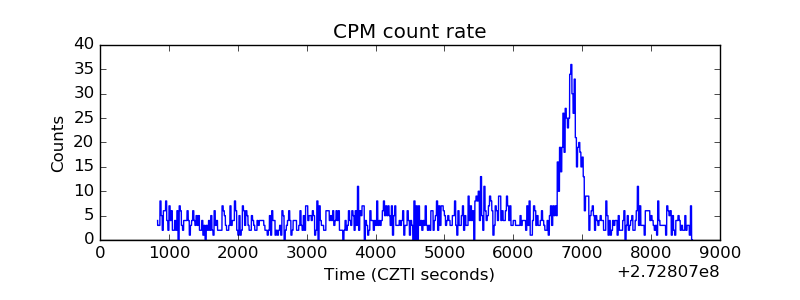 |
| CZT Counter | 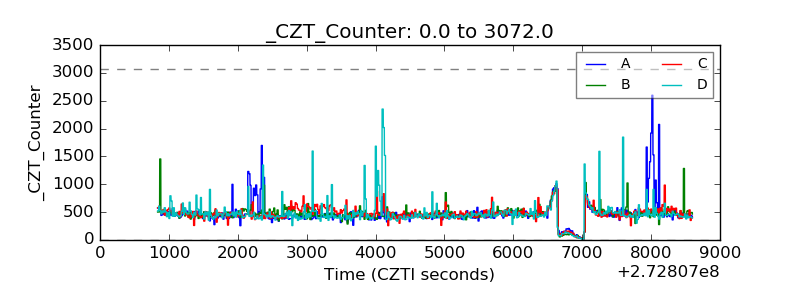 |
| +2.5 Volts monitor | 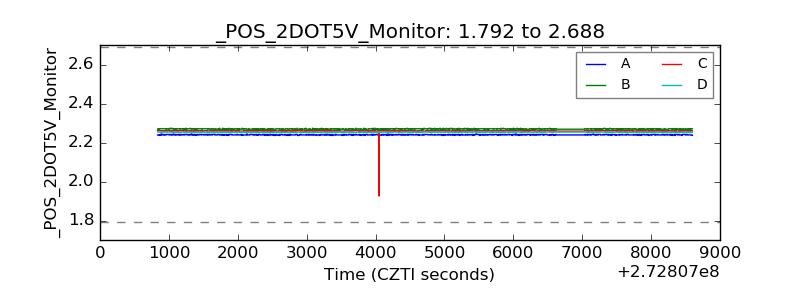 |
| +5 Volts monitor |  |
| _ROLL_ROT | 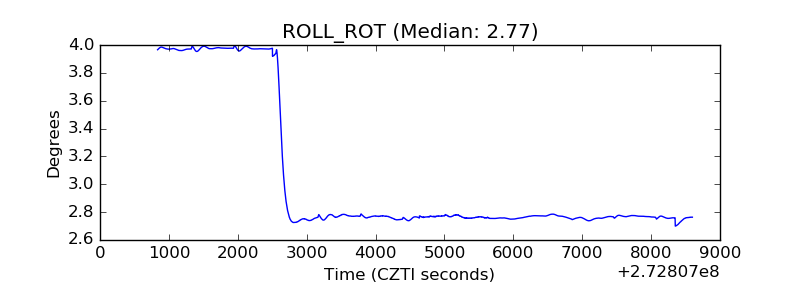 |
| _Roll_DEC | 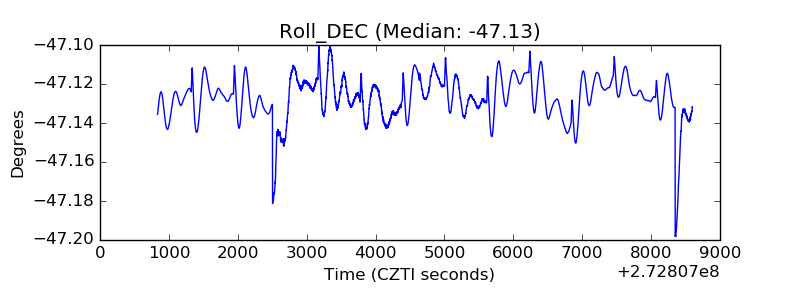 |
| _Roll_RA | 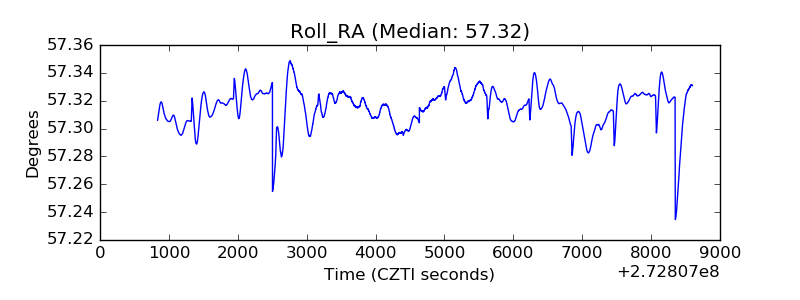 |
| Veto Counter | 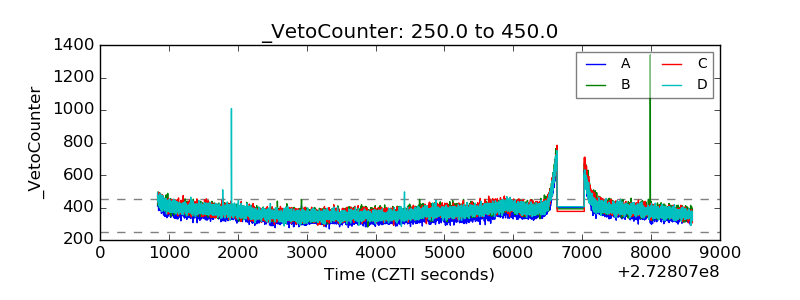 |