| Param | Original file | Final file |
|---|---|---|
| Filename | modeM0/AS1A04_198T01_9000002322_15713cztM0_level2.evt | modeM0/AS1A04_198T01_9000002322_15713cztM0_level2_quad_clean.evt |
| Size (bytes) | 1,239,903,360 | 239,137,920 |
| Size | 1.2 GB | 228.1 MB |
| Events in quadrant A | 8,581,107 | 1,506,825 |
| Events in quadrant B | 9,183,562 | 1,522,735 |
| Events in quadrant C | 8,845,973 | 1,481,951 |
| Events in quadrant D | 9,694,495 | 1,462,655 |
| Mode M0 | |||
|---|---|---|---|
| Quadrant | BADHDUFLAG | Total packets | Discarded packets |
| A | 0 | 38220 | 5 |
| B | 0 | 39401 | 4 |
| C | 0 | 38227 | 4 |
| D | 0 | 41535 | 4 |
| Mode SS | |||
|---|---|---|---|
| Quadrant | BADHDUFLAG | Total packets | Discarded packets |
| A | 0 | 376 | 0 |
| B | 0 | 376 | 0 |
| C | 0 | 376 | 0 |
| D | 0 | 376 | 0 |
| Mode M9 | |||
|---|---|---|---|
| Quadrant | BADHDUFLAG | Total packets | Discarded packets |
| A | 0 | 25 | 0 |
| B | 0 | 25 | 0 |
| C | 0 | 25 | 0 |
| D | 0 | 25 | 0 |
| Quadrant | Total seconds | Saturated seconds | Saturation percentage |
|---|---|---|---|
| A | 18412 | 258 | 1.401260% |
| B | 18412 | 265 | 1.439279% |
| C | 18412 | 263 | 1.428416% |
| D | 18412 | 306 | 1.661960% |
Noise dominated data is calculated using 1-second bins in cleaned event files. If a bin has >2000 counts, and if more than 50% of those come from <1% of pixels, then it is considered to be noise-dominated and hence unusable.
| Quadrant | # 1 sec bins | Bins with >0 counts | Bins with >2000 counts | High rate bins dominated by noise | Noise dominated (total time) | Noise dominated (detector-on time) | Marked lightcurve |
|---|---|---|---|---|---|---|---|
| A | 20878 | 18417 | 43 | 43 | 0.21% | 0.23% | 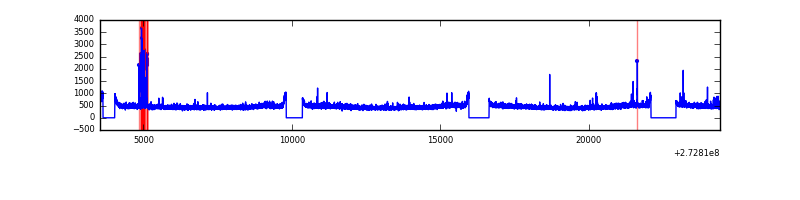 |
| B | 20878 | 18417 | 11 | 11 | 0.05% | 0.06% | 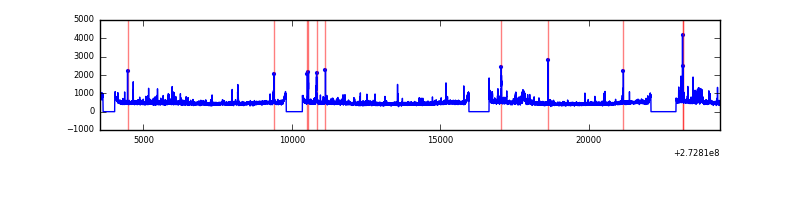 |
| C | 20878 | 18417 | 2 | 2 | 0.01% | 0.01% | 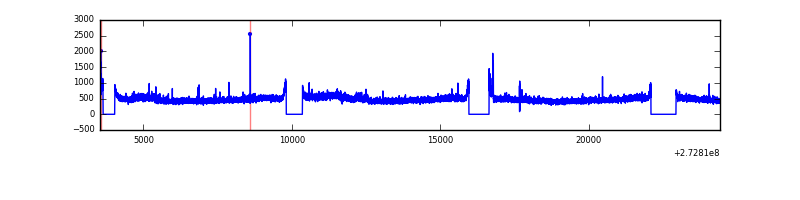 |
| D | 20878 | 18417 | 162 | 162 | 0.78% | 0.88% | 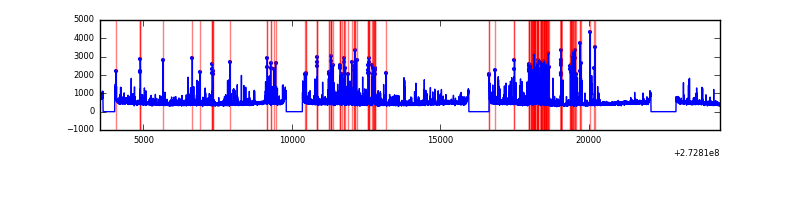 |
Top three noisy pixels from each quadrant. If the there are fewer than three noisy pixels in the level2.evt file, extra rows are filled as -1
| Pixel properties | Quadrant properties | ||||||
|---|---|---|---|---|---|---|---|
| Quadrant | DetID | PixID | Counts | Sigma | Mean | Median | Sigma |
| A | 13 | 248 | 167257 | 379.98 | 2160 | 2112 | 434.6 |
| A | 9 | 143 | 51948 | 114.67 | 2160 | 2112 | 434.6 |
| A | 11 | 29 | 27300 | 57.95 | 2160 | 2112 | 434.6 |
| B | 4 | 216 | 170360 | 406.82 | 2163 | 2103 | 413.6 |
| B | 4 | 173 | 120987 | 287.44 | 2163 | 2103 | 413.6 |
| B | 0 | 189 | 97027 | 229.51 | 2163 | 2103 | 413.6 |
| C | 3 | 233 | 346324 | 703.98 | 2086 | 2098 | 489.0 |
| C | 14 | 238 | 324704 | 659.77 | 2086 | 2098 | 489.0 |
| C | 15 | 127 | 16641 | 29.74 | 2086 | 2098 | 489.0 |
| D | 1 | 52 | 1354060 | 2422.49 | 2098 | 2049 | 558.1 |
| D | 13 | 172 | 96265 | 168.81 | 2098 | 2049 | 558.1 |
| D | 12 | 110 | 76943 | 134.19 | 2098 | 2049 | 558.1 |
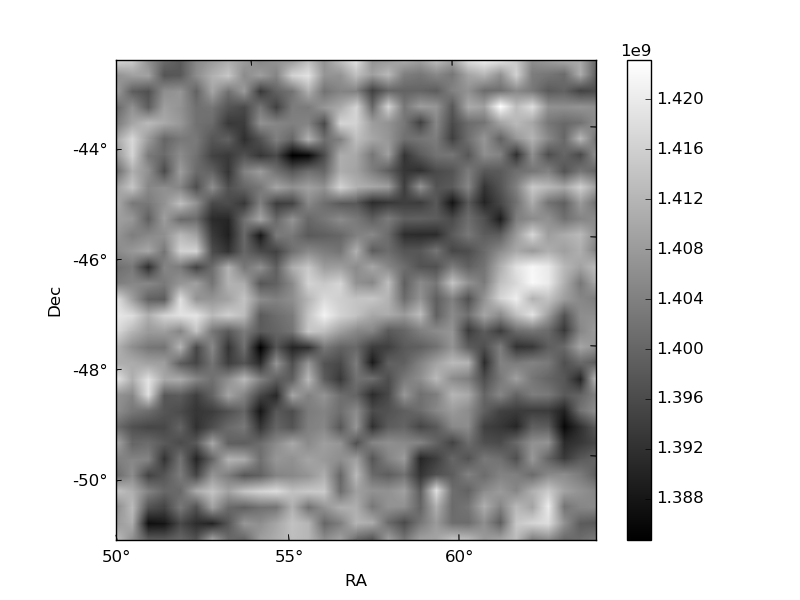
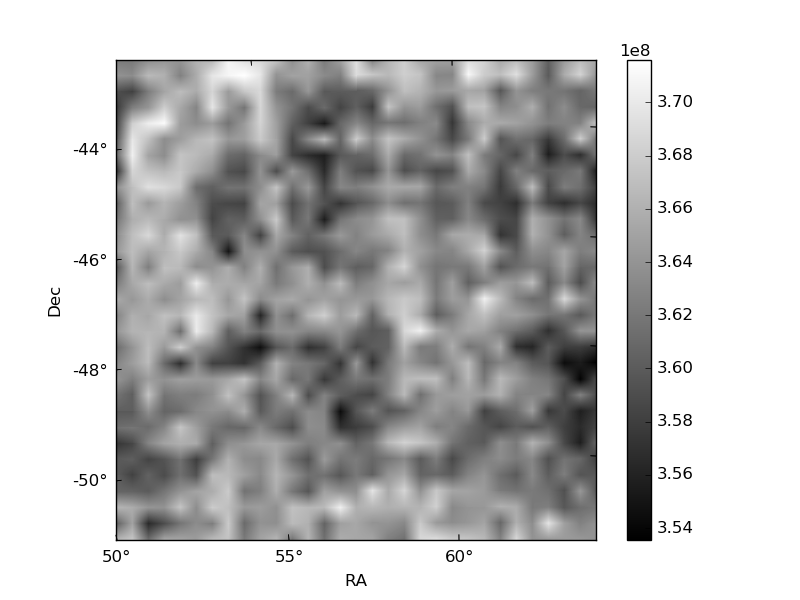
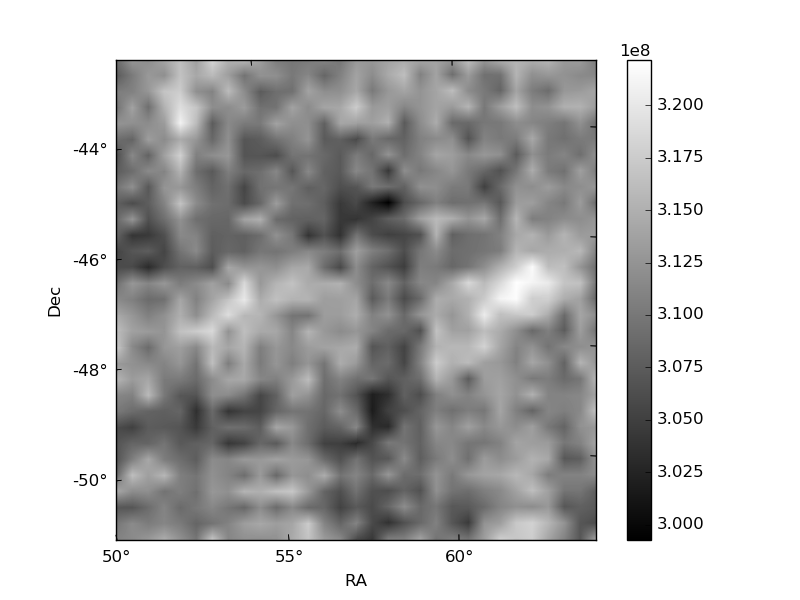
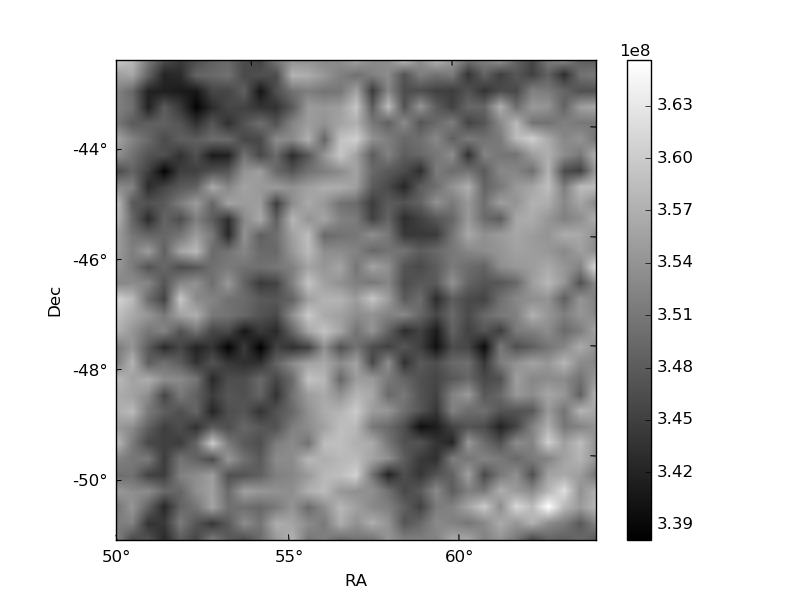
Histogram calculated using DETX and DETY for each event in the final _common_clean file
| Quadrant A | 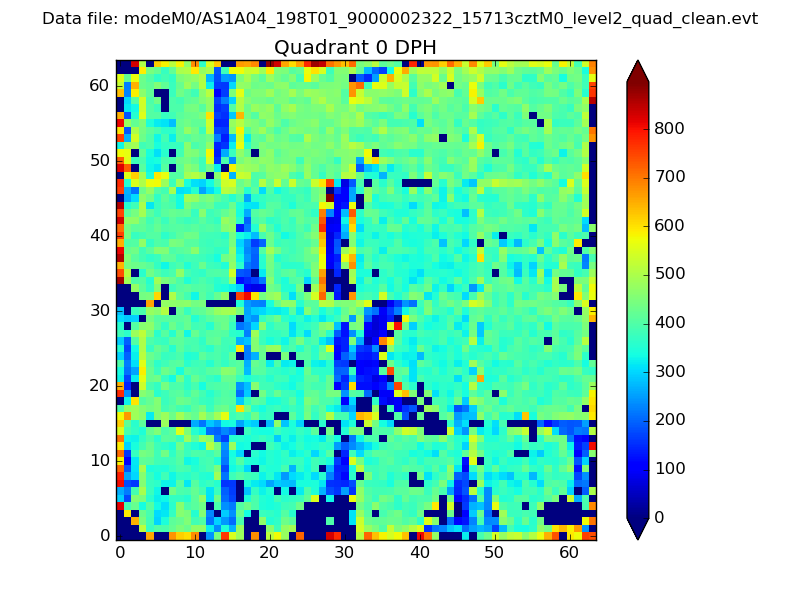 |
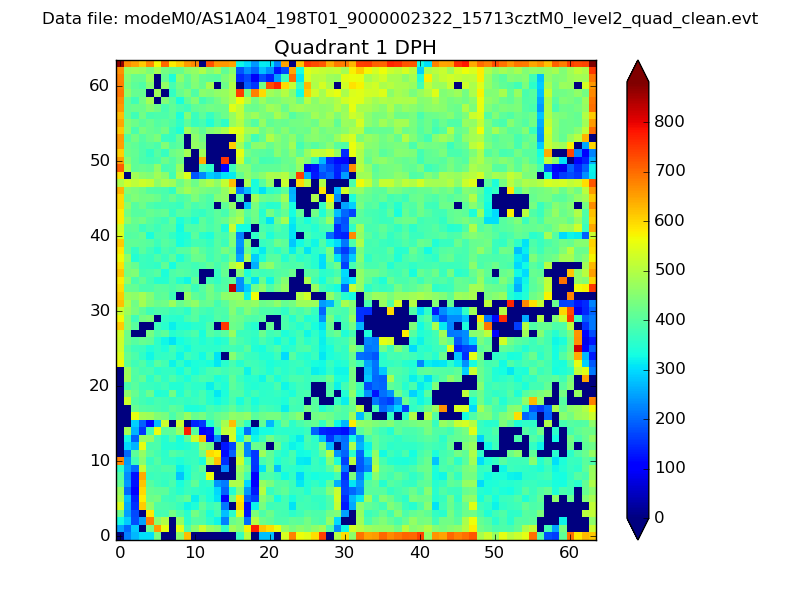 |
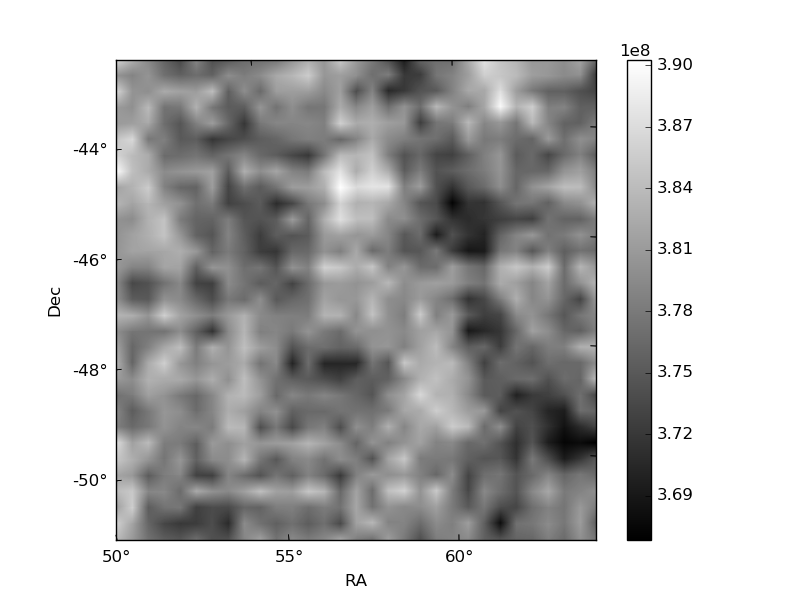
Quadrant B |
|---|---|---|---|
| Quadrant D | 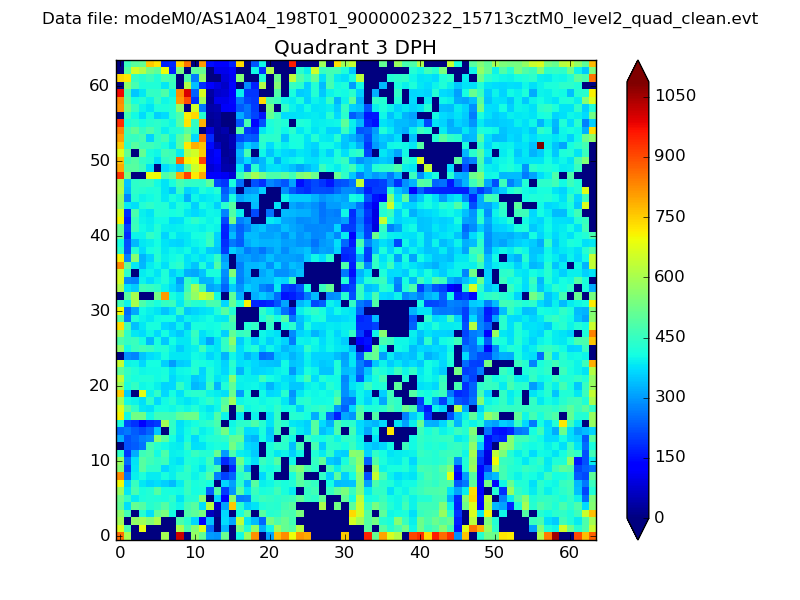 |
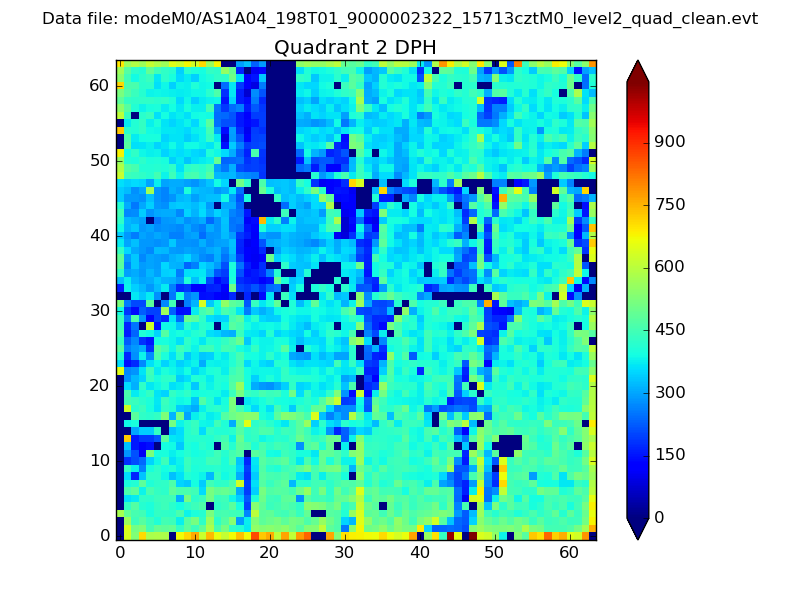 |
Quadrant C |
| Plot type | Count rate plots | Images |
|---|---|---|
| Comparison with Poisson distribution Blue bars denote a histogram of data divided into 1 sec bins. Red curve is a Poisson curve with rate = median count rate of data. |
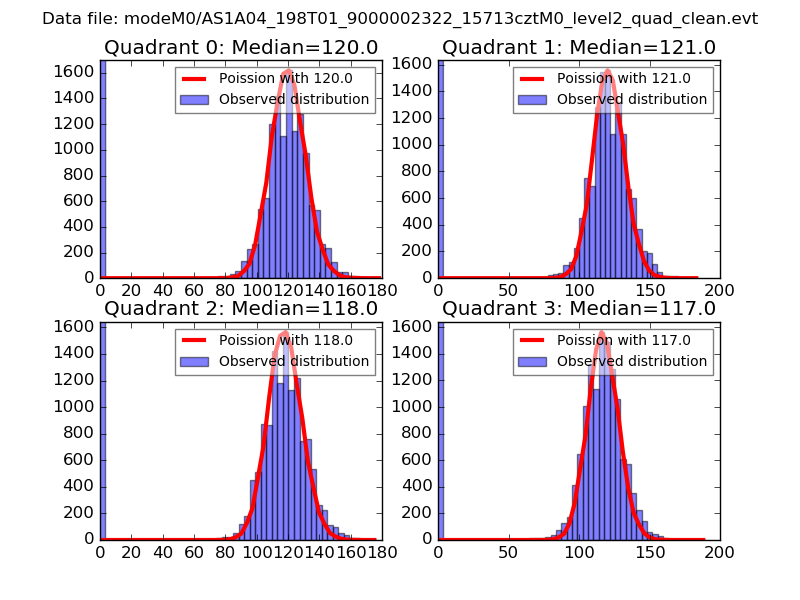 |
 |
| Quadrant-wise count rates Data is divided into 100 sec bins |
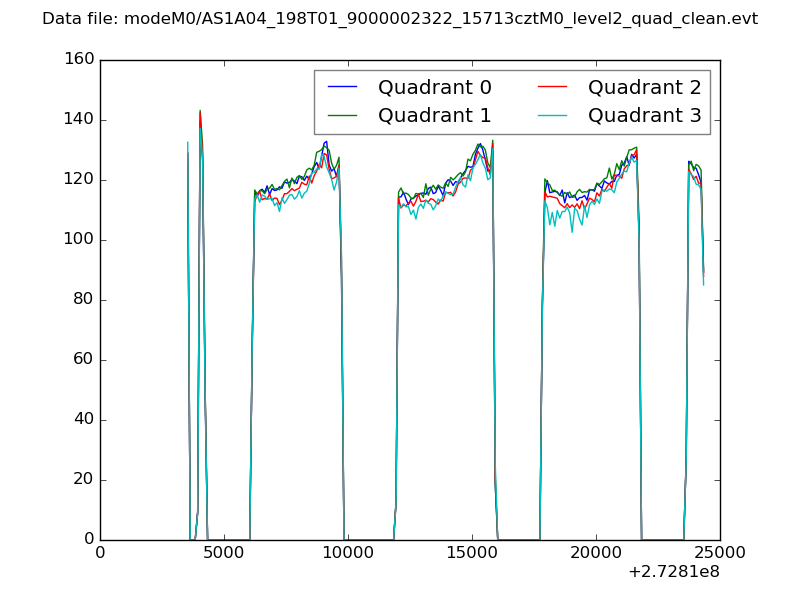 |
|
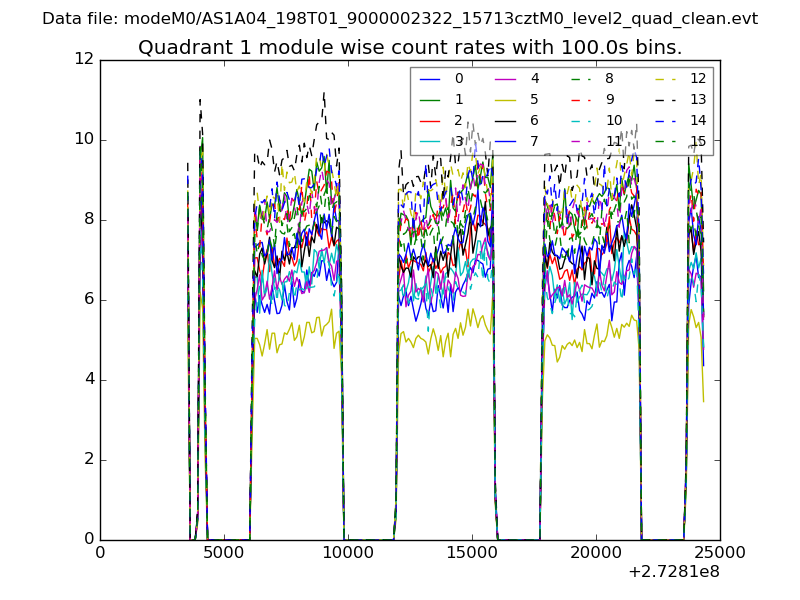
| Module-wise count rates for Quadrant A Data is divided into 100 sec bins |
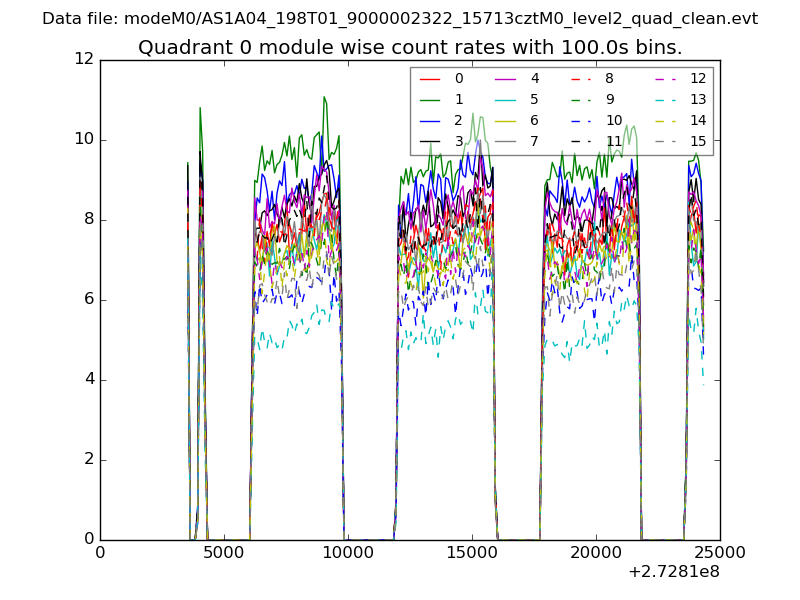 |
 |
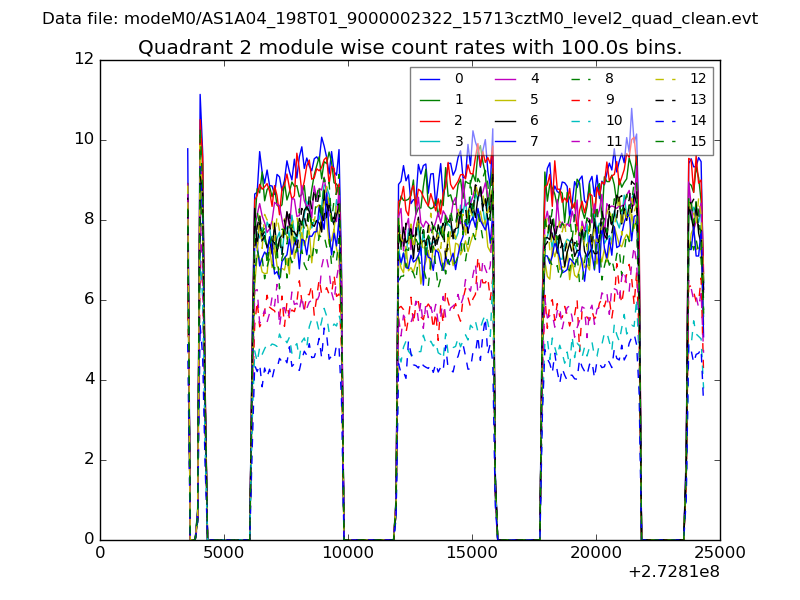
| Module-wise count rates for Quadrant B Data is divided into 100 sec bins |
 |
 |
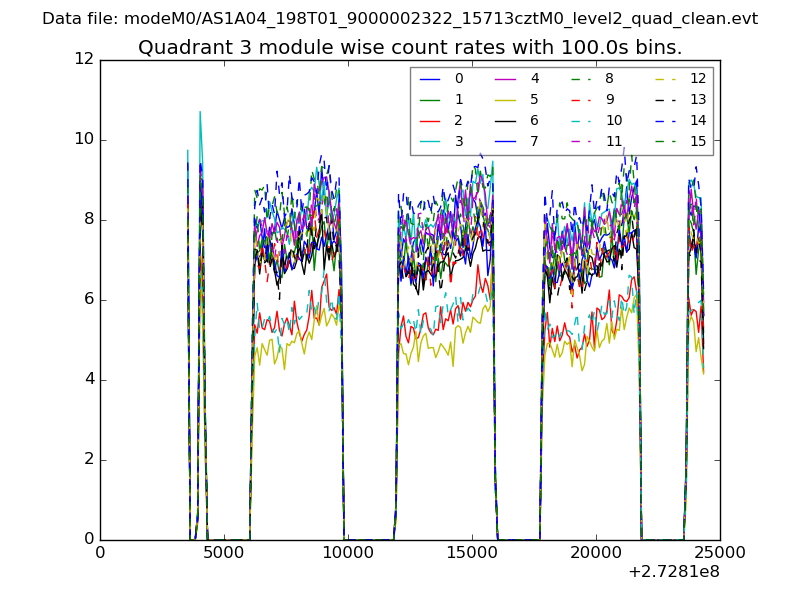
| Module-wise count rates for Quadrant C Data is divided into 100 sec bins |
 |
 |
| Module-wise count rates for Quadrant D Data is divided into 100 sec bins |
 |
 |
| Parameter | Plot |
|---|---|
| CZT HV Monitor | 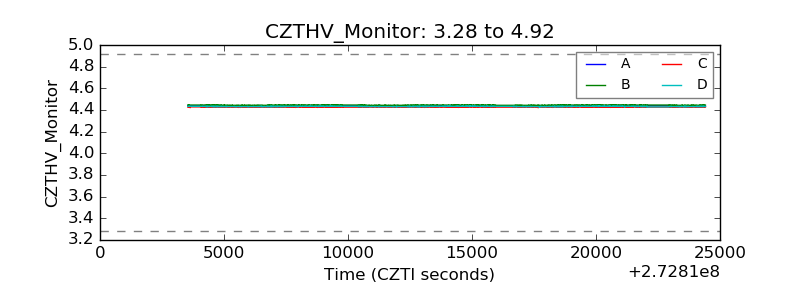 |
| D_VDD | 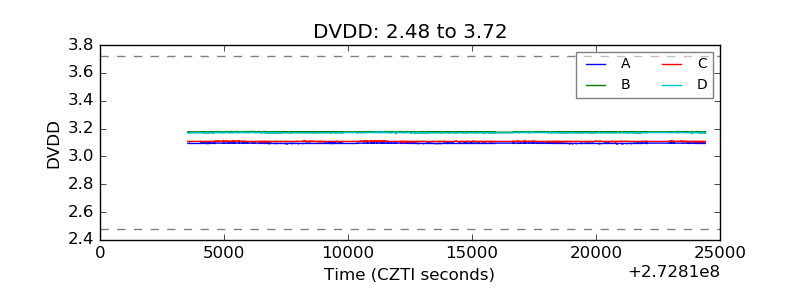 |
| Temperature 1 | 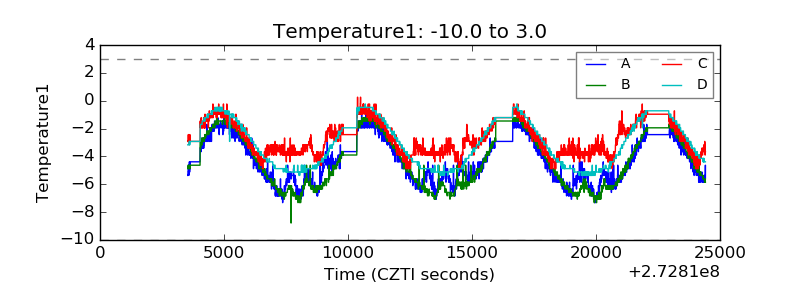 |
| Veto HV Monitor | 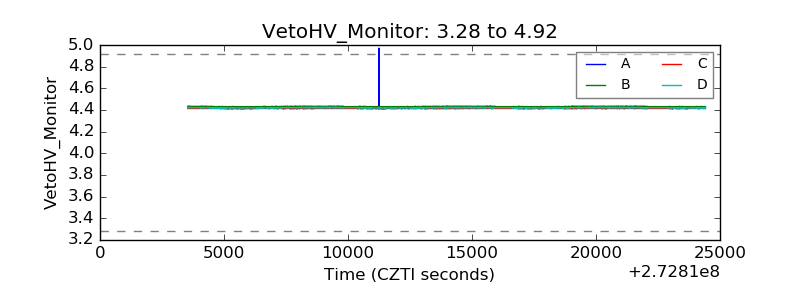 |
| Veto LLD | 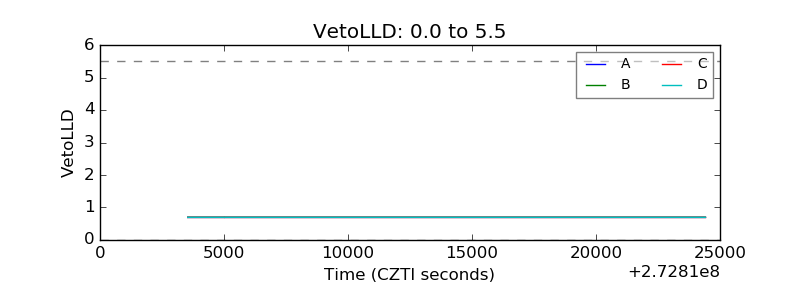 |
| Alpha Counter |  |
| _CPM_Rate | 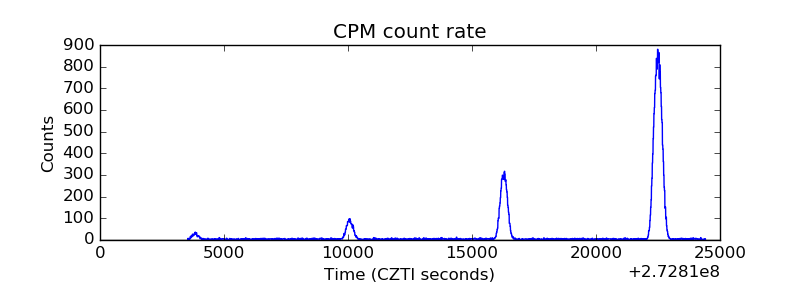 |
| CZT Counter | 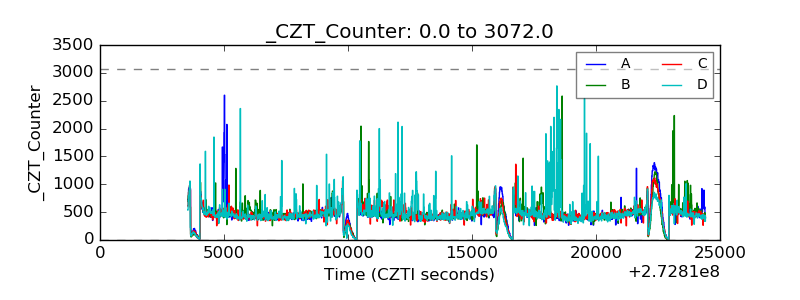 |
| +2.5 Volts monitor |  |
| +5 Volts monitor |  |
| _ROLL_ROT |  |
| _Roll_DEC | 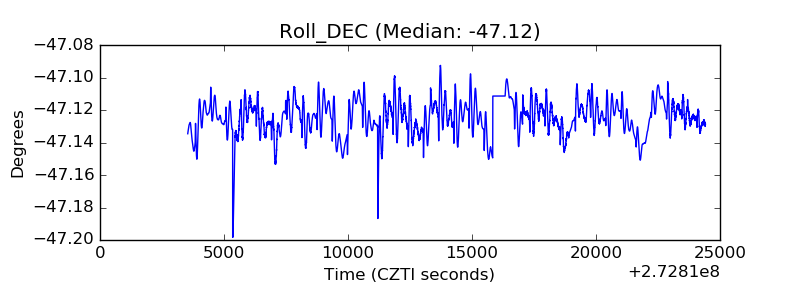 |
| _Roll_RA | 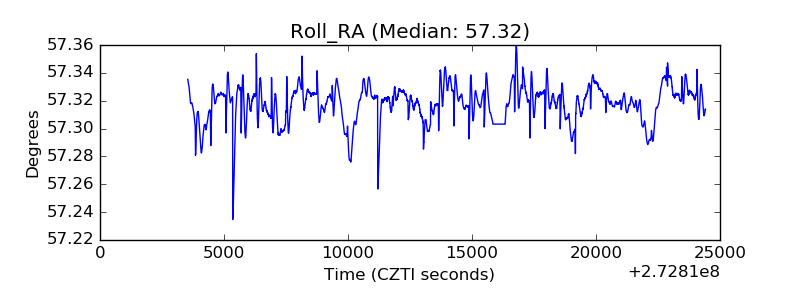 |
| Veto Counter | 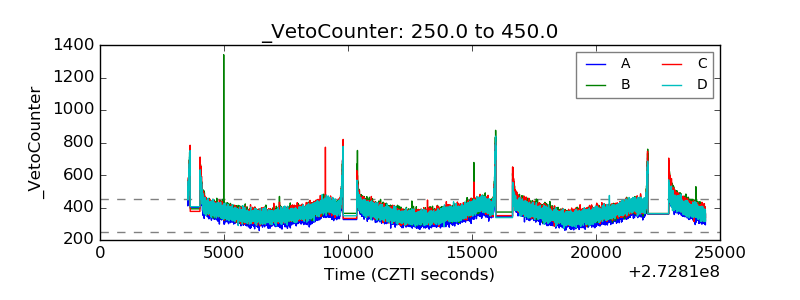 |