| Param | Original file | Final file |
|---|---|---|
| Filename | modeM0/AS1A04_198T01_9000002322_15717cztM0_level2.evt | modeM0/AS1A04_198T01_9000002322_15717cztM0_level2_quad_clean.evt |
| Size (bytes) | 499,723,200 | 105,183,360 |
| Size | 476.6 MB | 100.3 MB |
| Events in quadrant A | 2,977,783 | 692,105 |
| Events in quadrant B | 3,181,211 | 716,817 |
| Events in quadrant C | 3,937,380 | 693,480 |
| Events in quadrant D | 4,615,162 | 648,132 |
| Mode M0 | |||
|---|---|---|---|
| Quadrant | BADHDUFLAG | Total packets | Discarded packets |
| A | 0 | 12905 | 3 |
| B | 0 | 13464 | 2 |
| C | 0 | 16136 | 2 |
| D | 0 | 18010 | 2 |
| Mode SS | |||
|---|---|---|---|
| Quadrant | BADHDUFLAG | Total packets | Discarded packets |
| A | 0 | 126 | 0 |
| B | 0 | 126 | 0 |
| C | 0 | 126 | 0 |
| D | 0 | 126 | 0 |
| Mode M9 | |||
|---|---|---|---|
| Quadrant | BADHDUFLAG | Total packets | Discarded packets |
| A | 0 | 20 | 0 |
| B | 0 | 20 | 0 |
| C | 0 | 20 | 0 |
| D | 0 | 21 | 0 |
| Quadrant | Total seconds | Saturated seconds | Saturation percentage |
|---|---|---|---|
| A | 6233 | 13 | 0.208567% |
| B | 6233 | 39 | 0.625702% |
| C | 6233 | 43 | 0.689876% |
| D | 6233 | 375 | 6.016365% |
Noise dominated data is calculated using 1-second bins in cleaned event files. If a bin has >2000 counts, and if more than 50% of those come from <1% of pixels, then it is considered to be noise-dominated and hence unusable.
| Quadrant | # 1 sec bins | Bins with >0 counts | Bins with >2000 counts | High rate bins dominated by noise | Noise dominated (total time) | Noise dominated (detector-on time) | Marked lightcurve |
|---|---|---|---|---|---|---|---|
| A | 7469 | 6235 | 2 | 2 | 0.03% | 0.03% | 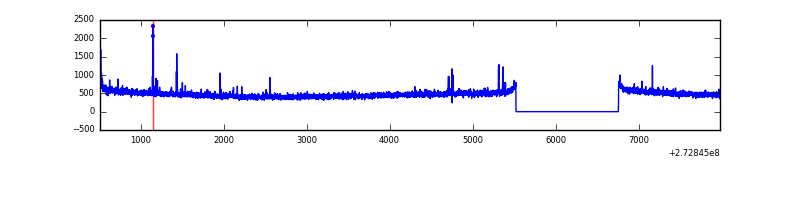 |
| B | 7469 | 6235 | 11 | 11 | 0.15% | 0.18% | 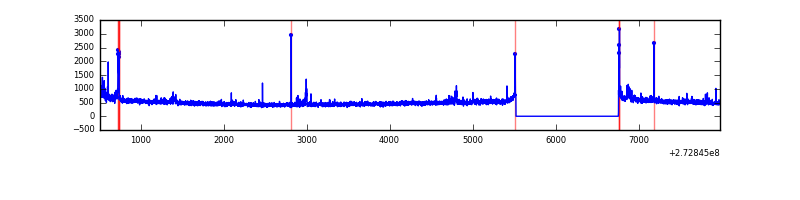 |
| C | 7469 | 6235 | 0 | 0 | 0.00% | 0.00% | 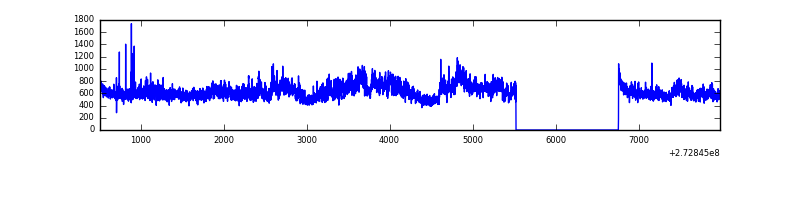 |
| D | 7469 | 6235 | 323 | 323 | 4.32% | 5.18% | 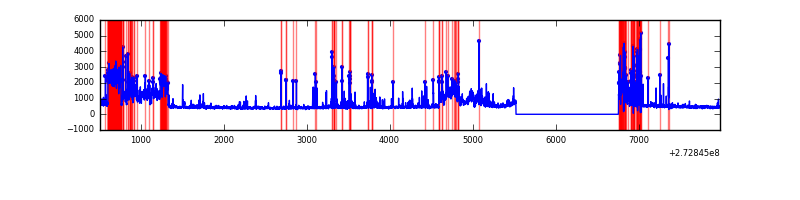 |
Top three noisy pixels from each quadrant. If the there are fewer than three noisy pixels in the level2.evt file, extra rows are filled as -1
| Pixel properties | Quadrant properties | ||||||
|---|---|---|---|---|---|---|---|
| Quadrant | DetID | PixID | Counts | Sigma | Mean | Median | Sigma |
| A | 9 | 143 | 26459 | 168.36 | 764 | 749 | 152.7 |
| A | 15 | 69 | 9260 | 55.74 | 764 | 749 | 152.7 |
| A | 0 | 226 | 6935 | 40.51 | 764 | 749 | 152.7 |
| B | 5 | 236 | 68344 | 463.38 | 776 | 756 | 145.9 |
| B | 4 | 173 | 32052 | 214.56 | 776 | 756 | 145.9 |
| B | 0 | 230 | 23276 | 154.39 | 776 | 756 | 145.9 |
| C | 3 | 233 | 818300 | 4656.12 | 756 | 763 | 175.6 |
| C | 14 | 238 | 116720 | 660.41 | 756 | 763 | 175.6 |
| C | 9 | 54 | 43060 | 240.89 | 756 | 763 | 175.6 |
| D | 12 | 144 | 1157670 | 5920.26 | 731 | 717 | 195.4 |
| D | 1 | 52 | 593583 | 3033.76 | 731 | 717 | 195.4 |
| D | 10 | 70 | 56950 | 287.75 | 731 | 717 | 195.4 |
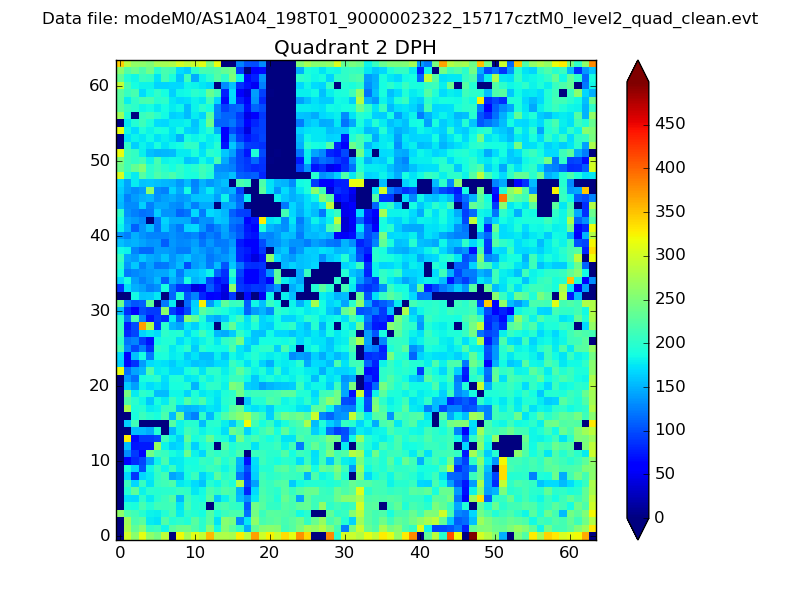
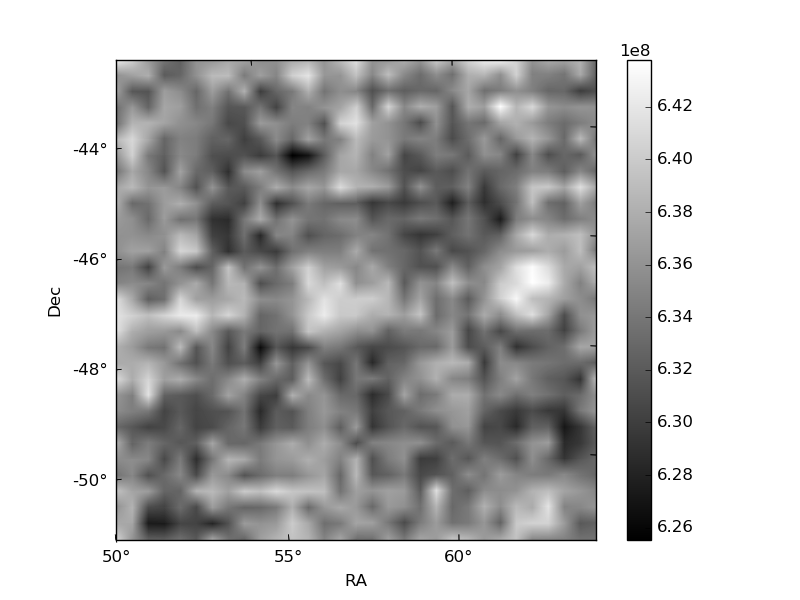
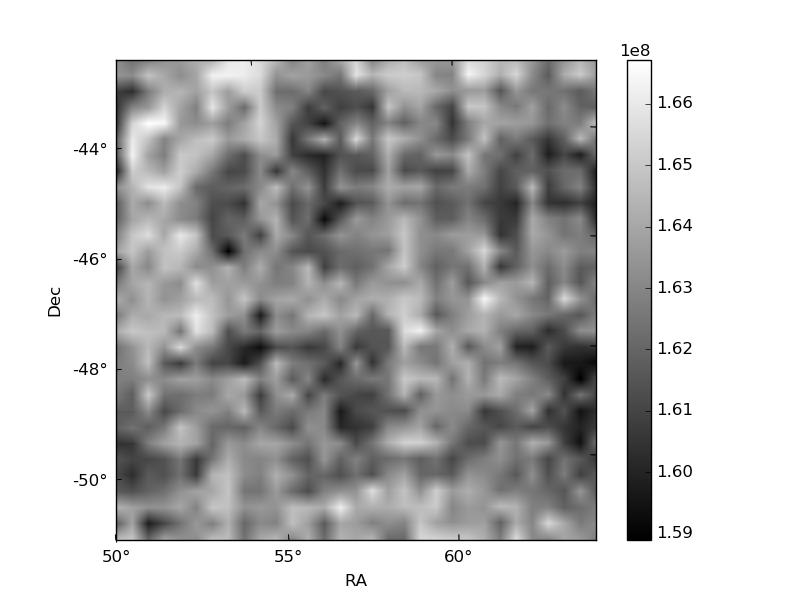
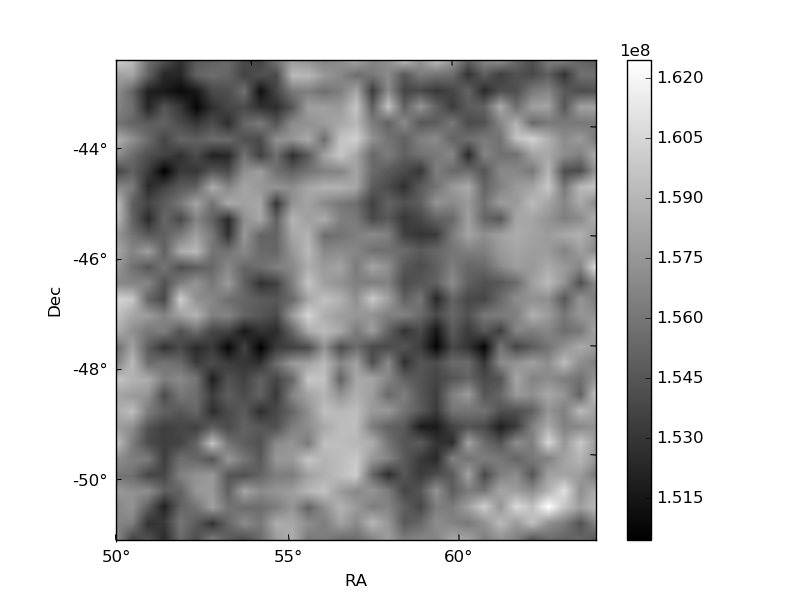
Histogram calculated using DETX and DETY for each event in the final _common_clean file
| Quadrant A | 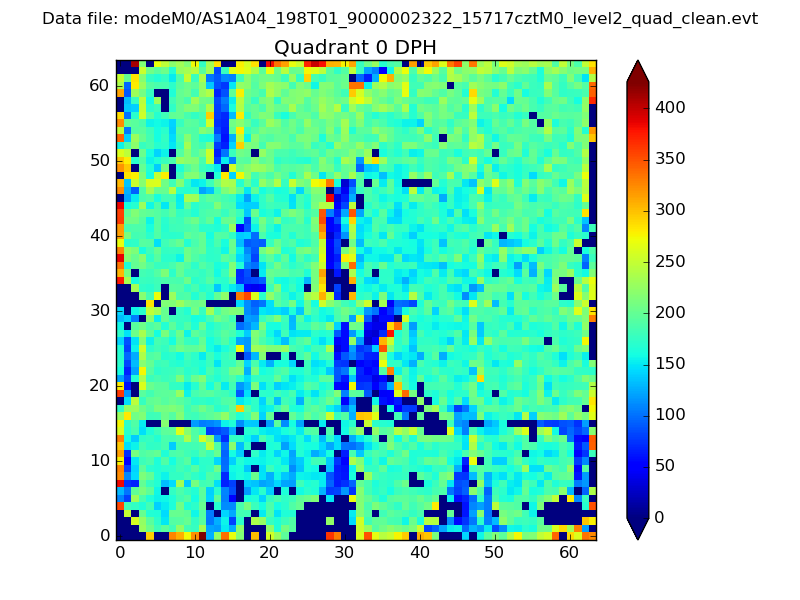 |
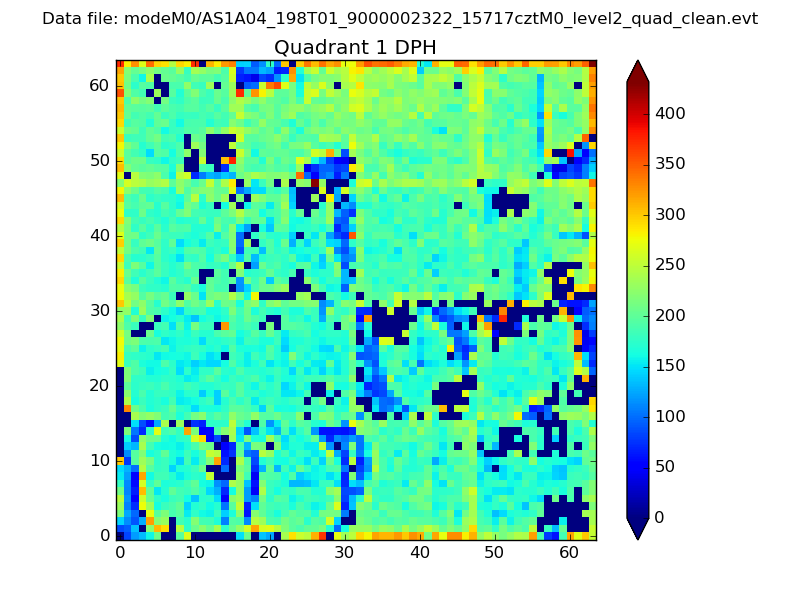 |
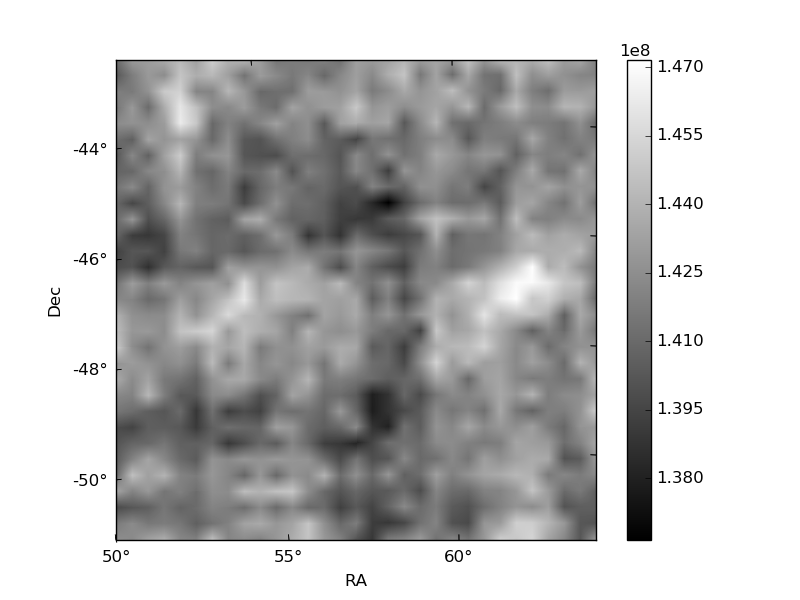
Quadrant B |
|---|---|---|---|
| Quadrant D | 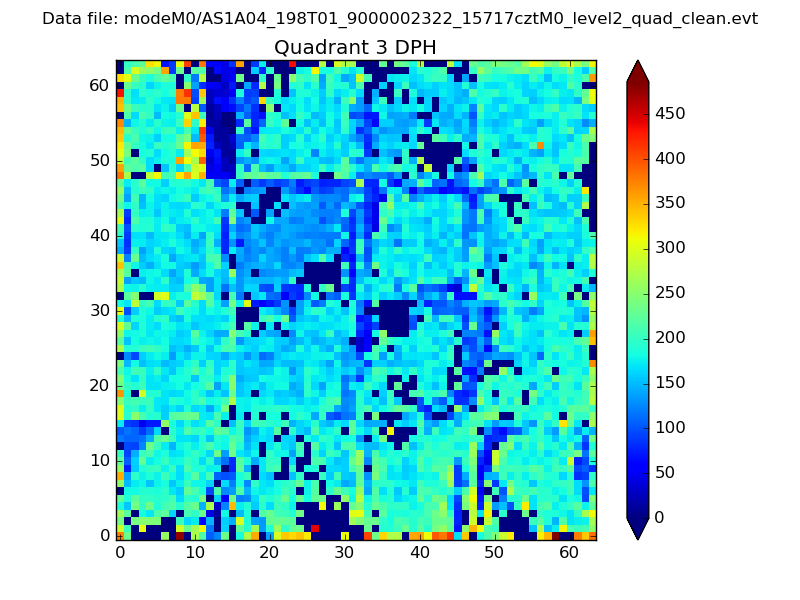 |
 |
Quadrant C |
| Plot type | Count rate plots | Images |
|---|---|---|
| Comparison with Poisson distribution Blue bars denote a histogram of data divided into 1 sec bins. Red curve is a Poisson curve with rate = median count rate of data. |
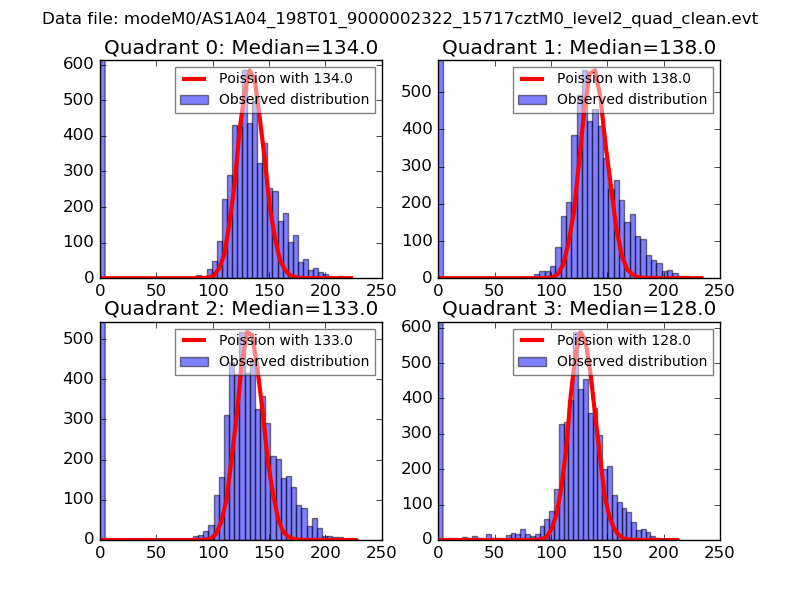 |
 |
| Quadrant-wise count rates Data is divided into 100 sec bins |
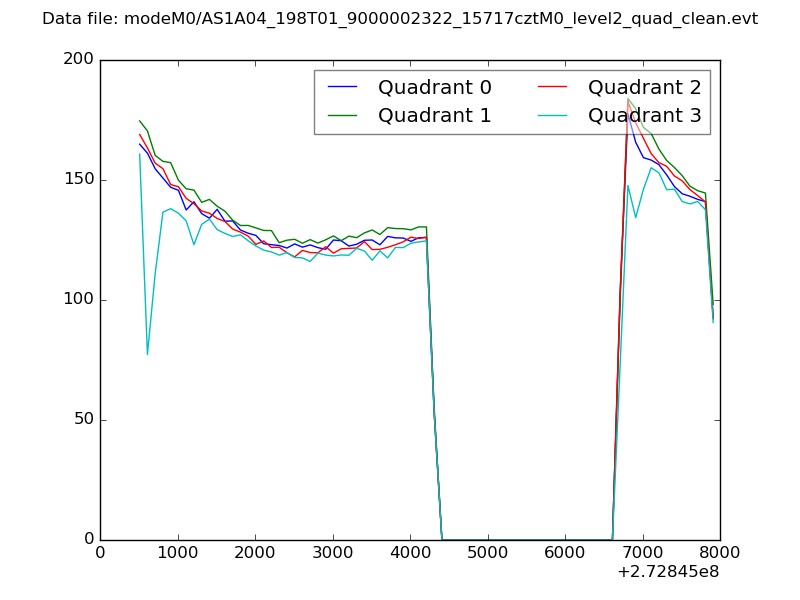 |
|
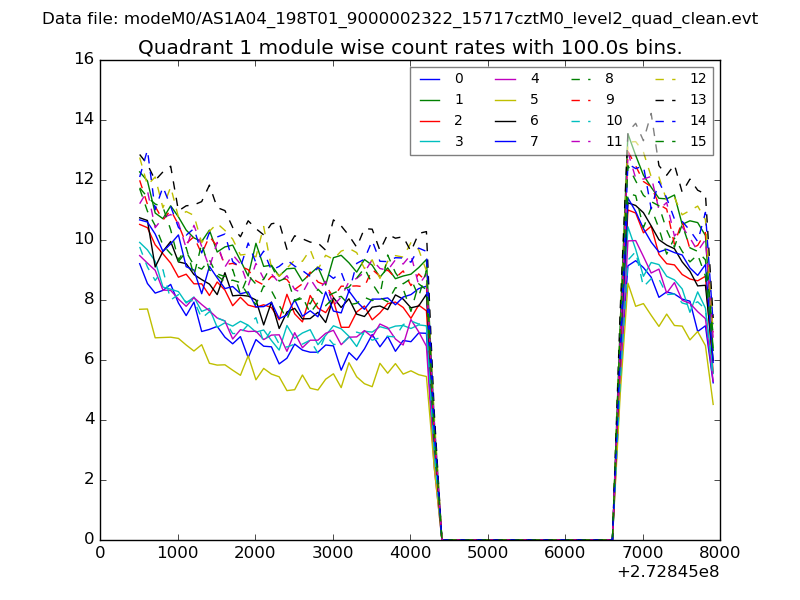
| Module-wise count rates for Quadrant A Data is divided into 100 sec bins |
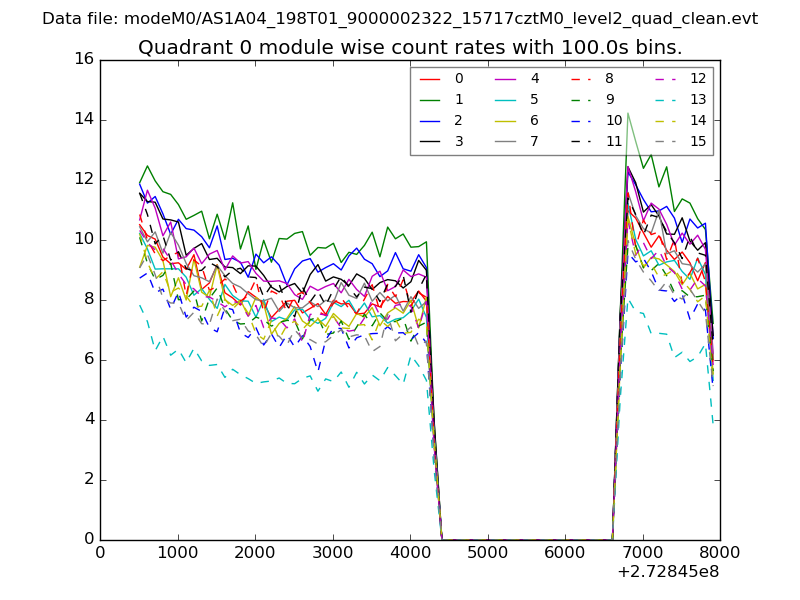 |
 |
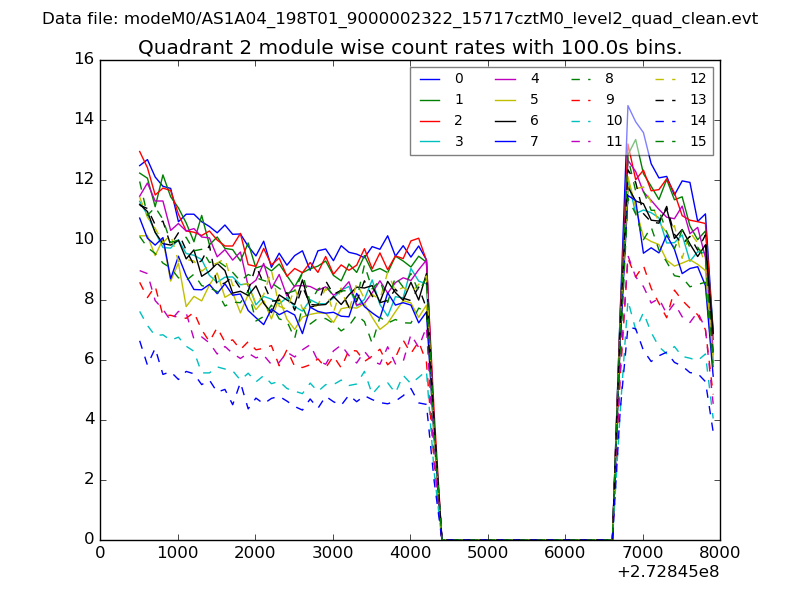
| Module-wise count rates for Quadrant B Data is divided into 100 sec bins |
 |
 |
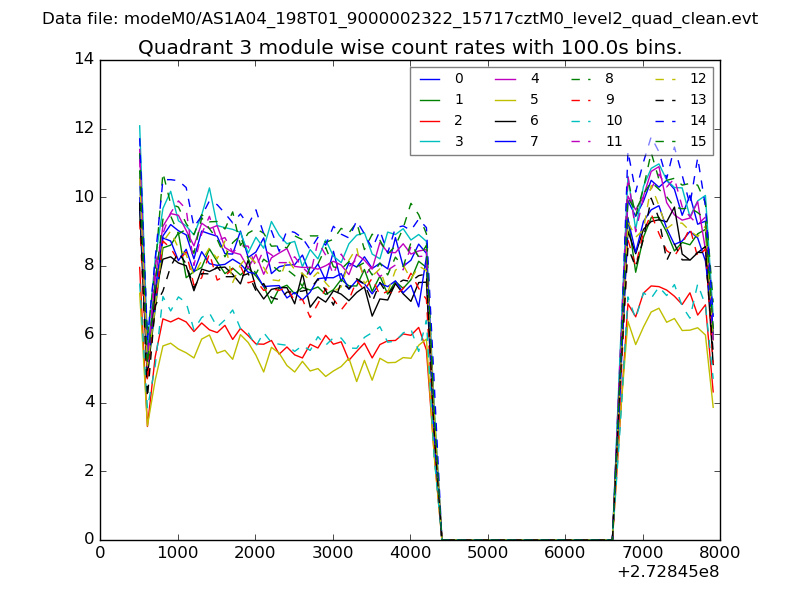
| Module-wise count rates for Quadrant C Data is divided into 100 sec bins |
 |
 |
| Module-wise count rates for Quadrant D Data is divided into 100 sec bins |
 |
 |
| Parameter | Plot |
|---|---|
| CZT HV Monitor | 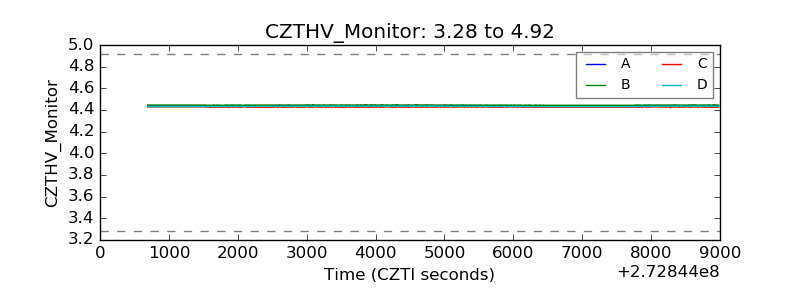 |
| D_VDD |  |
| Temperature 1 | 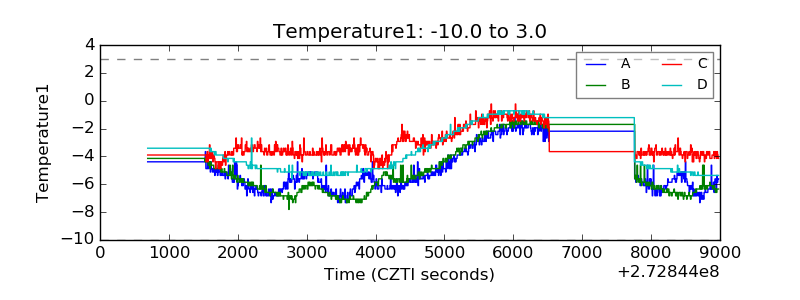 |
| Veto HV Monitor | 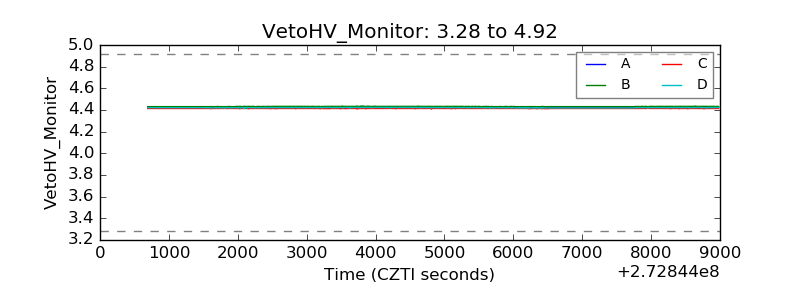 |
| Veto LLD | 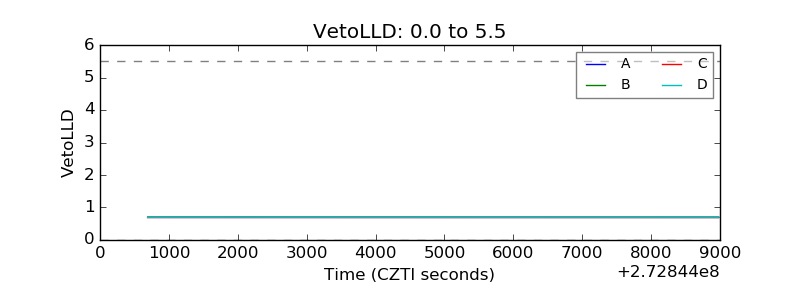 |
| Alpha Counter | 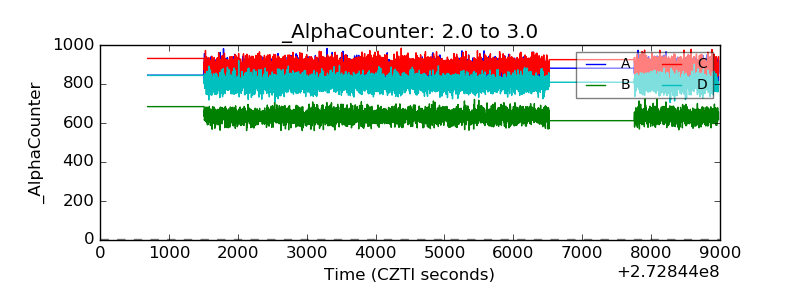 |
| _CPM_Rate | 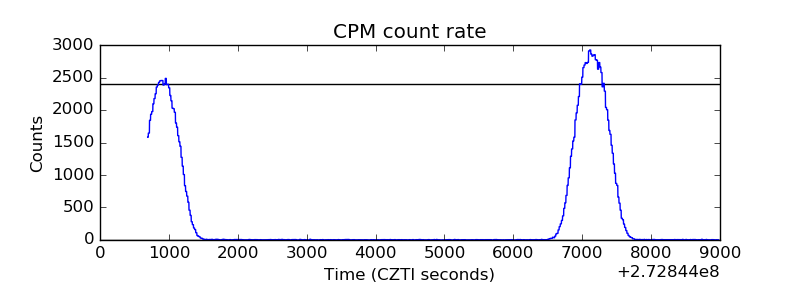 |
| CZT Counter | 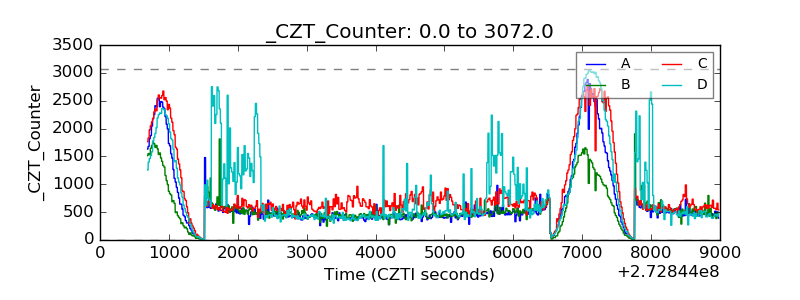 |
| +2.5 Volts monitor |  |
| +5 Volts monitor |  |
| _ROLL_ROT | 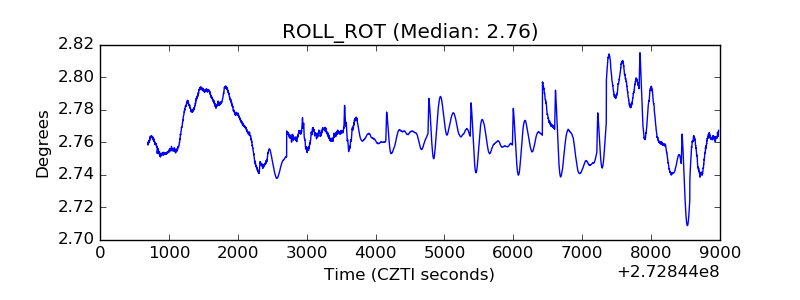 |
| _Roll_DEC | 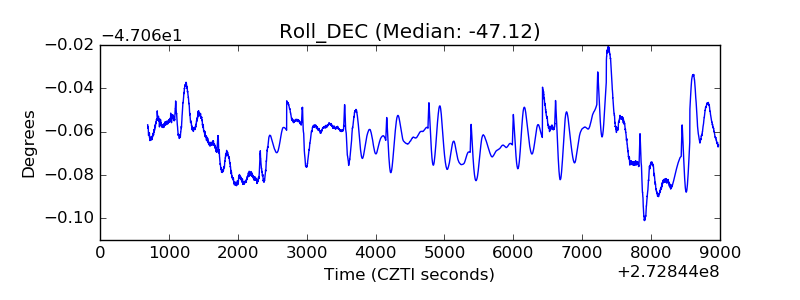 |
| _Roll_RA | 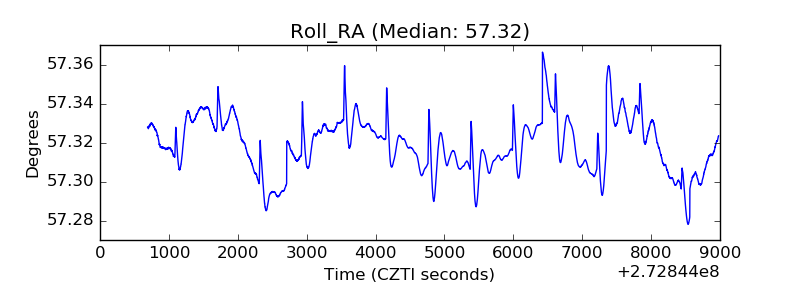 |
| Veto Counter | 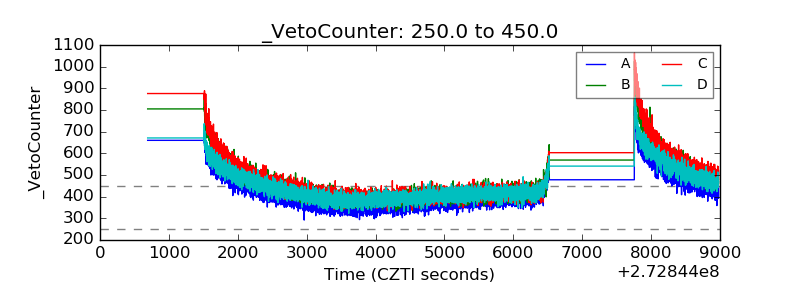 |