| Param | Original file | Final file |
|---|---|---|
| Filename | modeM0/AS1A04_198T01_9000002322_15720cztM0_level2.evt | modeM0/AS1A04_198T01_9000002322_15720cztM0_level2_quad_clean.evt |
| Size (bytes) | 455,345,280 | 88,902,720 |
| Size | 434.3 MB | 84.8 MB |
| Events in quadrant A | 2,838,989 | 567,235 |
| Events in quadrant B | 3,002,180 | 584,040 |
| Events in quadrant C | 3,274,941 | 571,491 |
| Events in quadrant D | 4,268,021 | 551,761 |
| Mode M0 | |||
|---|---|---|---|
| Quadrant | BADHDUFLAG | Total packets | Discarded packets |
| A | 0 | 12238 | 2 |
| B | 0 | 12612 | 1 |
| C | 0 | 13652 | 1 |
| D | 0 | 16792 | 1 |
| Mode SS | |||
|---|---|---|---|
| Quadrant | BADHDUFLAG | Total packets | Discarded packets |
| A | 0 | 122 | 0 |
| B | 0 | 122 | 0 |
| C | 0 | 122 | 0 |
| D | 0 | 122 | 0 |
| Mode M9 | |||
|---|---|---|---|
| Quadrant | BADHDUFLAG | Total packets | Discarded packets |
| A | 0 | 13 | 0 |
| B | 0 | 13 | 0 |
| C | 0 | 13 | 0 |
| D | 0 | 13 | 0 |
| Quadrant | Total seconds | Saturated seconds | Saturation percentage |
|---|---|---|---|
| A | 5979 | 16 | 0.267603% |
| B | 5979 | 35 | 0.585382% |
| C | 5979 | 61 | 1.020237% |
| D | 5979 | 152 | 2.542231% |
Noise dominated data is calculated using 1-second bins in cleaned event files. If a bin has >2000 counts, and if more than 50% of those come from <1% of pixels, then it is considered to be noise-dominated and hence unusable.
| Quadrant | # 1 sec bins | Bins with >0 counts | Bins with >2000 counts | High rate bins dominated by noise | Noise dominated (total time) | Noise dominated (detector-on time) | Marked lightcurve |
|---|---|---|---|---|---|---|---|
| A | 7280 | 5981 | 1 | 1 | 0.01% | 0.02% | 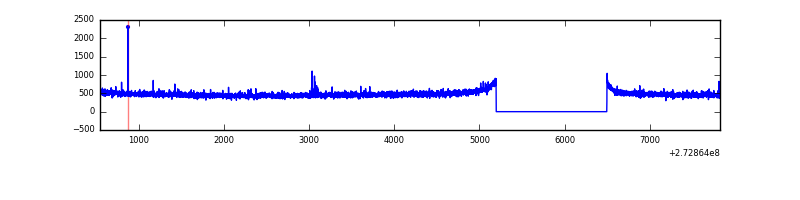 |
| B | 7280 | 5981 | 9 | 9 | 0.12% | 0.15% | 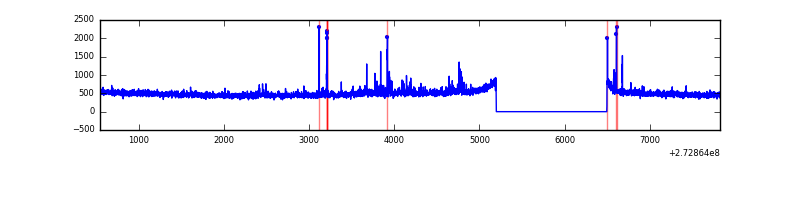 |
| C | 7280 | 5981 | 0 | 0 | 0.00% | 0.00% | 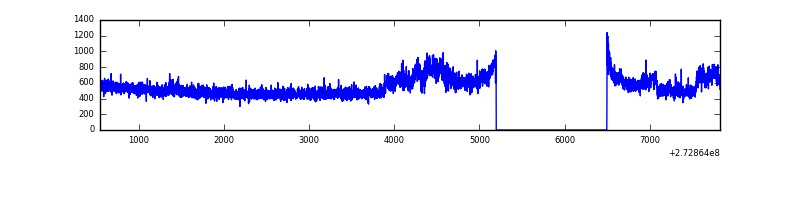 |
| D | 7280 | 5981 | 108 | 108 | 1.48% | 1.81% | 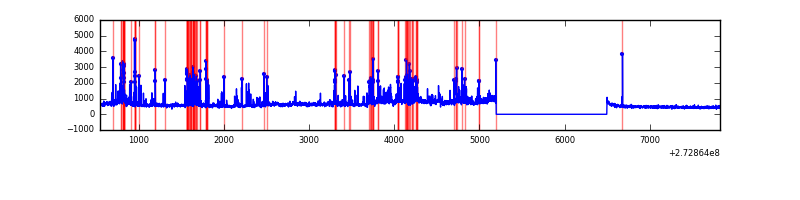 |
Top three noisy pixels from each quadrant. If the there are fewer than three noisy pixels in the level2.evt file, extra rows are filled as -1
| Pixel properties | Quadrant properties | ||||||
|---|---|---|---|---|---|---|---|
| Quadrant | DetID | PixID | Counts | Sigma | Mean | Median | Sigma |
| A | 9 | 143 | 15632 | 100.96 | 734 | 720 | 147.7 |
| A | 0 | 226 | 6602 | 39.82 | 734 | 720 | 147.7 |
| A | 12 | 194 | 5471 | 32.17 | 734 | 720 | 147.7 |
| B | 5 | 236 | 42381 | 300.11 | 737 | 719 | 138.8 |
| B | 4 | 173 | 37652 | 266.04 | 737 | 719 | 138.8 |
| B | 0 | 189 | 16268 | 112.0 | 737 | 719 | 138.8 |
| C | 3 | 233 | 313767 | 1843.2 | 728 | 733 | 169.8 |
| C | 14 | 238 | 111792 | 653.93 | 728 | 733 | 169.8 |
| C | 10 | 187 | 6587 | 34.47 | 728 | 733 | 169.8 |
| D | 12 | 144 | 774761 | 4425.5 | 725 | 707 | 174.9 |
| D | 1 | 52 | 419793 | 2396.04 | 725 | 707 | 174.9 |
| D | 10 | 70 | 237002 | 1350.97 | 725 | 707 | 174.9 |
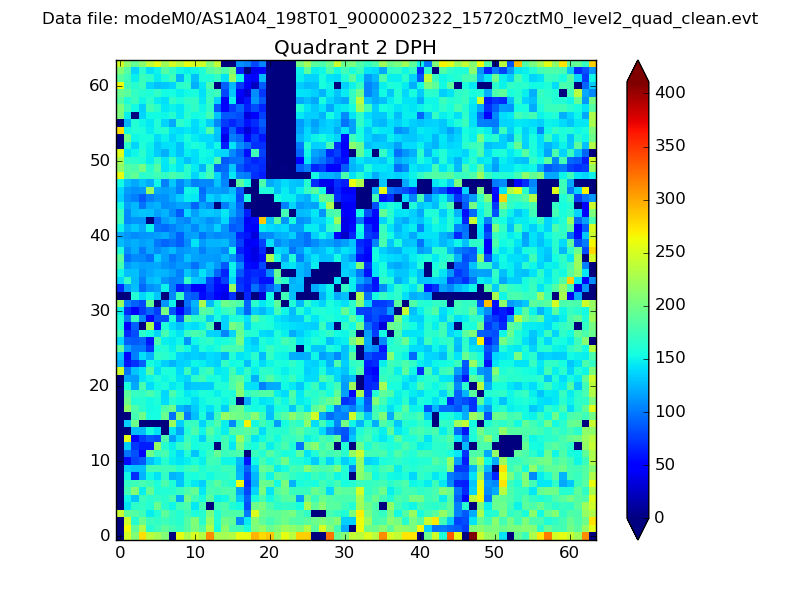
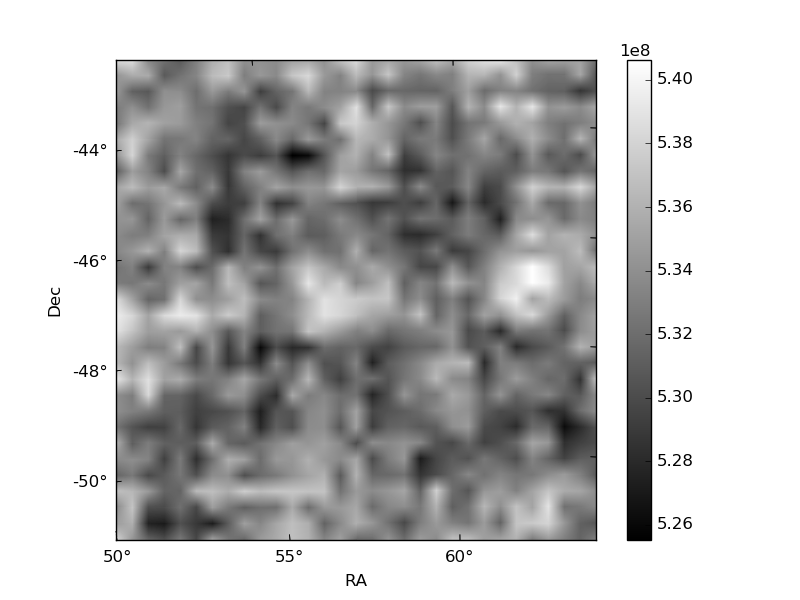
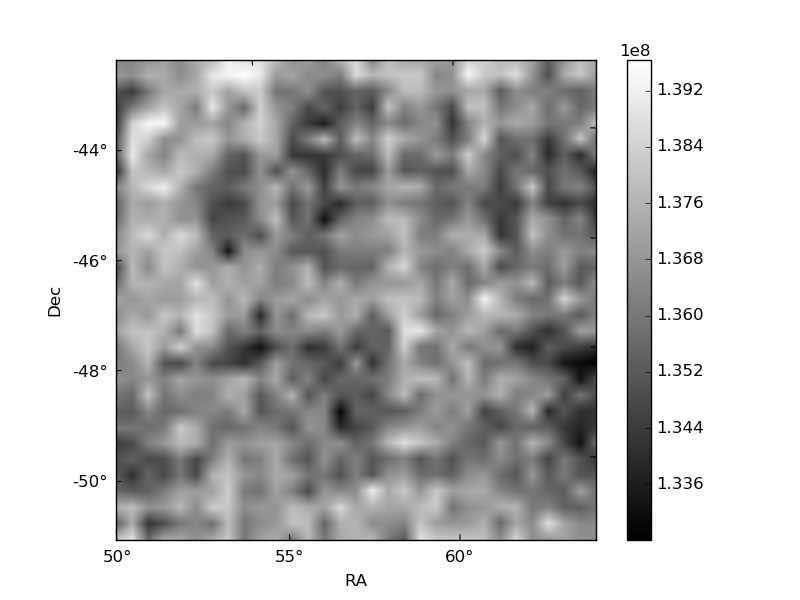
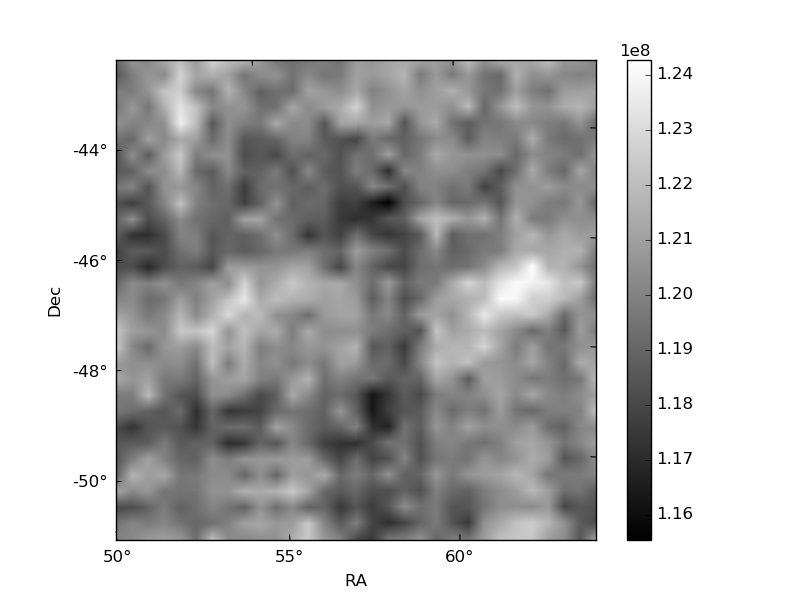
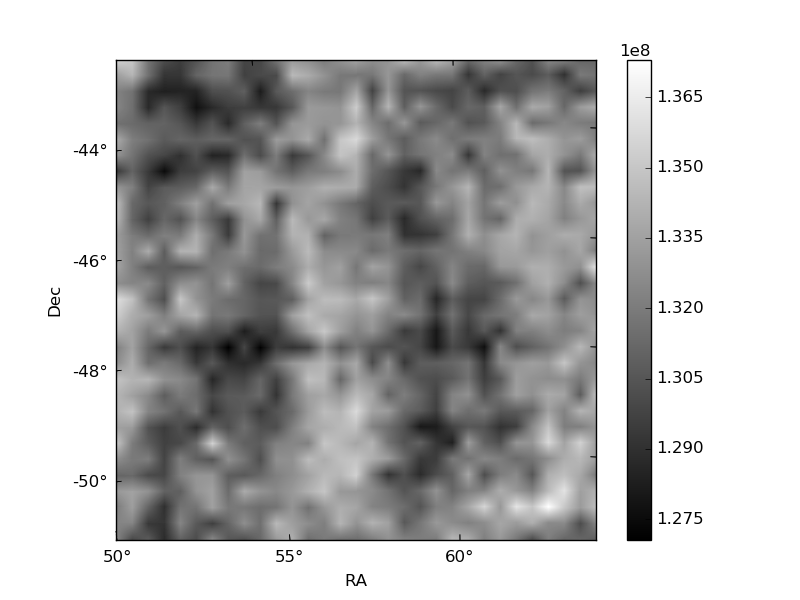
Histogram calculated using DETX and DETY for each event in the final _common_clean file
| Quadrant A | 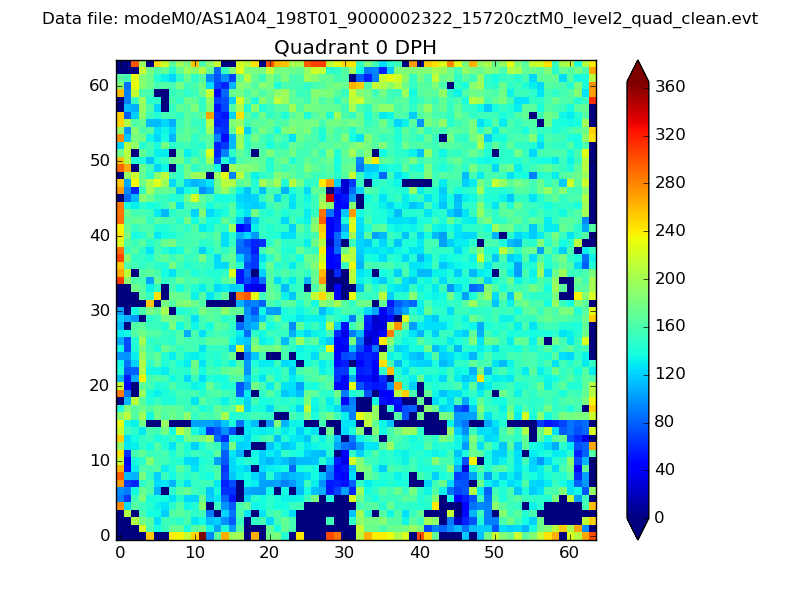 |
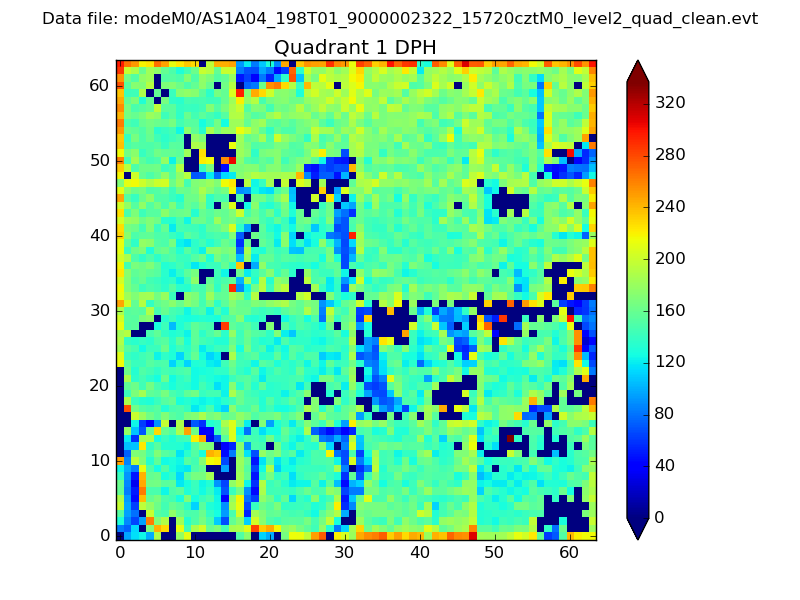 |
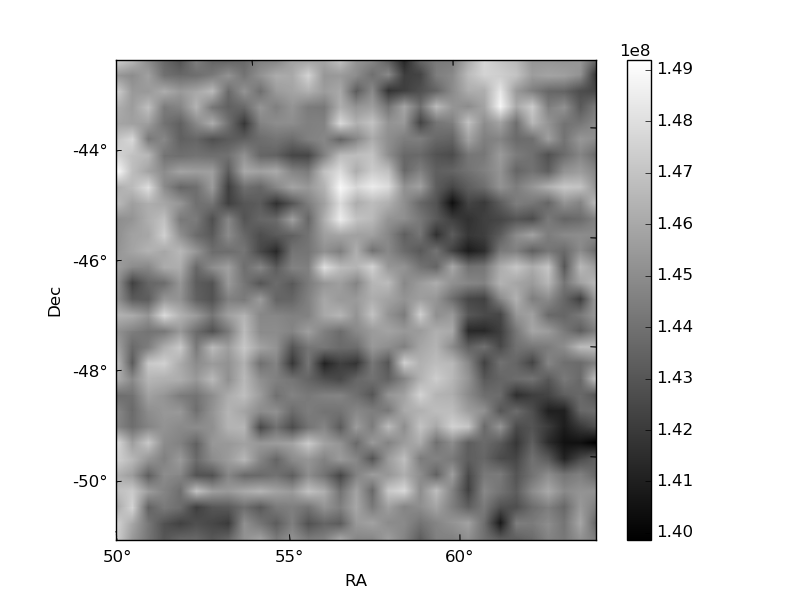
Quadrant B |
|---|---|---|---|
| Quadrant D | 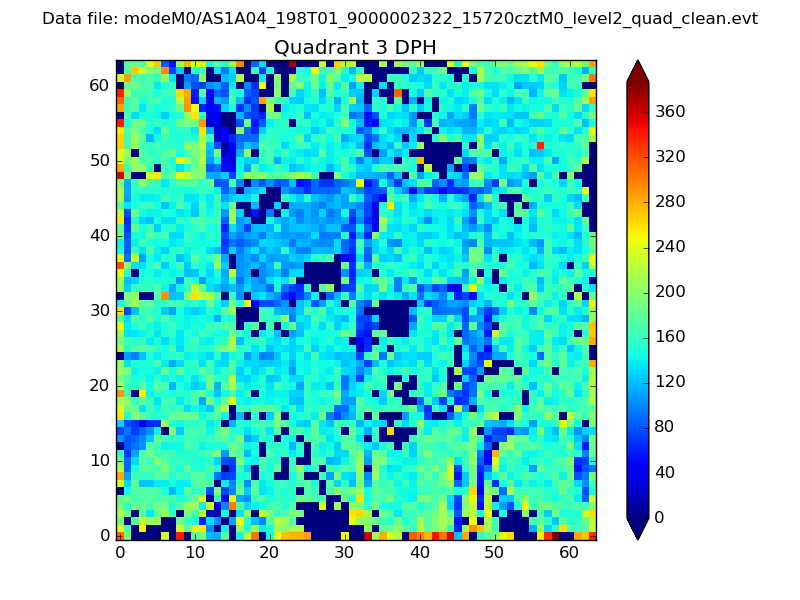 |
 |
Quadrant C |
| Plot type | Count rate plots | Images |
|---|---|---|
| Comparison with Poisson distribution Blue bars denote a histogram of data divided into 1 sec bins. Red curve is a Poisson curve with rate = median count rate of data. |
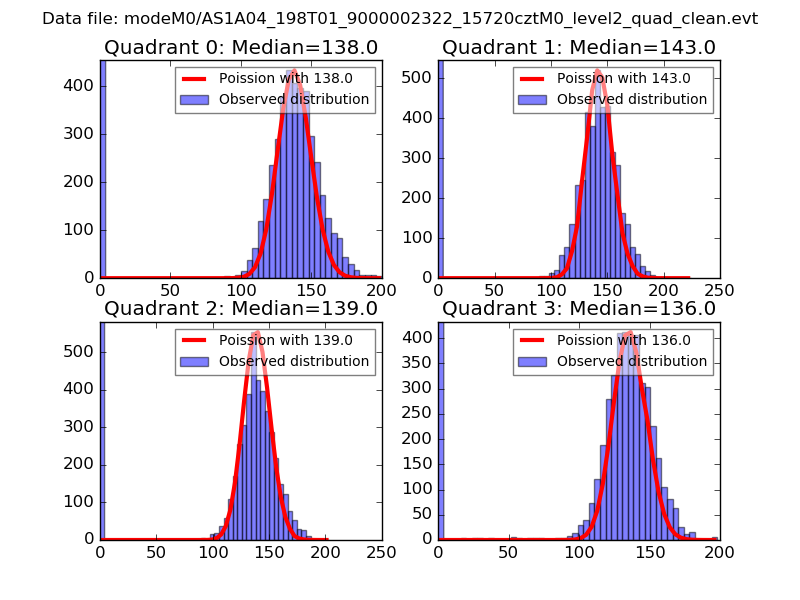 |
 |
| Quadrant-wise count rates Data is divided into 100 sec bins |
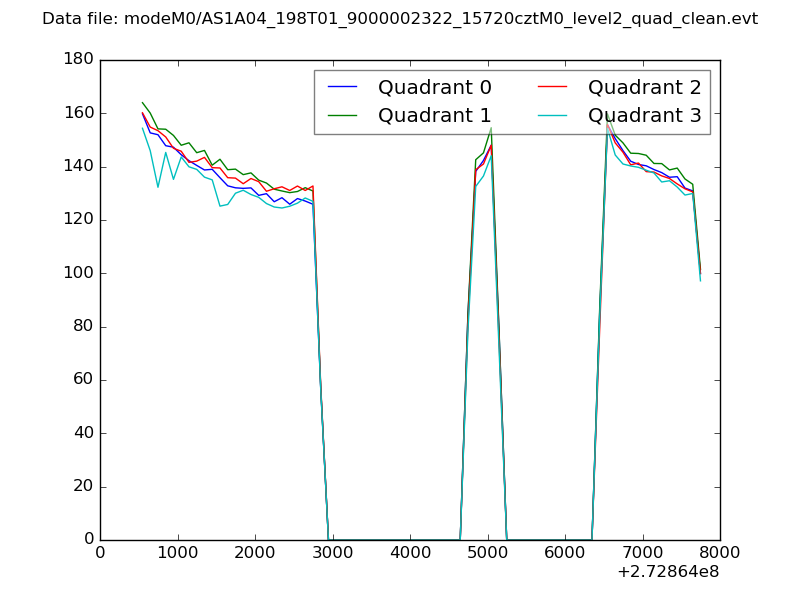 |
|
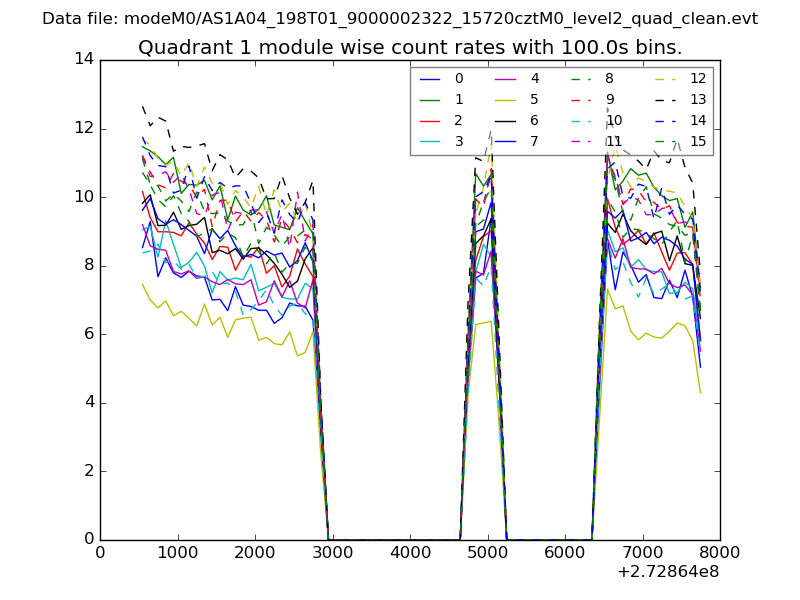
| Module-wise count rates for Quadrant A Data is divided into 100 sec bins |
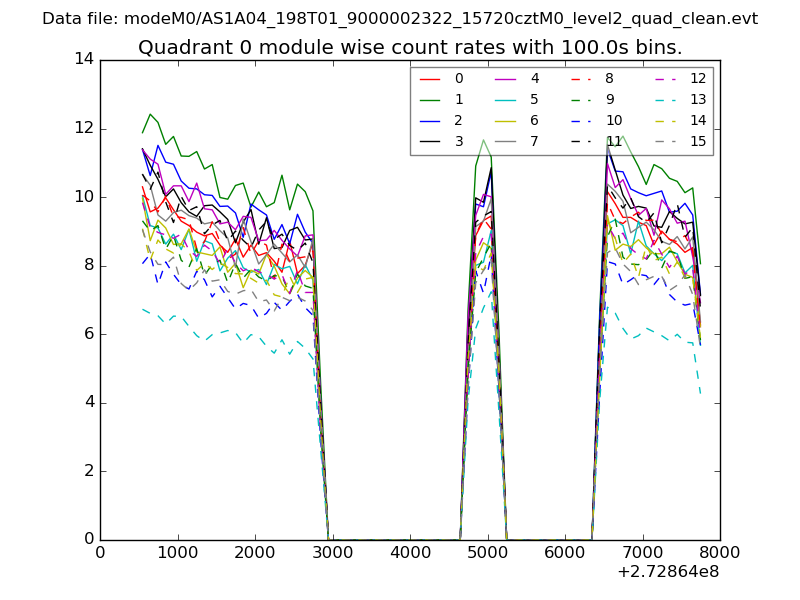 |
 |
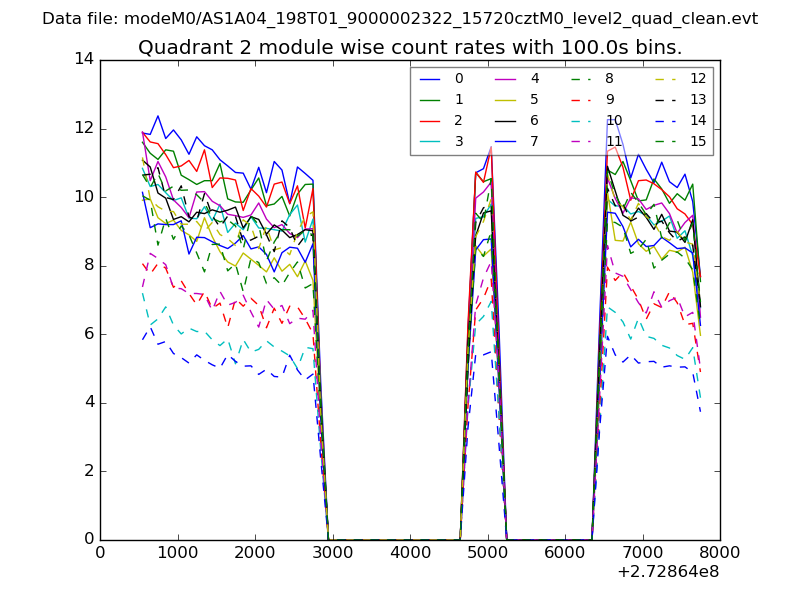
| Module-wise count rates for Quadrant B Data is divided into 100 sec bins |
 |
 |
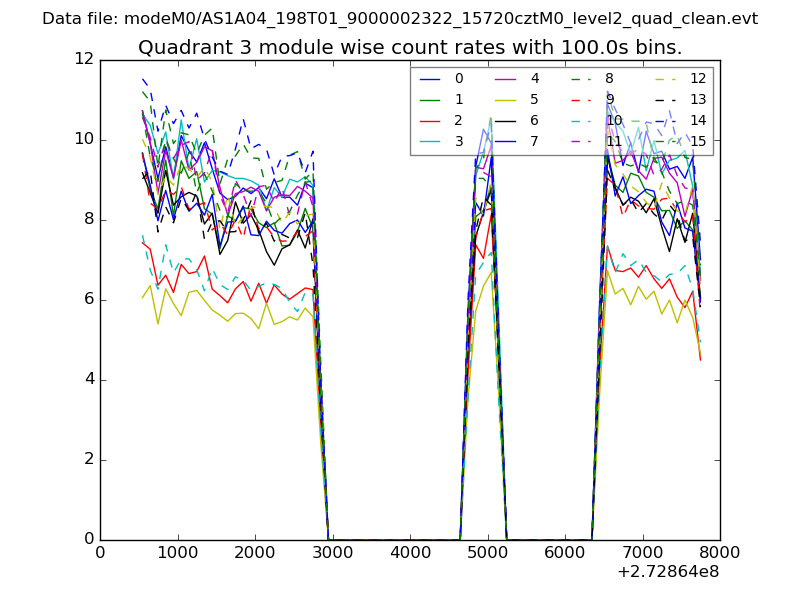
| Module-wise count rates for Quadrant C Data is divided into 100 sec bins |
 |
 |
| Module-wise count rates for Quadrant D Data is divided into 100 sec bins |
 |
 |
| Parameter | Plot |
|---|---|
| CZT HV Monitor | 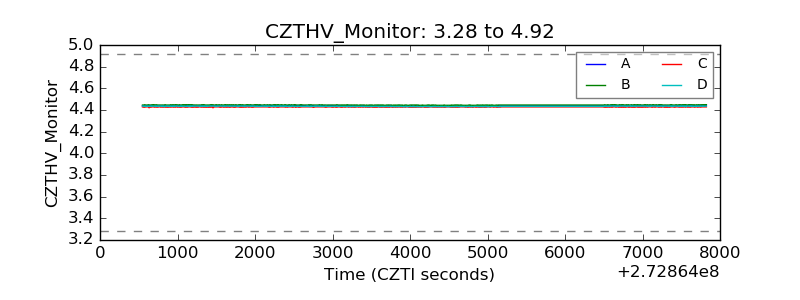 |
| D_VDD | 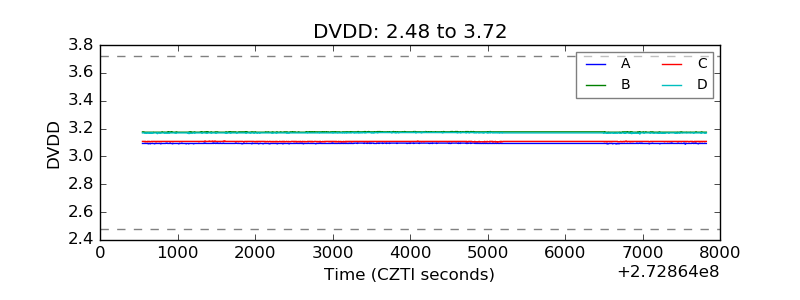 |
| Temperature 1 | 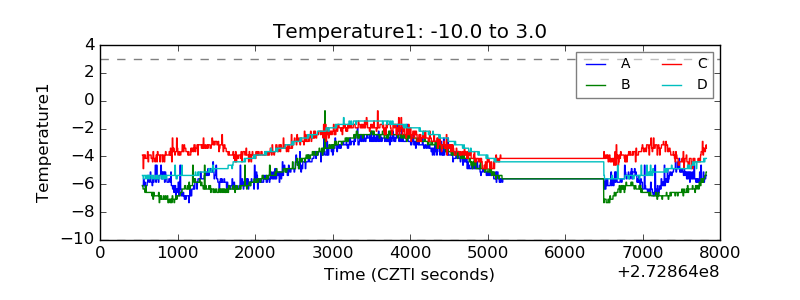 |
| Veto HV Monitor | 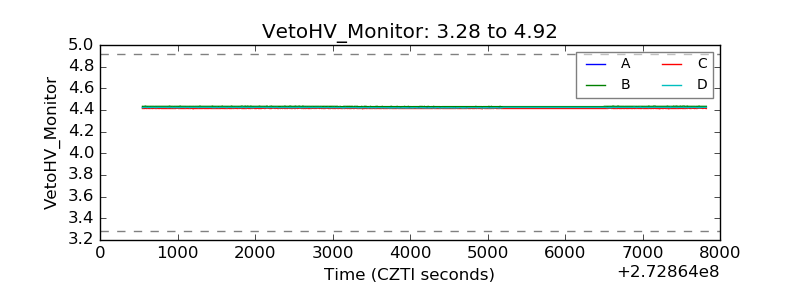 |
| Veto LLD | 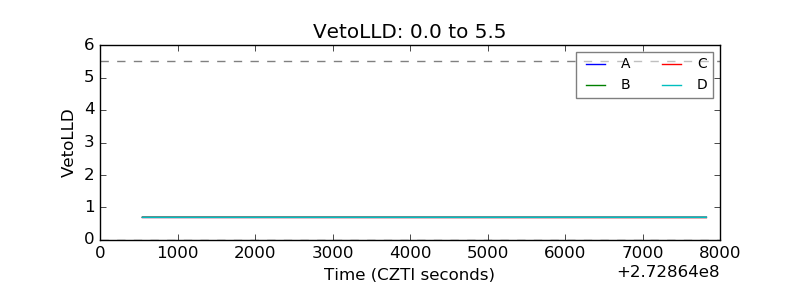 |
| Alpha Counter | 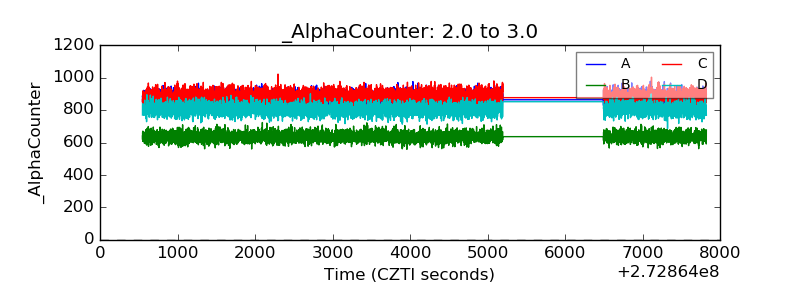 |
| _CPM_Rate | 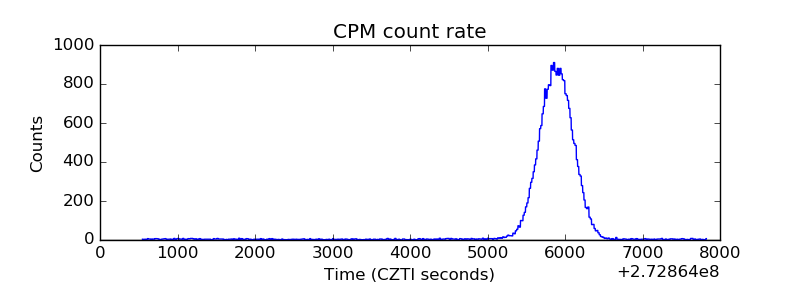 |
| CZT Counter | 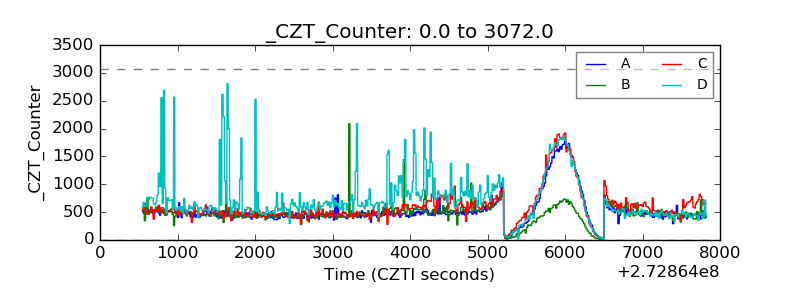 |
| +2.5 Volts monitor |  |
| +5 Volts monitor |  |
| _ROLL_ROT | 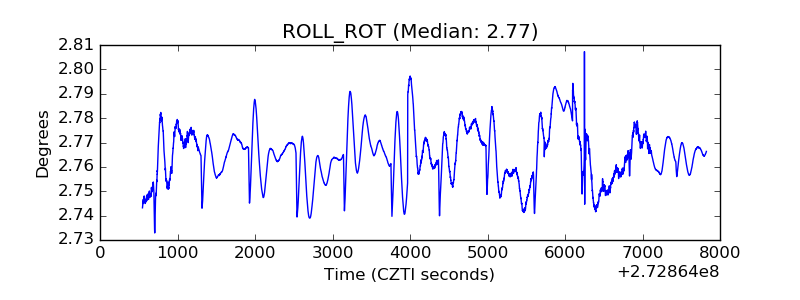 |
| _Roll_DEC |  |
| _Roll_RA | 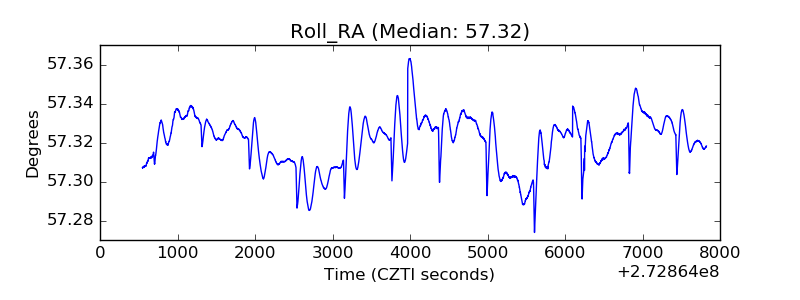 |
| Veto Counter | 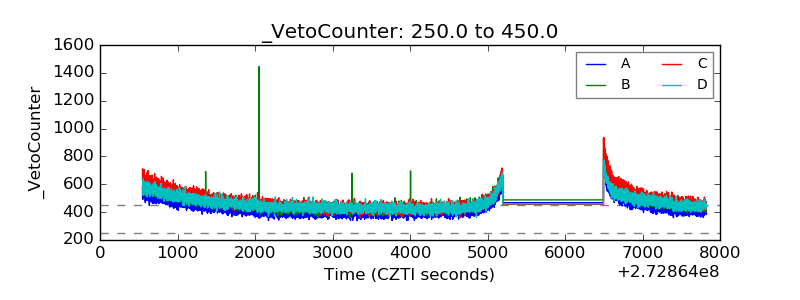 |