| Param | Original file | Final file |
|---|---|---|
| Filename | modeM0/AS1A04_198T01_9000002322_15721cztM0_level2.evt | modeM0/AS1A04_198T01_9000002322_15721cztM0_level2_quad_clean.evt |
| Size (bytes) | 410,561,280 | 84,856,320 |
| Size | 391.5 MB | 80.9 MB |
| Events in quadrant A | 2,843,543 | 537,361 |
| Events in quadrant B | 2,974,136 | 551,183 |
| Events in quadrant C | 3,311,920 | 533,497 |
| Events in quadrant D | 2,896,488 | 529,021 |
| Mode M0 | |||
|---|---|---|---|
| Quadrant | BADHDUFLAG | Total packets | Discarded packets |
| A | 0 | 12369 | 2 |
| B | 0 | 12675 | 1 |
| C | 0 | 14032 | 1 |
| D | 0 | 12667 | 1 |
| Mode SS | |||
|---|---|---|---|
| Quadrant | BADHDUFLAG | Total packets | Discarded packets |
| A | 0 | 122 | 0 |
| B | 0 | 122 | 0 |
| C | 0 | 122 | 0 |
| D | 0 | 122 | 0 |
| Mode M9 | |||
|---|---|---|---|
| Quadrant | BADHDUFLAG | Total packets | Discarded packets |
| A | 0 | 10 | 0 |
| B | 0 | 10 | 0 |
| C | 0 | 10 | 0 |
| D | 0 | 10 | 0 |
| Quadrant | Total seconds | Saturated seconds | Saturation percentage |
|---|---|---|---|
| A | 5994 | 68 | 1.134468% |
| B | 5994 | 98 | 1.634968% |
| C | 5994 | 133 | 2.218886% |
| D | 5994 | 72 | 1.201201% |
Noise dominated data is calculated using 1-second bins in cleaned event files. If a bin has >2000 counts, and if more than 50% of those come from <1% of pixels, then it is considered to be noise-dominated and hence unusable.
| Quadrant | # 1 sec bins | Bins with >0 counts | Bins with >2000 counts | High rate bins dominated by noise | Noise dominated (total time) | Noise dominated (detector-on time) | Marked lightcurve |
|---|---|---|---|---|---|---|---|
| A | 7020 | 5996 | 0 | 0 | 0.00% | 0.00% | 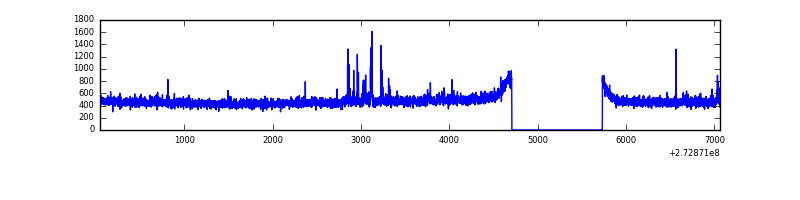 |
| B | 7020 | 5996 | 6 | 6 | 0.09% | 0.10% | 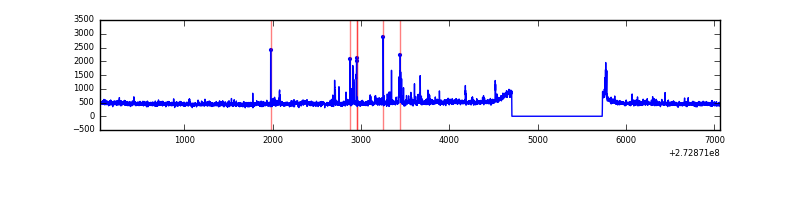 |
| C | 7020 | 5996 | 0 | 0 | 0.00% | 0.00% | 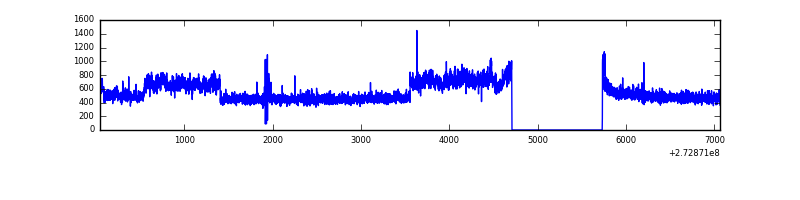 |
| D | 7020 | 5996 | 2 | 2 | 0.03% | 0.03% | 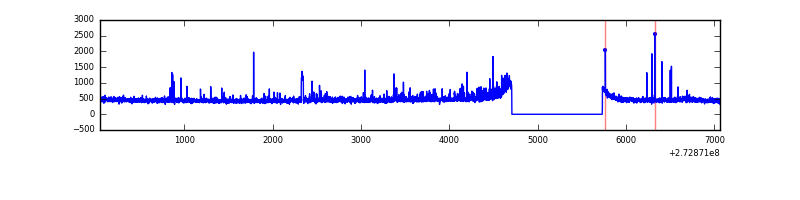 |
Top three noisy pixels from each quadrant. If the there are fewer than three noisy pixels in the level2.evt file, extra rows are filled as -1
| Pixel properties | Quadrant properties | ||||||
|---|---|---|---|---|---|---|---|
| Quadrant | DetID | PixID | Counts | Sigma | Mean | Median | Sigma |
| A | 13 | 248 | 41769 | 279.43 | 725 | 708 | 146.9 |
| A | 15 | 157 | 10832 | 68.9 | 725 | 708 | 146.9 |
| A | 0 | 226 | 6572 | 39.91 | 725 | 708 | 146.9 |
| B | 0 | 228 | 30865 | 221.71 | 720 | 701 | 136.1 |
| B | 4 | 173 | 28424 | 203.77 | 720 | 701 | 136.1 |
| B | 5 | 236 | 28307 | 202.91 | 720 | 701 | 136.1 |
| C | 3 | 233 | 414848 | 2504.67 | 708 | 713 | 165.3 |
| C | 14 | 238 | 116938 | 702.92 | 708 | 713 | 165.3 |
| C | 10 | 187 | 8002 | 44.08 | 708 | 713 | 165.3 |
| D | 12 | 110 | 80663 | 440.17 | 717 | 698 | 181.7 |
| D | 1 | 52 | 58262 | 316.86 | 717 | 698 | 181.7 |
| D | 2 | 234 | 21340 | 113.62 | 717 | 698 | 181.7 |
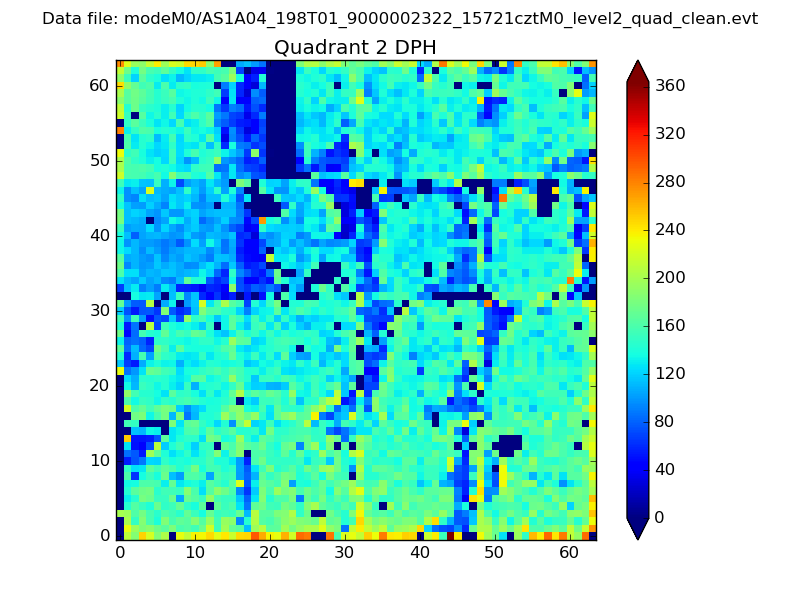
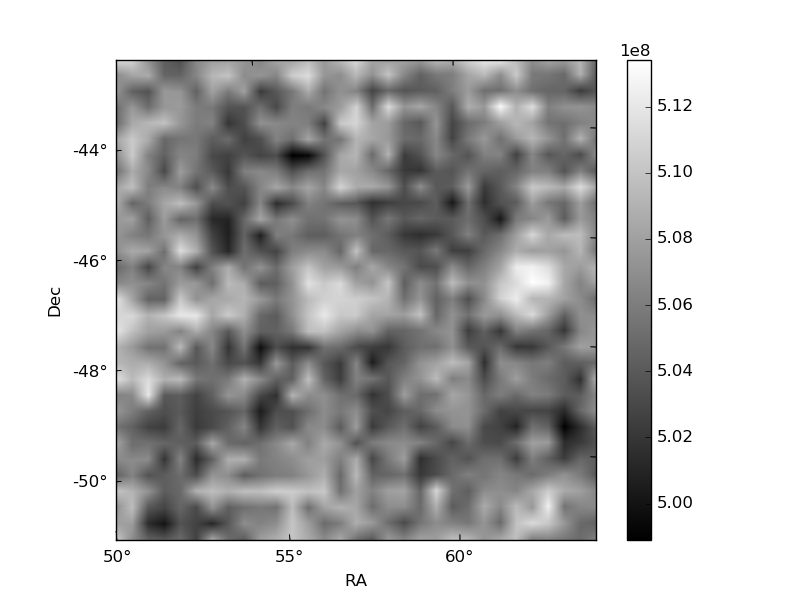
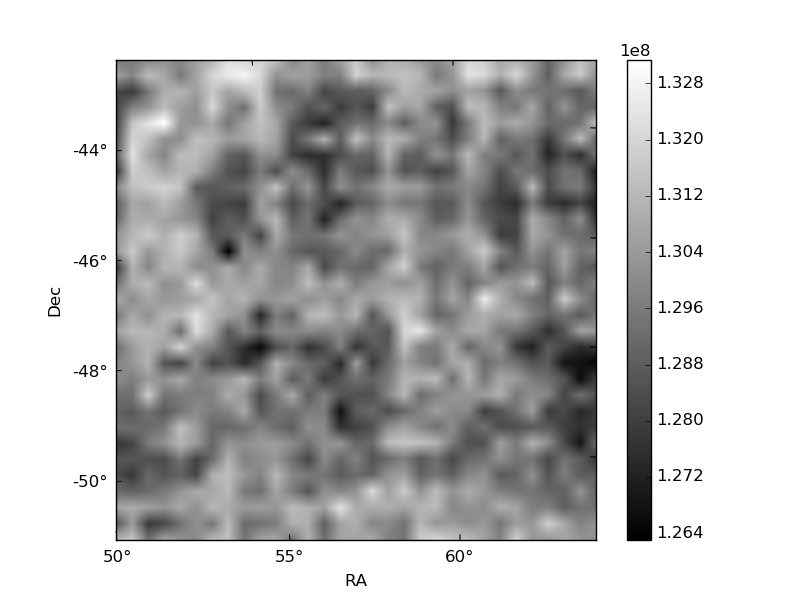
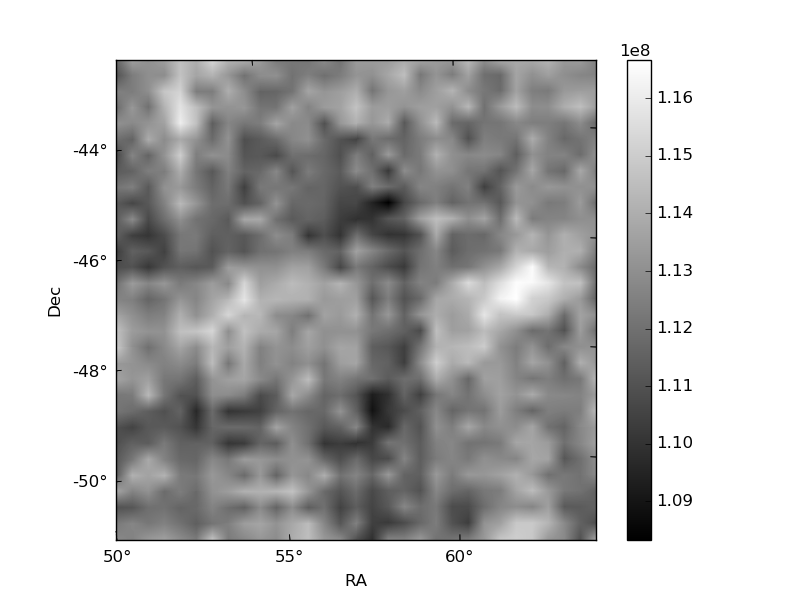
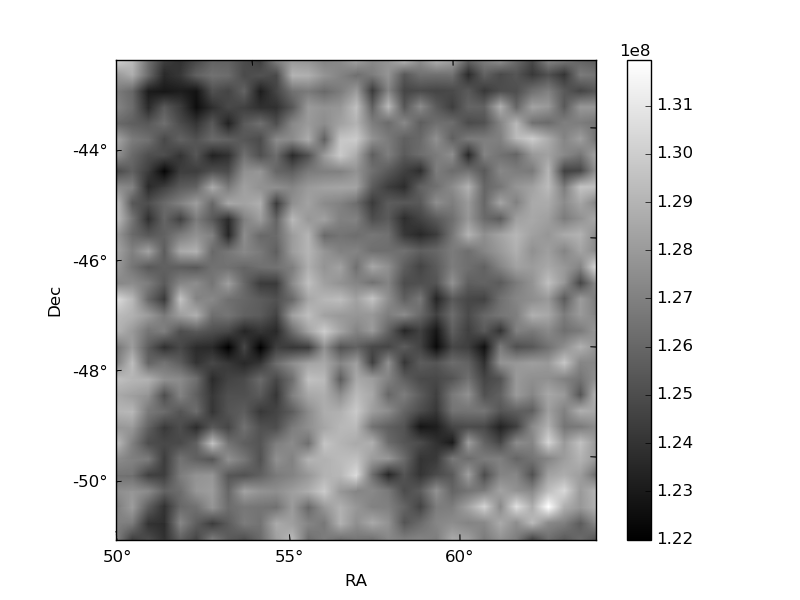
Histogram calculated using DETX and DETY for each event in the final _common_clean file
| Quadrant A | 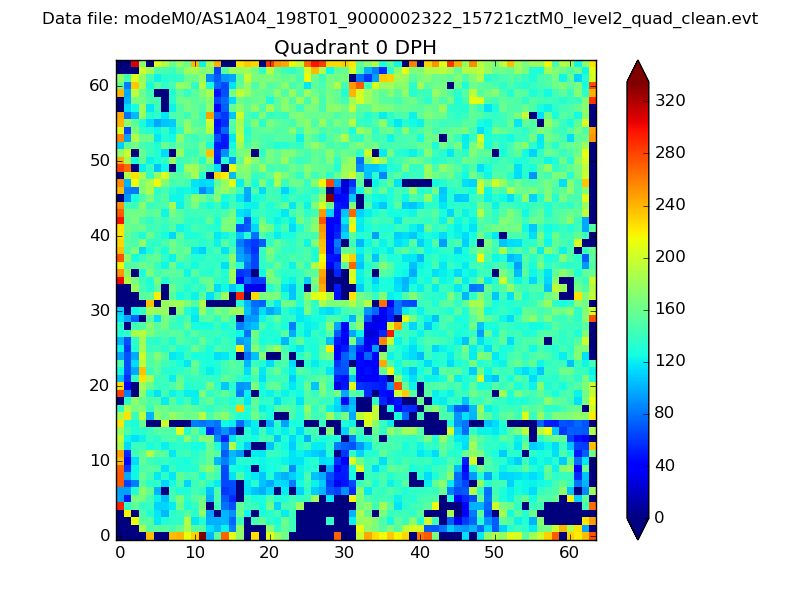 |
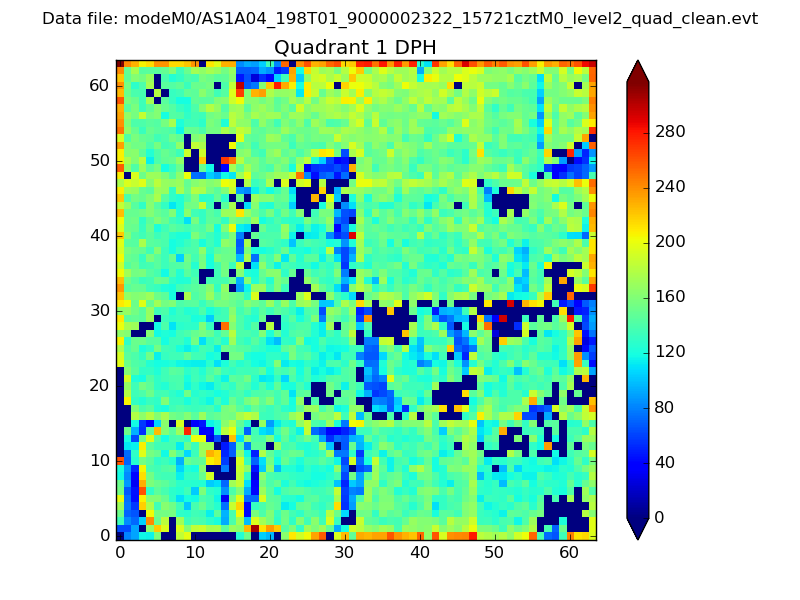 |
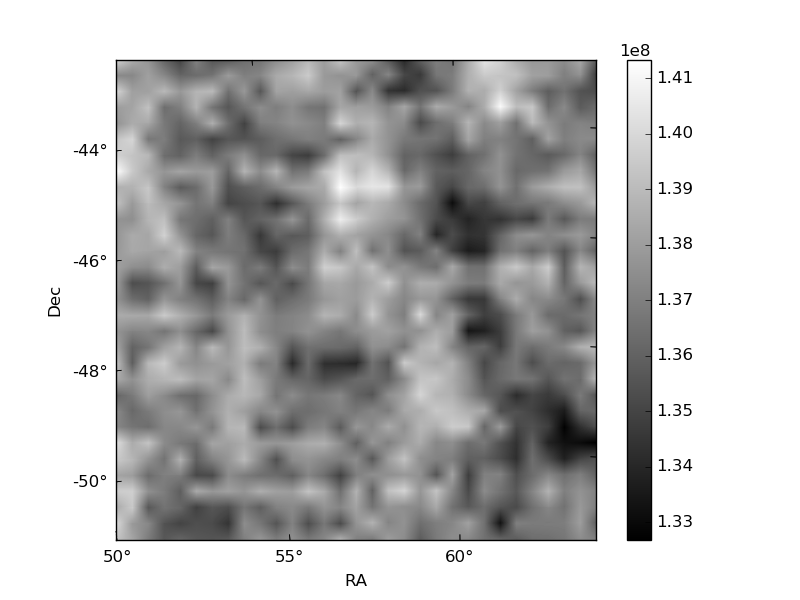
Quadrant B |
|---|---|---|---|
| Quadrant D | 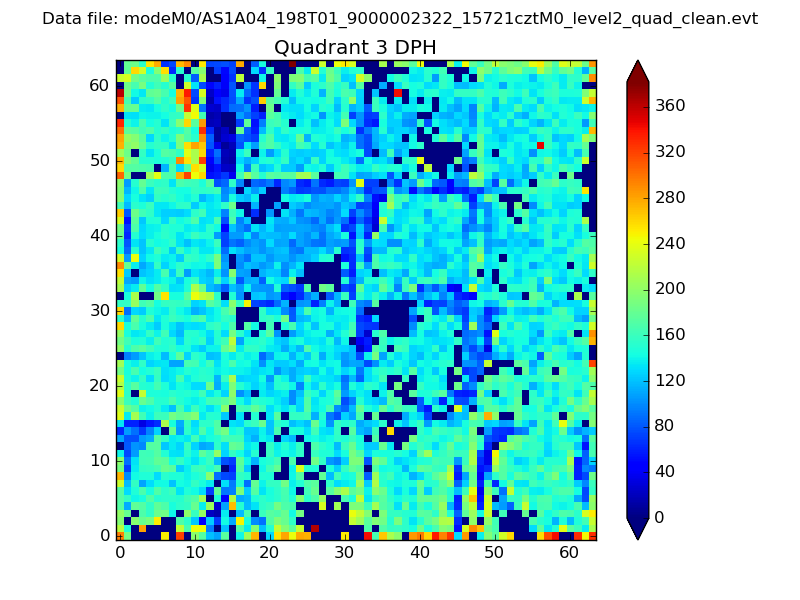 |
 |
Quadrant C |
| Plot type | Count rate plots | Images |
|---|---|---|
| Comparison with Poisson distribution Blue bars denote a histogram of data divided into 1 sec bins. Red curve is a Poisson curve with rate = median count rate of data. |
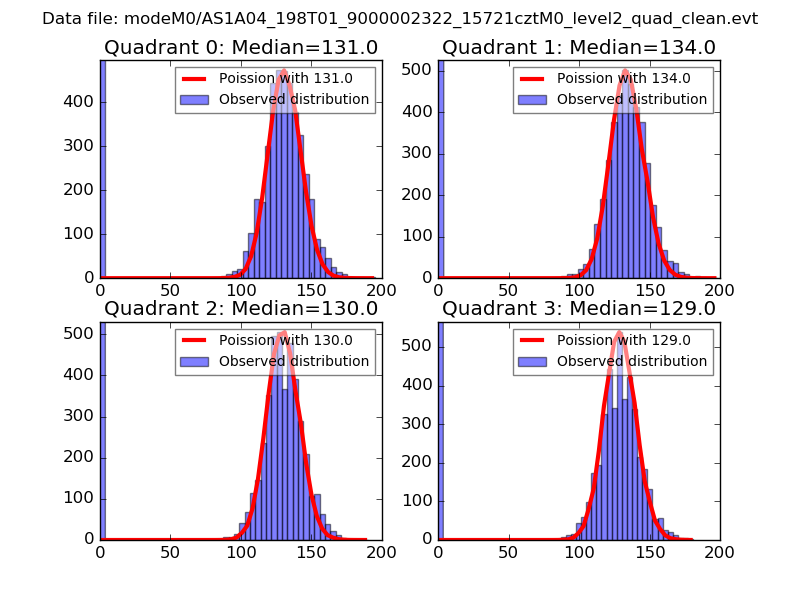 |
 |
| Quadrant-wise count rates Data is divided into 100 sec bins |
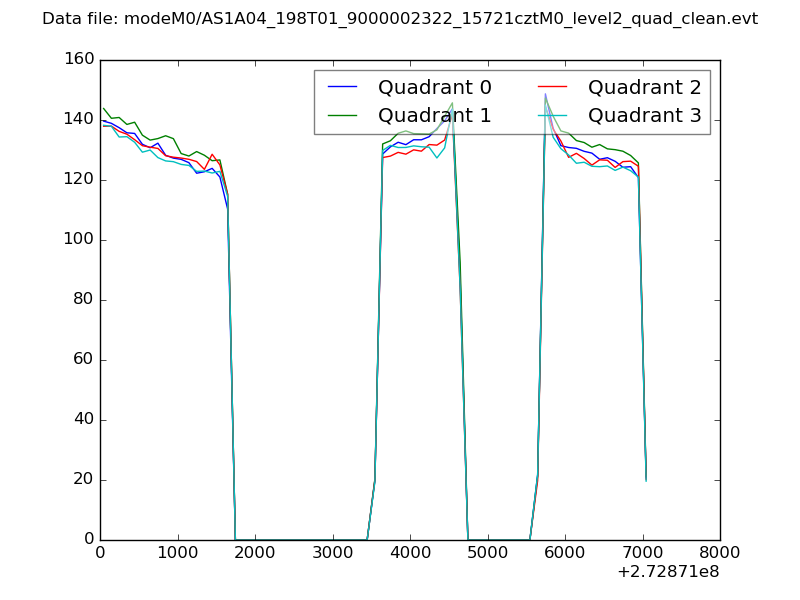 |
|
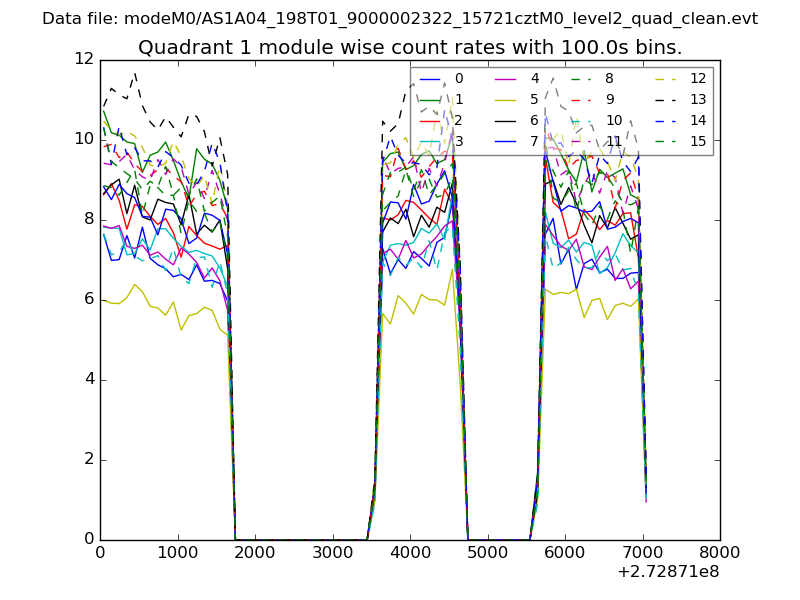
| Module-wise count rates for Quadrant A Data is divided into 100 sec bins |
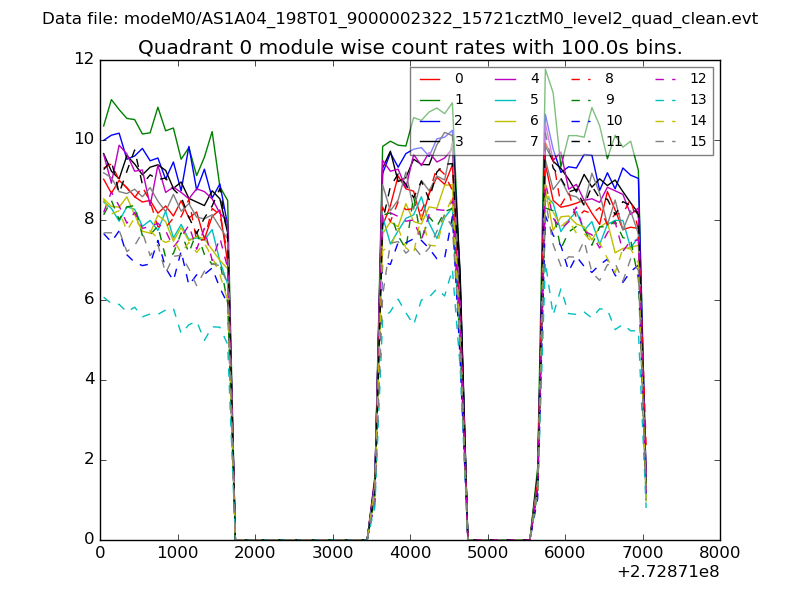 |
 |
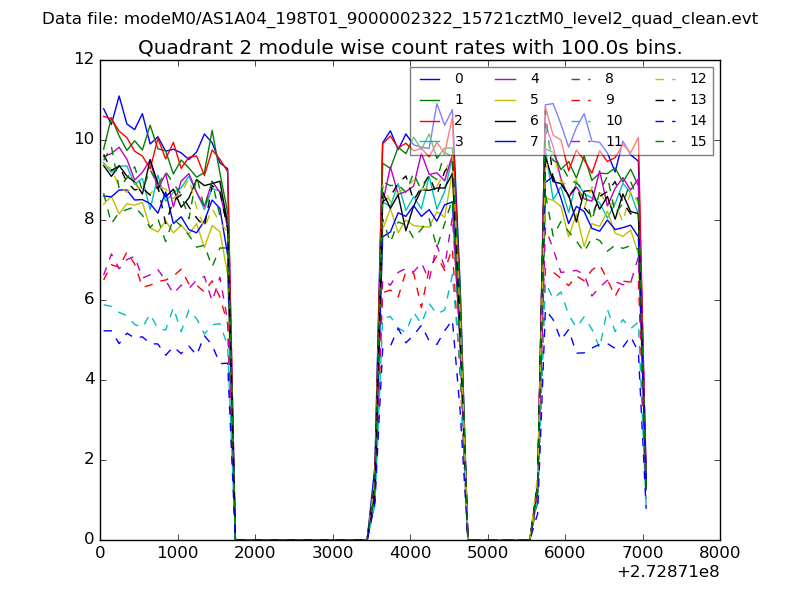
| Module-wise count rates for Quadrant B Data is divided into 100 sec bins |
 |
 |
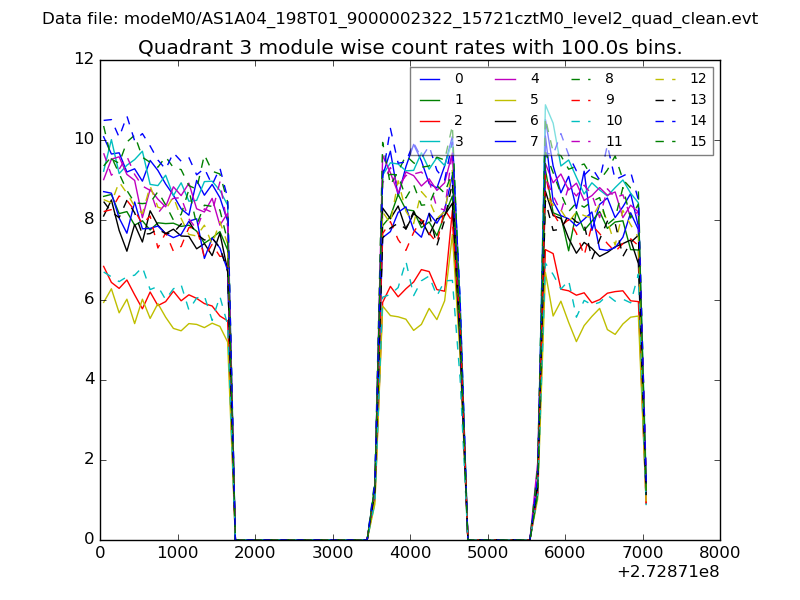
| Module-wise count rates for Quadrant C Data is divided into 100 sec bins |
 |
 |
| Module-wise count rates for Quadrant D Data is divided into 100 sec bins |
 |
 |
| Parameter | Plot |
|---|---|
| CZT HV Monitor | 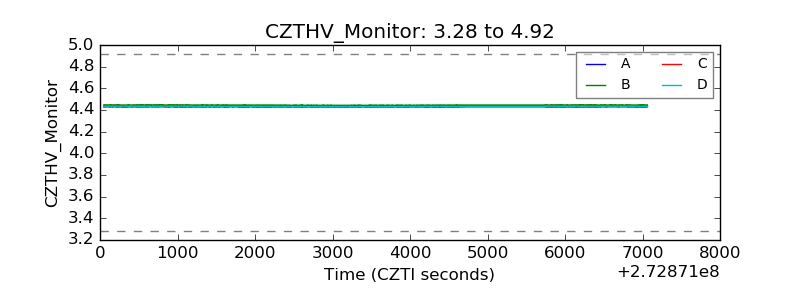 |
| D_VDD | 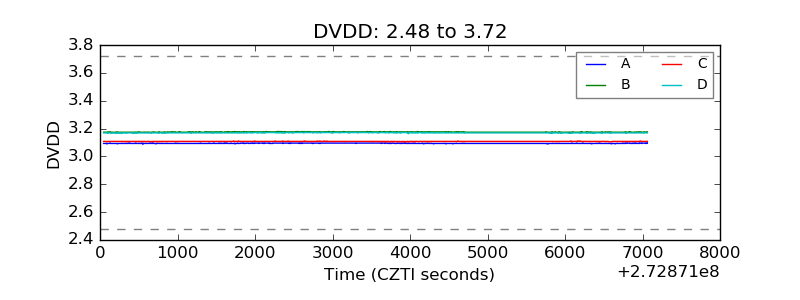 |
| Temperature 1 | 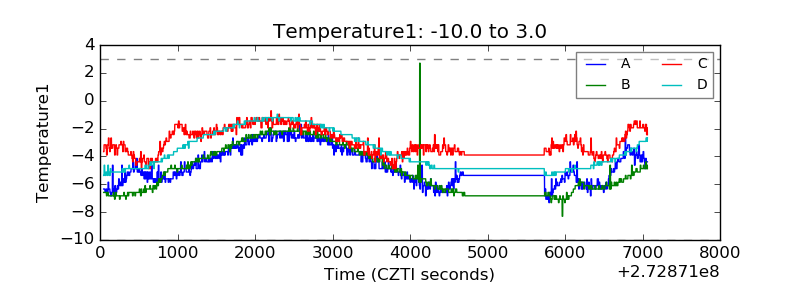 |
| Veto HV Monitor | 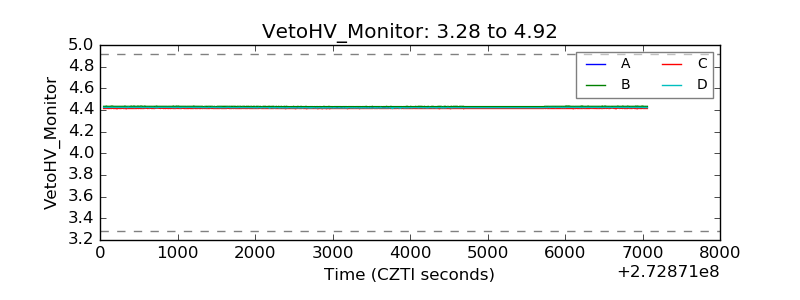 |
| Veto LLD | 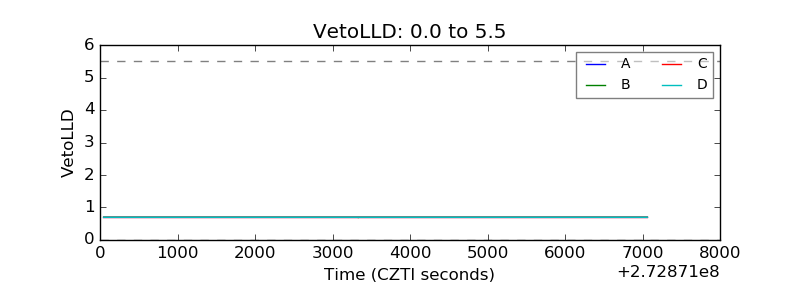 |
| Alpha Counter | 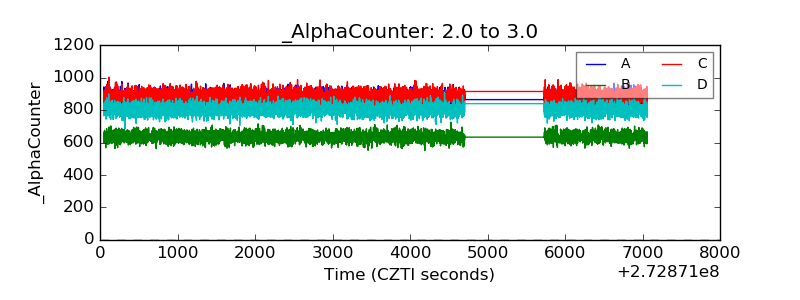 |
| _CPM_Rate | 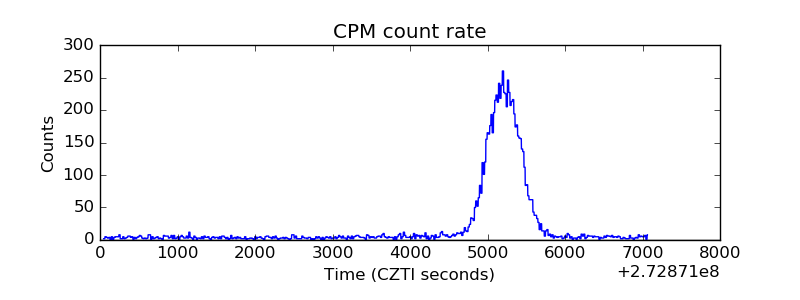 |
| CZT Counter | 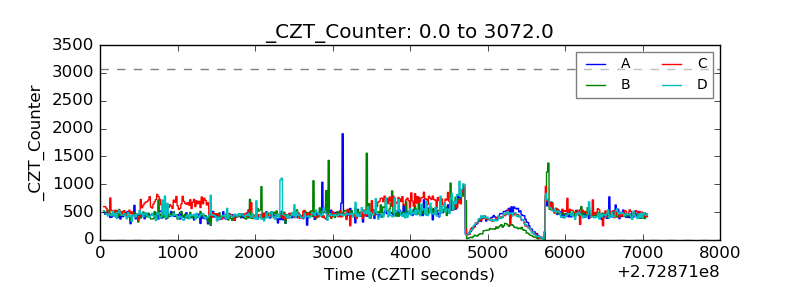 |
| +2.5 Volts monitor |  |
| +5 Volts monitor |  |
| _ROLL_ROT | 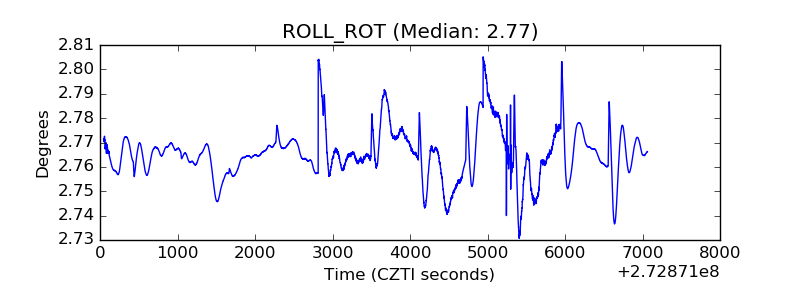 |
| _Roll_DEC | 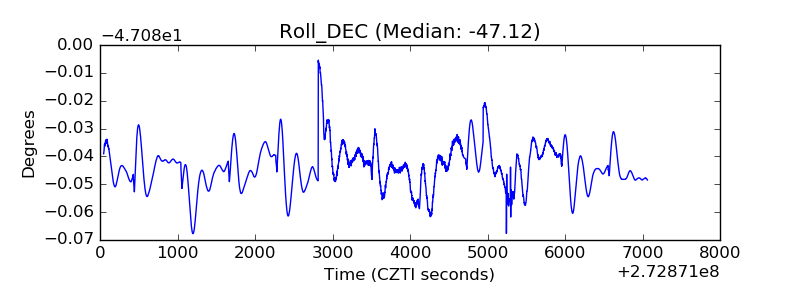 |
| _Roll_RA | 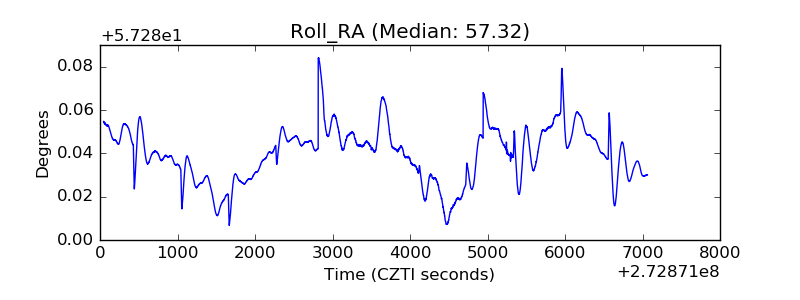 |
| Veto Counter | 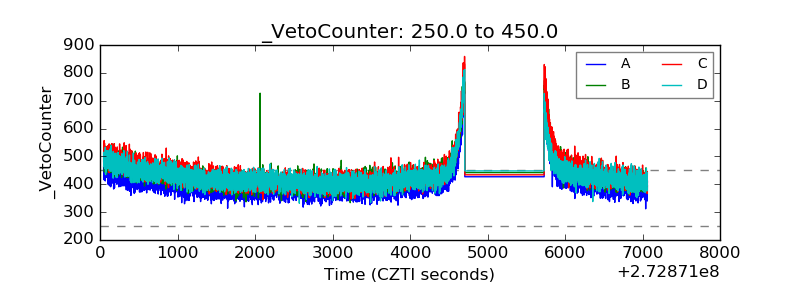 |