| Param | Original file | Final file |
|---|---|---|
| Filename | modeM0/AS1A04_198T01_9000002322_15724cztM0_level2.evt | modeM0/AS1A04_198T01_9000002322_15724cztM0_level2_quad_clean.evt |
| Size (bytes) | 415,756,800 | 85,245,120 |
| Size | 396.5 MB | 81.3 MB |
| Events in quadrant A | 2,927,205 | 536,510 |
| Events in quadrant B | 2,927,947 | 546,965 |
| Events in quadrant C | 3,161,041 | 532,363 |
| Events in quadrant D | 3,149,484 | 529,077 |
| Mode M0 | |||
|---|---|---|---|
| Quadrant | BADHDUFLAG | Total packets | Discarded packets |
| A | 0 | 13044 | 1 |
| B | 0 | 12914 | 1 |
| C | 0 | 13736 | 1 |
| D | 0 | 13699 | 1 |
| Mode SS | |||
|---|---|---|---|
| Quadrant | BADHDUFLAG | Total packets | Discarded packets |
| A | 0 | 128 | 0 |
| B | 0 | 128 | 0 |
| C | 0 | 128 | 0 |
| D | 0 | 128 | 0 |
| Mode M9 | |||
|---|---|---|---|
| Quadrant | BADHDUFLAG | Total packets | Discarded packets |
| A | 0 | 3 | 0 |
| B | 0 | 3 | 0 |
| C | 0 | 3 | 0 |
| D | 0 | 3 | 0 |
| Quadrant | Total seconds | Saturated seconds | Saturation percentage |
|---|---|---|---|
| A | 6246 | 147 | 2.353506% |
| B | 6246 | 141 | 2.257445% |
| C | 6246 | 143 | 2.289465% |
| D | 6246 | 132 | 2.113353% |
Noise dominated data is calculated using 1-second bins in cleaned event files. If a bin has >2000 counts, and if more than 50% of those come from <1% of pixels, then it is considered to be noise-dominated and hence unusable.
| Quadrant | # 1 sec bins | Bins with >0 counts | Bins with >2000 counts | High rate bins dominated by noise | Noise dominated (total time) | Noise dominated (detector-on time) | Marked lightcurve |
|---|---|---|---|---|---|---|---|
| A | 6587 | 6248 | 14 | 14 | 0.21% | 0.22% | 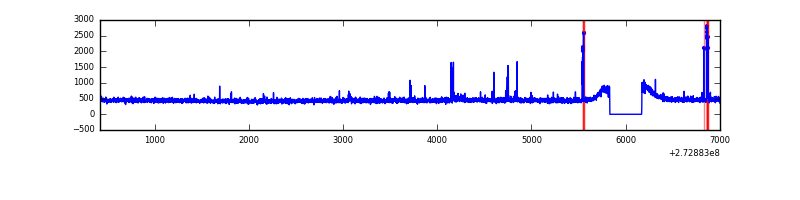 |
| B | 6587 | 6248 | 0 | 0 | 0.00% | 0.00% | 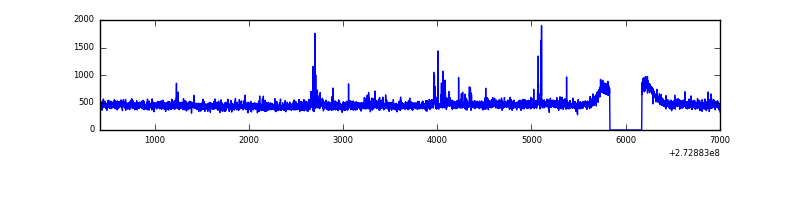 |
| C | 6587 | 6248 | 0 | 0 | 0.00% | 0.00% | 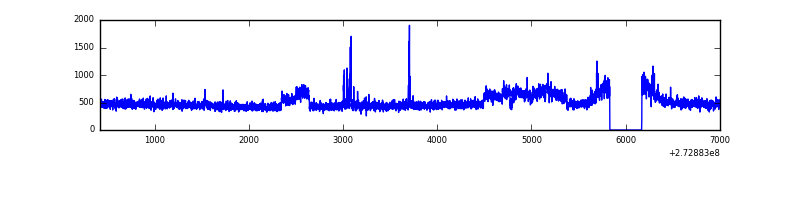 |
| D | 6587 | 6248 | 38 | 38 | 0.58% | 0.61% | 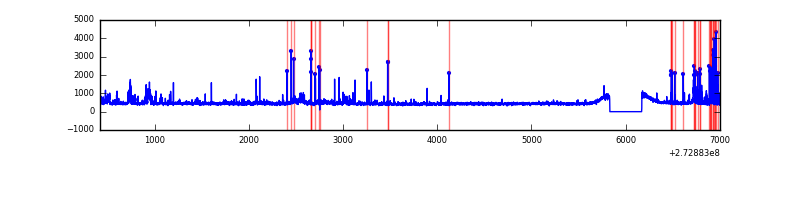 |
Top three noisy pixels from each quadrant. If the there are fewer than three noisy pixels in the level2.evt file, extra rows are filled as -1
| Pixel properties | Quadrant properties | ||||||
|---|---|---|---|---|---|---|---|
| Quadrant | DetID | PixID | Counts | Sigma | Mean | Median | Sigma |
| A | 9 | 143 | 97577 | 647.12 | 735 | 717 | 149.7 |
| A | 0 | 226 | 6548 | 38.96 | 735 | 717 | 149.7 |
| A | 12 | 194 | 5469 | 31.75 | 735 | 717 | 149.7 |
| B | 4 | 173 | 29195 | 199.95 | 735 | 714 | 142.4 |
| B | 12 | 111 | 16716 | 112.34 | 735 | 714 | 142.4 |
| B | 11 | 111 | 14478 | 96.63 | 735 | 714 | 142.4 |
| C | 3 | 233 | 219270 | 1311.94 | 713 | 717 | 166.6 |
| C | 14 | 238 | 108248 | 645.49 | 713 | 717 | 166.6 |
| C | 9 | 54 | 44601 | 263.43 | 713 | 717 | 166.6 |
| D | 1 | 52 | 201266 | 1138.91 | 723 | 704 | 176.1 |
| D | 12 | 110 | 186216 | 1053.45 | 723 | 704 | 176.1 |
| D | 2 | 234 | 26339 | 145.57 | 723 | 704 | 176.1 |
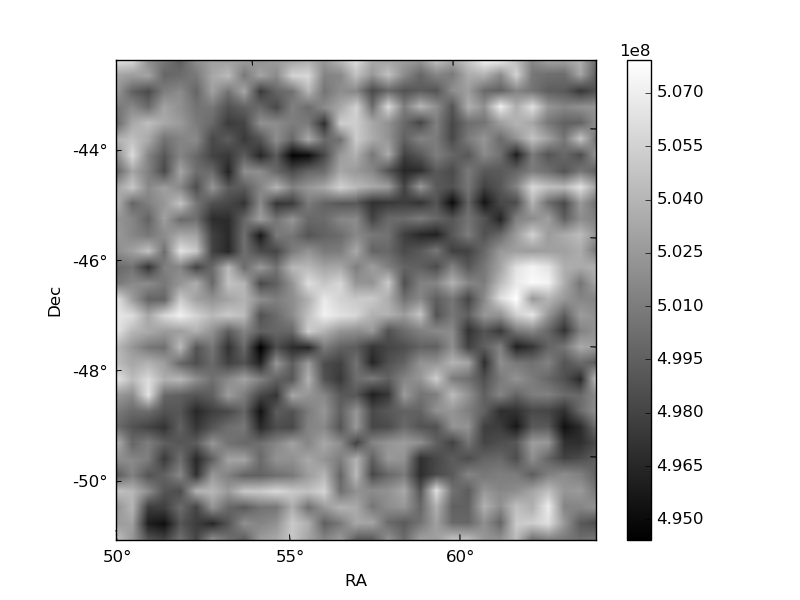
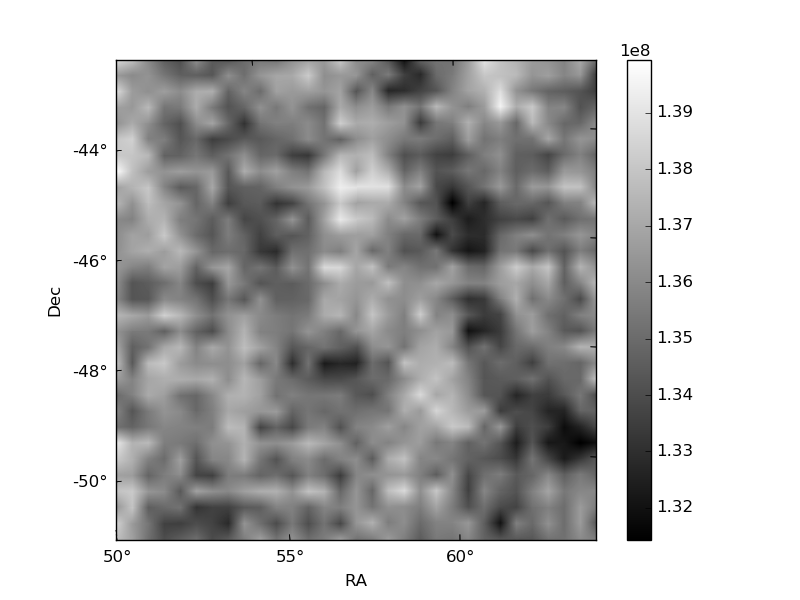
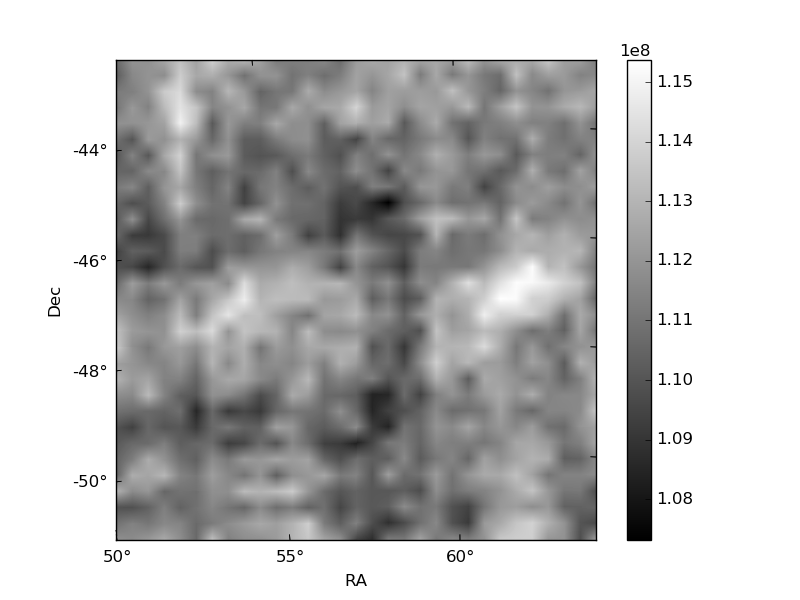
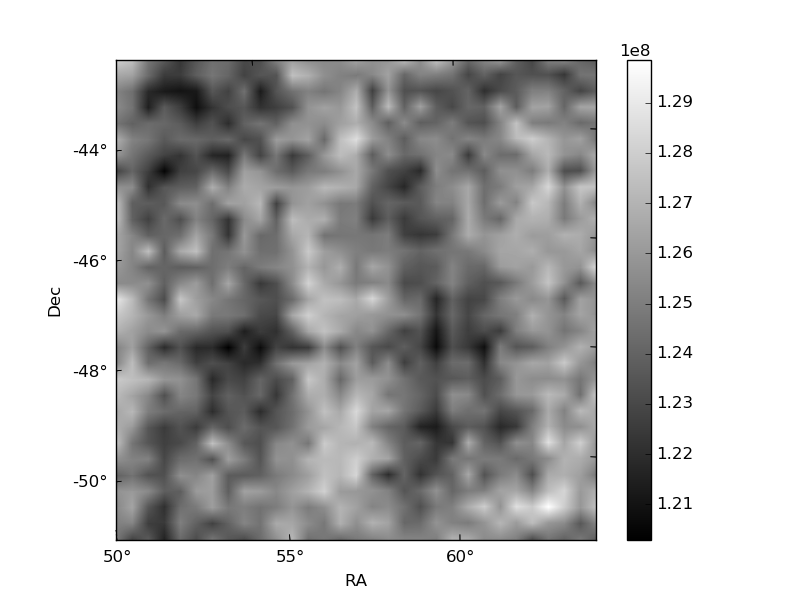
Histogram calculated using DETX and DETY for each event in the final _common_clean file
| Quadrant A | 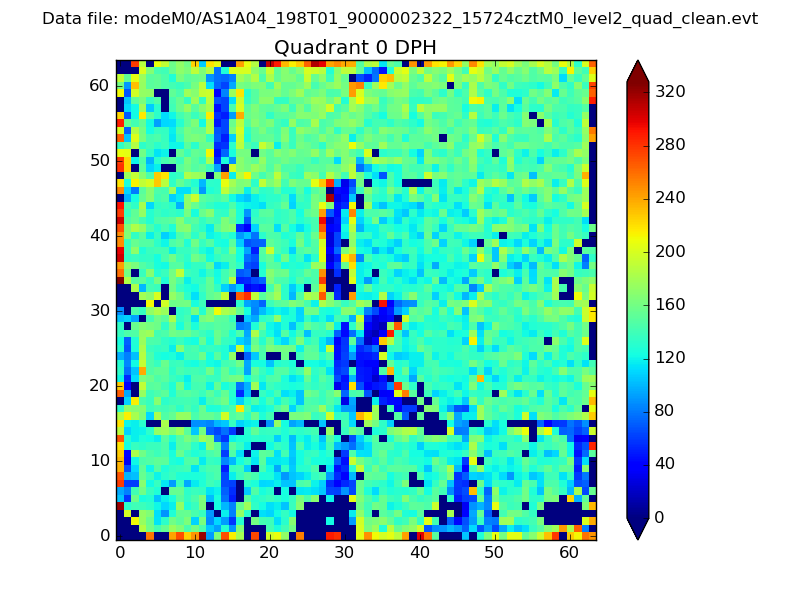 |
 |
Quadrant B |
|---|---|---|---|
| Quadrant D | 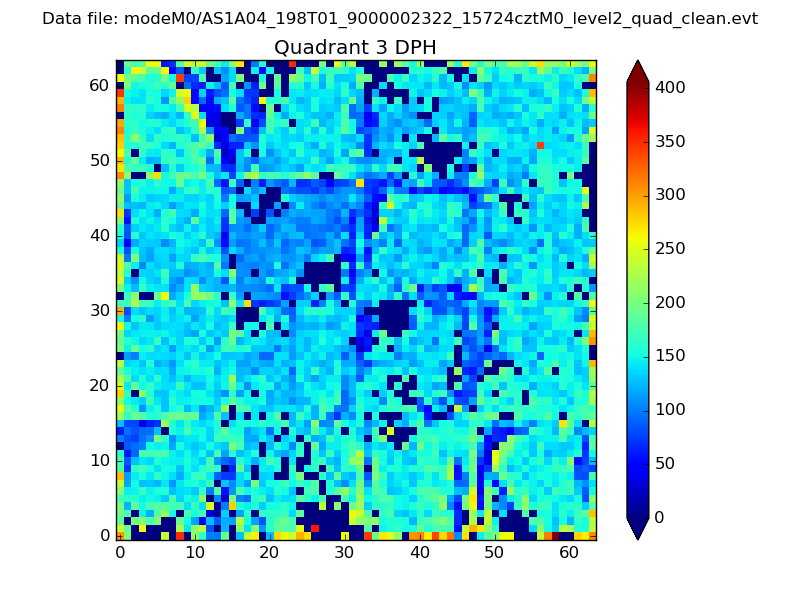 |
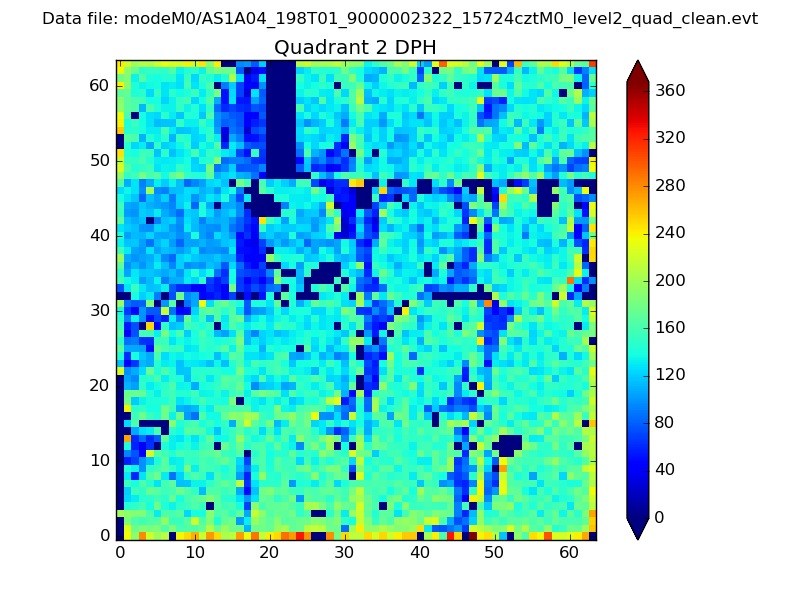 |
Quadrant C |
| Plot type | Count rate plots | Images |
|---|---|---|
| Comparison with Poisson distribution Blue bars denote a histogram of data divided into 1 sec bins. Red curve is a Poisson curve with rate = median count rate of data. |
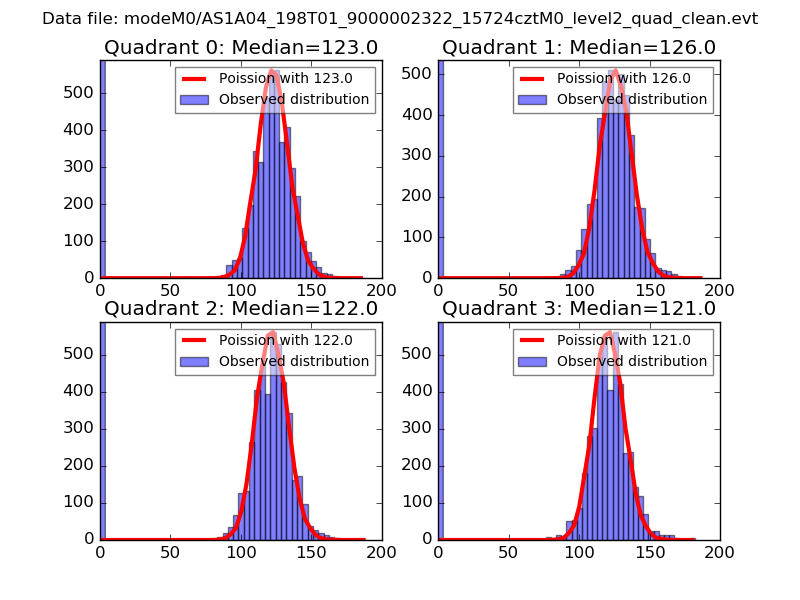 |
 |
| Quadrant-wise count rates Data is divided into 100 sec bins |
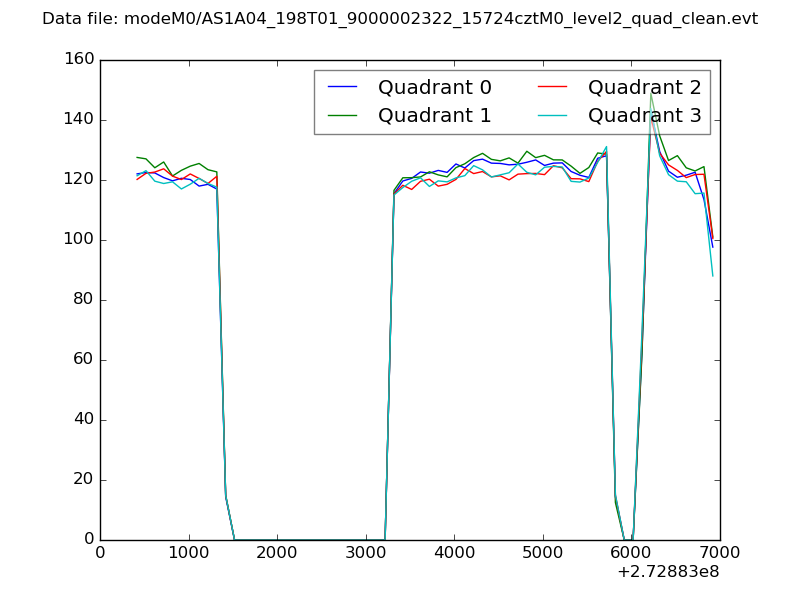 |
|
| Module-wise count rates for Quadrant A Data is divided into 100 sec bins |
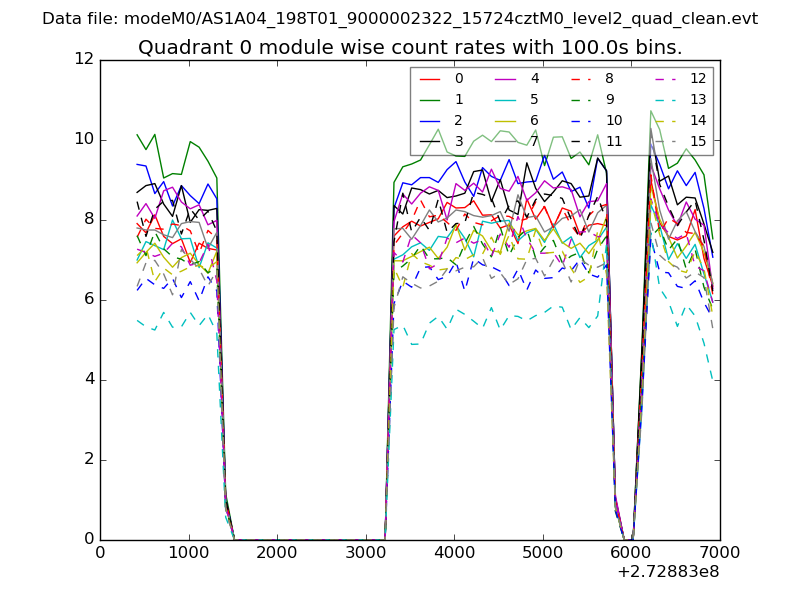 |
 |
| Module-wise count rates for Quadrant B Data is divided into 100 sec bins |
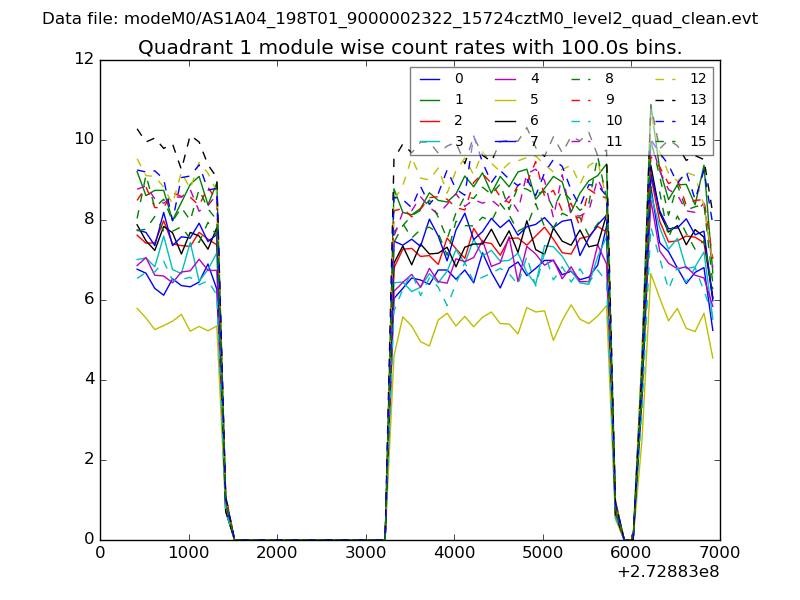 |
 |
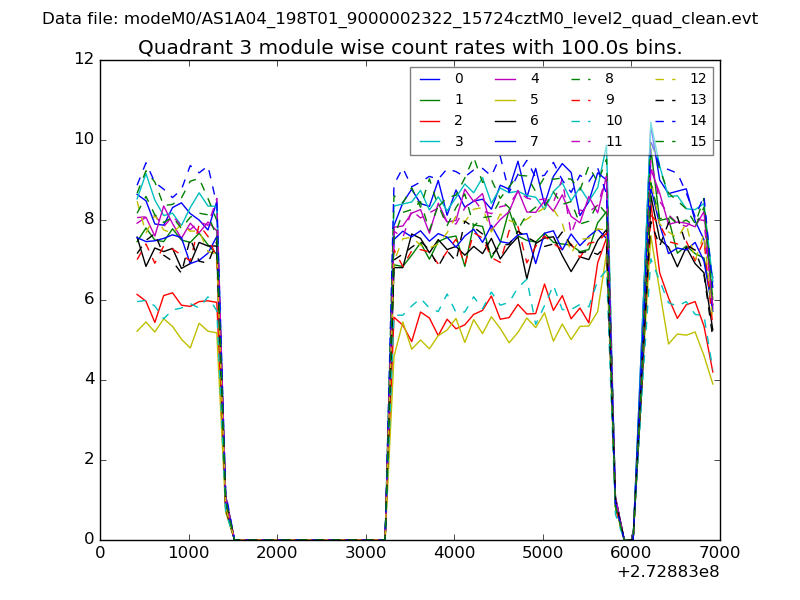
| Module-wise count rates for Quadrant C Data is divided into 100 sec bins |
 |
 |
| Module-wise count rates for Quadrant D Data is divided into 100 sec bins |
 |
 |
| Parameter | Plot |
|---|---|
| CZT HV Monitor | 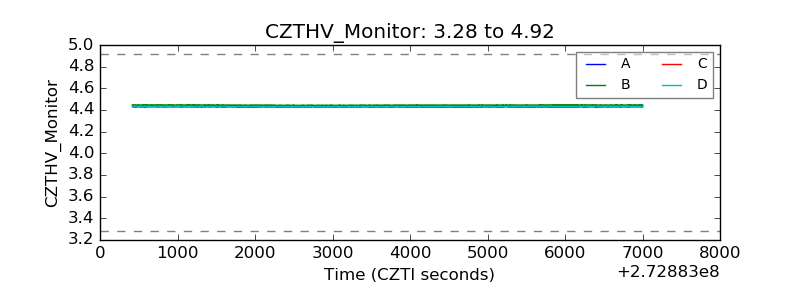 |
| D_VDD | 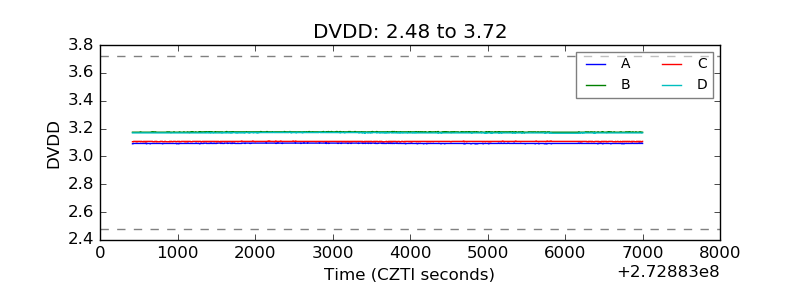 |
| Temperature 1 | 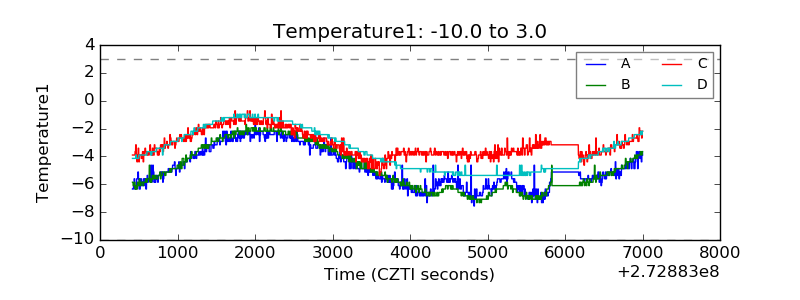 |
| Veto HV Monitor | 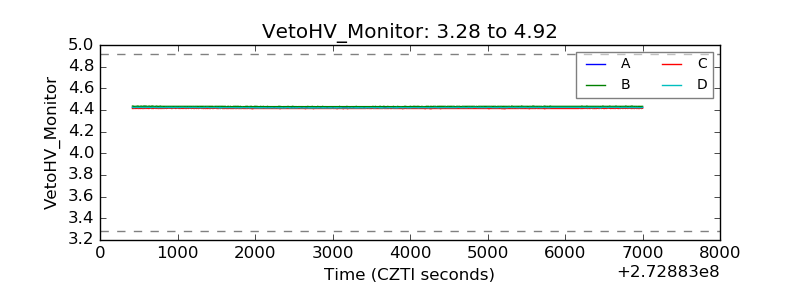 |
| Veto LLD | 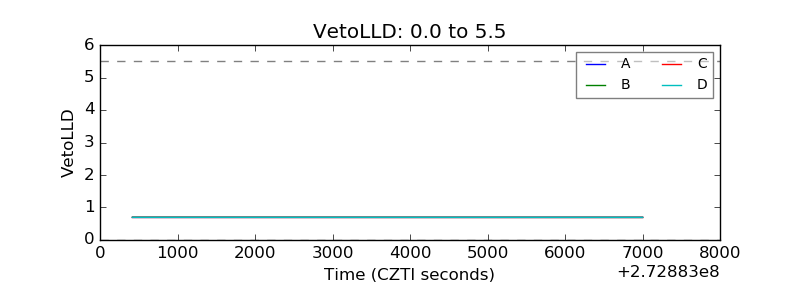 |
| Alpha Counter | 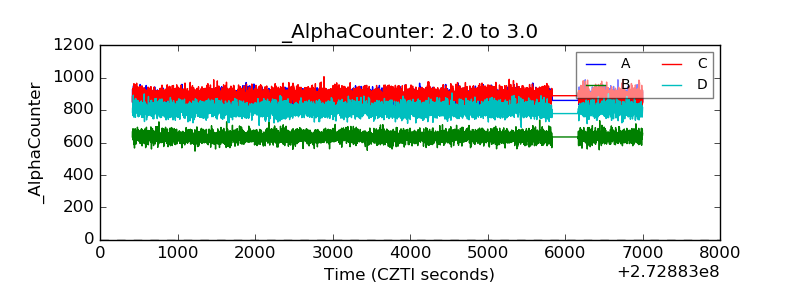 |
| _CPM_Rate | 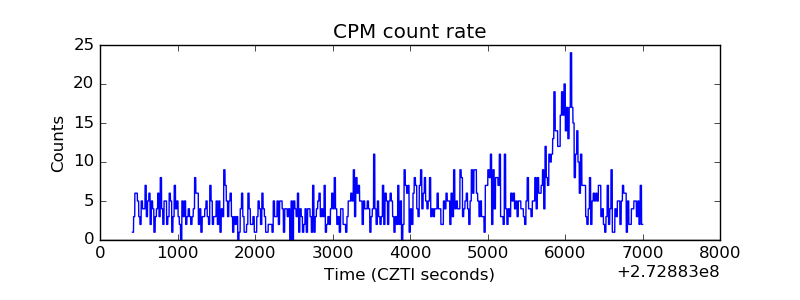 |
| CZT Counter | 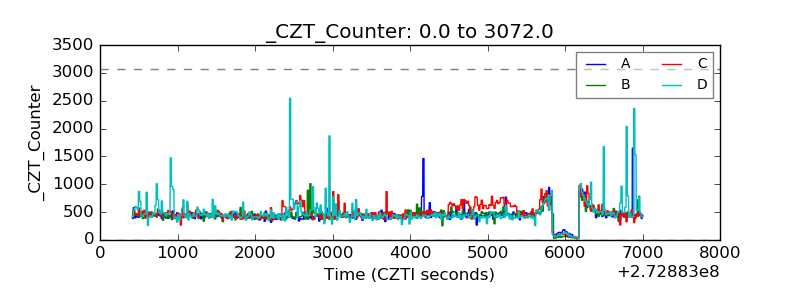 |
| +2.5 Volts monitor |  |
| +5 Volts monitor |  |
| _ROLL_ROT | 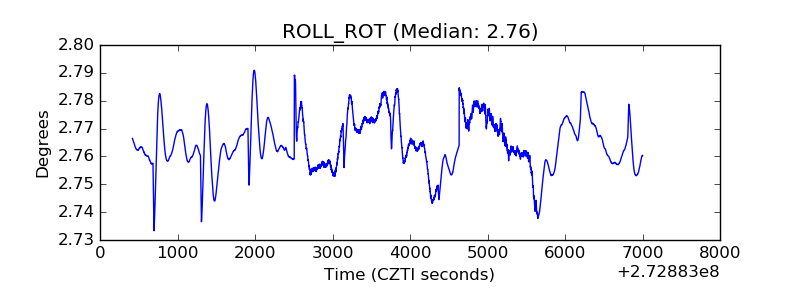 |
| _Roll_DEC | 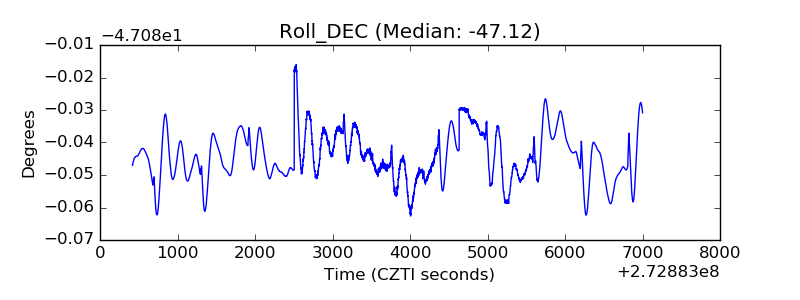 |
| _Roll_RA | 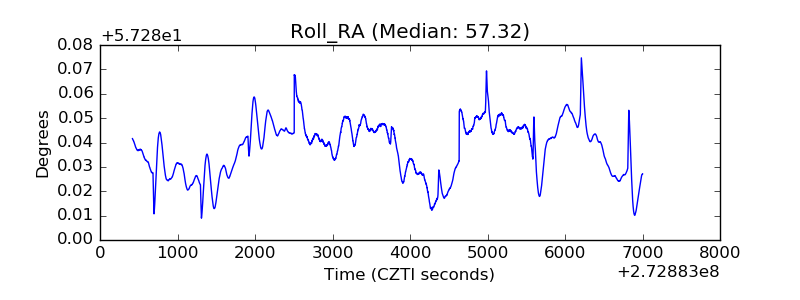 |
| Veto Counter | 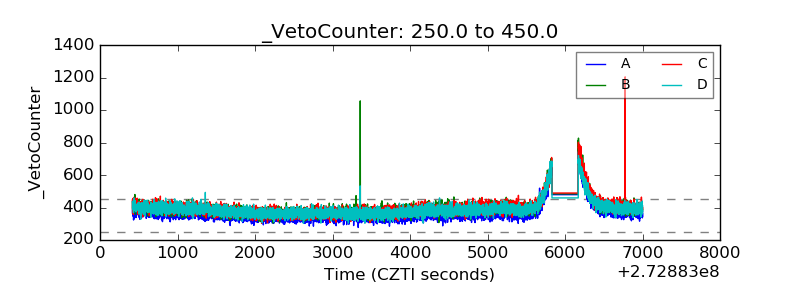 |