| Param | Original file | Final file |
|---|---|---|
| Filename | modeM0/AS1G08_030T01_9000002326cztM0_level2.fits | modeM0/AS1G08_030T01_9000002326cztM0_level2_quad_clean.evt |
| Size (bytes) | 230,878,080 | 165,850,560 |
| Size | 220.2 MB | 158.2 MB |
| Events in quadrant A | 1,409,224 | 878,463 |
| Events in quadrant B | 1,359,326 | 877,968 |
| Events in quadrant C | 1,375,974 | 837,145 |
| Events in quadrant D | 1,186,120 | 765,854 |
| Mode SS | |||
|---|---|---|---|
| Quadrant | BADHDUFLAG | Total packets | Discarded packets |
| A | 0 | 494 | 0 |
| B | 0 | 494 | 0 |
| C | 0 | 494 | 0 |
| D | 0 | 494 | 0 |
| Mode M9 | |||
|---|---|---|---|
| Quadrant | BADHDUFLAG | Total packets | Discarded packets |
| A | 0 | 52 | 0 |
| B | 0 | 52 | 0 |
| C | 0 | 52 | 0 |
| D | 0 | 52 | 0 |
| Mode M0 | |||
|---|---|---|---|
| Quadrant | BADHDUFLAG | Total packets | Discarded packets |
| A | 0 | 49897 | 0 |
| B | 0 | 50687 | 0 |
| C | 0 | 52745 | 0 |
| D | 0 | 57948 | 0 |
| Quadrant | Total seconds | Saturated seconds | Saturation percentage |
|---|---|---|---|
| A | 24149 | 132 | 0.546606% |
| B | 24149 | 179 | 0.741232% |
| C | 24149 | 257 | 1.064226% |
| D | 24149 | 602 | 2.492857% |
Noise dominated data is calculated using 1-second bins in cleaned event files. If a bin has >2000 counts, and if more than 50% of those come from <1% of pixels, then it is considered to be noise-dominated and hence unusable.
| Quadrant | # 1 sec bins | Bins with >0 counts | Bins with >2000 counts | High rate bins dominated by noise | Noise dominated (total time) | Noise dominated (detector-on time) | Marked lightcurve |
|---|---|---|---|---|---|---|---|
| A | 29380 | 24149 | 0 | 0 | 0.00% | 0.00% | 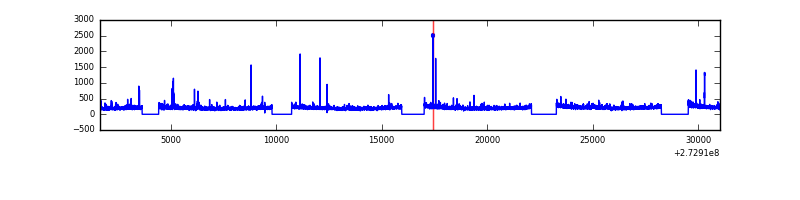 |
| B | 29380 | 24149 | 0 | 0 | 0.00% | 0.00% |  |
| C | 29380 | 24149 | 0 | 0 | 0.00% | 0.00% |  |
| D | 29380 | 24143 | 0 | 0 | 0.00% | 0.00% |  |
Top three noisy pixels from each quadrant. If the there are fewer than three noisy pixels in the level2.evt file, extra rows are filled as -1
| Pixel properties | Quadrant properties | ||||||
|---|---|---|---|---|---|---|---|
| Quadrant | DetID | PixID | Counts | Sigma | Mean | Median | Sigma |
| A | 0 | 29 | 1389 | 11.12 | 367 | 344 | 94.0 |
| A | 7 | 110 | 1119 | 8.25 | 367 | 344 | 94.0 |
| A | 0 | 30 | 1087 | 7.91 | 367 | 344 | 94.0 |
| B | 2 | 9 | 1019 | 9.21 | 360 | 344 | 73.3 |
| B | 3 | 17 | 925 | 7.93 | 360 | 344 | 73.3 |
| B | 5 | 128 | 913 | 7.76 | 360 | 344 | 73.3 |
| C | 1 | 81 | 1081 | 7.75 | 363 | 339 | 95.7 |
| C | 1 | 80 | 1040 | 7.33 | 363 | 339 | 95.7 |
| C | 12 | 241 | 960 | 6.49 | 363 | 339 | 95.7 |
| D | 3 | 14 | 906 | 6.6 | 337 | 308 | 90.6 |
| D | 7 | 5 | 880 | 6.31 | 337 | 308 | 90.6 |
| D | 6 | 67 | 874 | 6.24 | 337 | 308 | 90.6 |
Histogram calculated using DETX and DETY for each event in the final _common_clean file
| Quadrant A | 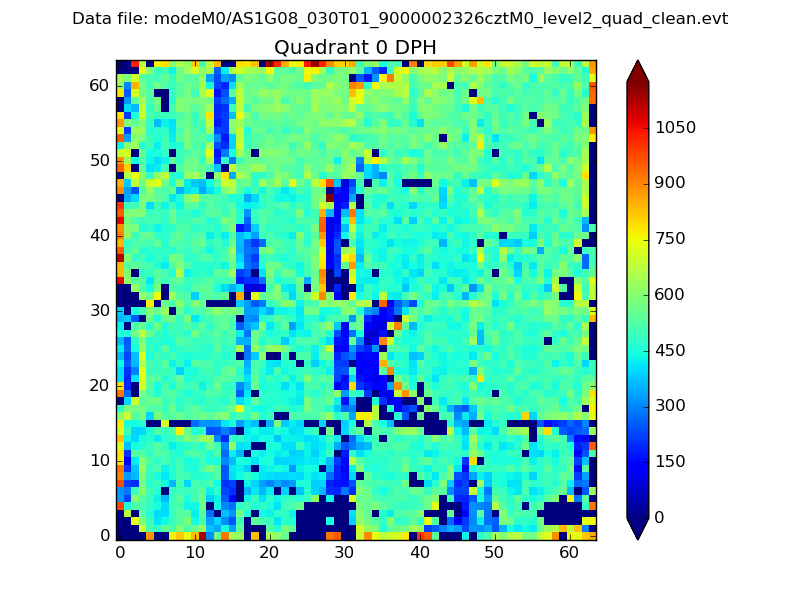 |
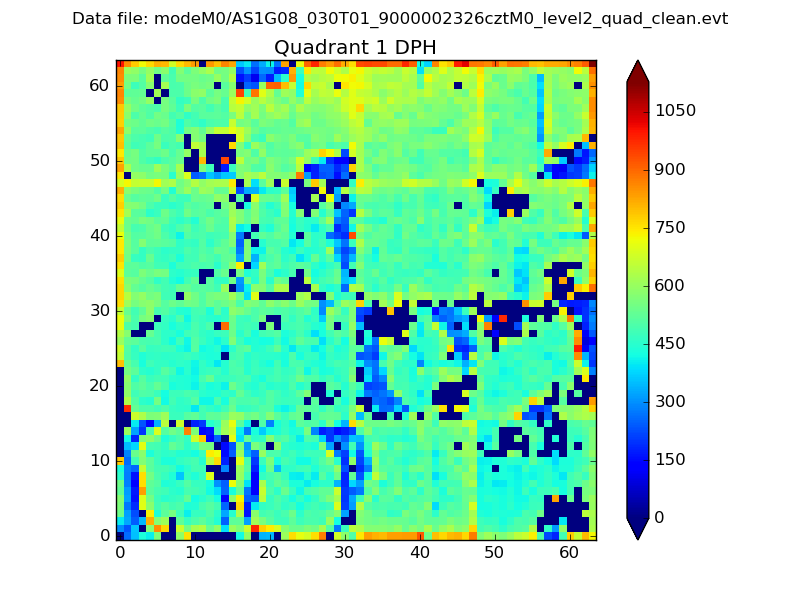 |
Quadrant B |
|---|---|---|---|
| Quadrant D |  |
 |
Quadrant C |
| Plot type | Count rate plots | Images |
|---|---|---|
| Comparison with Poisson distribution Blue bars denote a histogram of data divided into 1 sec bins. Red curve is a Poisson curve with rate = median count rate of data. |
 |
 |
| Quadrant-wise count rates Data is divided into 100 sec bins |
 |
|
| Module-wise count rates for Quadrant A Data is divided into 100 sec bins |
 |
 |
| Module-wise count rates for Quadrant B Data is divided into 100 sec bins |
 |
 |
| Module-wise count rates for Quadrant C Data is divided into 100 sec bins |
 |
 |
| Module-wise count rates for Quadrant D Data is divided into 100 sec bins |
 |
 |
| Parameter | Plot |
|---|---|
| CZT HV Monitor |  |
| D_VDD |  |
| Temperature 1 | 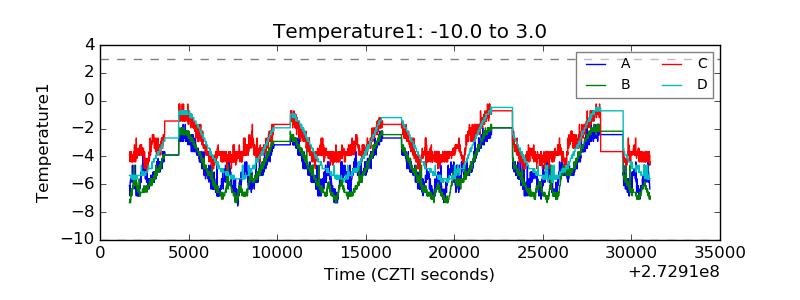 |
| Veto HV Monitor | 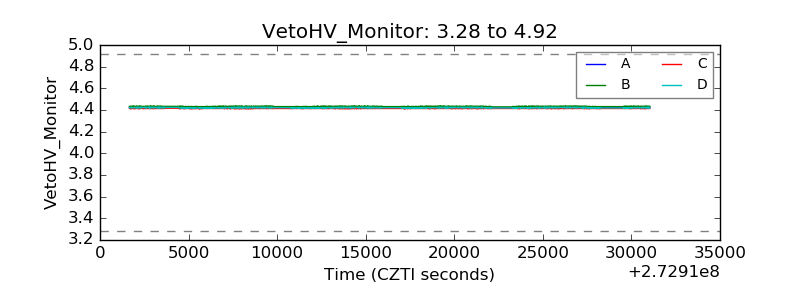 |
| Veto LLD |  |
| Alpha Counter |  |
| _CPM_Rate |  |
| CZT Counter | 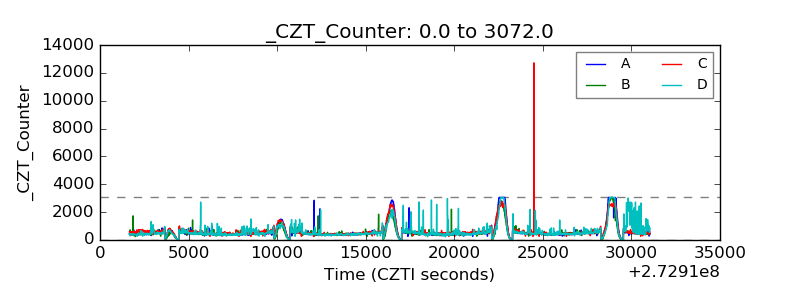 |
| +2.5 Volts monitor |  |
| +5 Volts monitor |  |
| _ROLL_ROT |  |
| _Roll_DEC |  |
| _Roll_RA |  |
| Veto Counter | 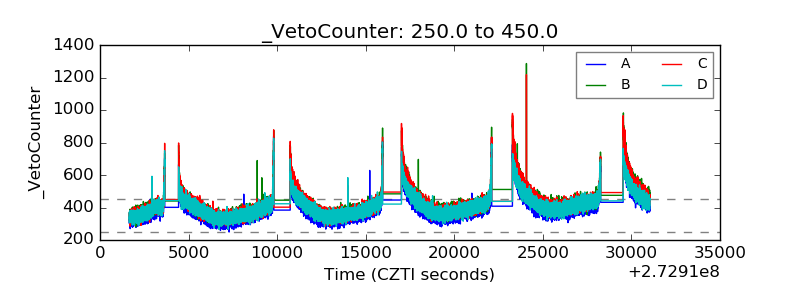 |