| Param | Original file | Final file |
|---|---|---|
| Filename | modeM0/AS1G08_030T01_9000002326_15727cztM0_level2.evt | modeM0/AS1G08_030T01_9000002326_15727cztM0_level2_quad_clean.evt |
| Size (bytes) | 246,706,560 | 35,144,640 |
| Size | 235.3 MB | 33.5 MB |
| Events in quadrant A | 1,684,398 | 208,806 |
| Events in quadrant B | 1,731,554 | 210,504 |
| Events in quadrant C | 2,057,477 | 199,347 |
| Events in quadrant D | 1,760,621 | 198,901 |
| Mode SS | |||
|---|---|---|---|
| Quadrant | BADHDUFLAG | Total packets | Discarded packets |
| A | 0 | 72 | 0 |
| B | 0 | 72 | 0 |
| C | 0 | 72 | 0 |
| D | 0 | 72 | 0 |
| Mode M9 | |||
|---|---|---|---|
| Quadrant | BADHDUFLAG | Total packets | Discarded packets |
| A | 0 | 8 | 0 |
| B | 0 | 8 | 0 |
| C | 0 | 8 | 0 |
| D | 0 | 8 | 0 |
| Mode M0 | |||
|---|---|---|---|
| Quadrant | BADHDUFLAG | Total packets | Discarded packets |
| A | 0 | 7218 | 2 |
| B | 0 | 7286 | 1 |
| C | 0 | 8434 | 1 |
| D | 0 | 7533 | 1 |
| Quadrant | Total seconds | Saturated seconds | Saturation percentage |
|---|---|---|---|
| A | 3468 | 23 | 0.663206% |
| B | 3468 | 36 | 1.038062% |
| C | 3468 | 41 | 1.182238% |
| D | 3468 | 18 | 0.519031% |
Noise dominated data is calculated using 1-second bins in cleaned event files. If a bin has >2000 counts, and if more than 50% of those come from <1% of pixels, then it is considered to be noise-dominated and hence unusable.
| Quadrant | # 1 sec bins | Bins with >0 counts | Bins with >2000 counts | High rate bins dominated by noise | Noise dominated (total time) | Noise dominated (detector-on time) | Marked lightcurve |
|---|---|---|---|---|---|---|---|
| A | 4254 | 3470 | 0 | 0 | 0.00% | 0.00% | 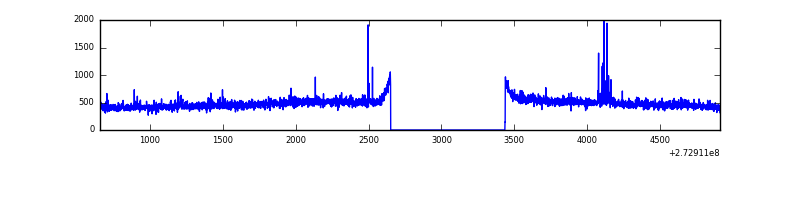 |
| B | 4254 | 3470 | 4 | 4 | 0.09% | 0.12% | 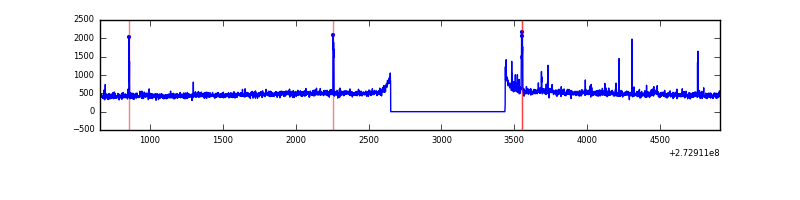 |
| C | 4254 | 3470 | 0 | 0 | 0.00% | 0.00% | 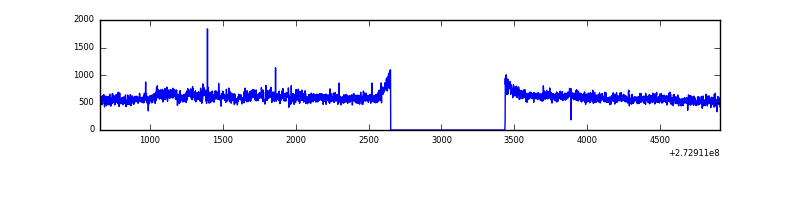 |
| D | 4254 | 3470 | 6 | 6 | 0.14% | 0.17% | 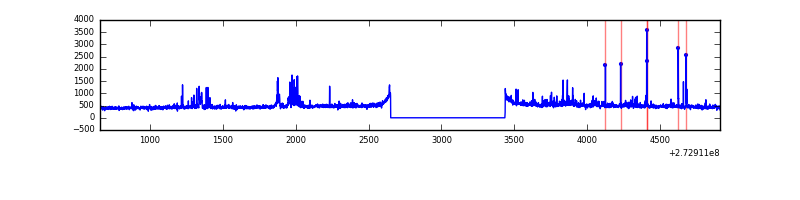 |
Top three noisy pixels from each quadrant. If the there are fewer than three noisy pixels in the level2.evt file, extra rows are filled as -1
| Pixel properties | Quadrant properties | ||||||
|---|---|---|---|---|---|---|---|
| Quadrant | DetID | PixID | Counts | Sigma | Mean | Median | Sigma |
| A | 13 | 248 | 17910 | 196.97 | 429 | 420 | 88.8 |
| A | 9 | 143 | 11608 | 126.0 | 429 | 420 | 88.8 |
| A | 0 | 226 | 3756 | 37.57 | 429 | 420 | 88.8 |
| B | 4 | 173 | 19807 | 228.46 | 426 | 415 | 84.9 |
| B | 5 | 236 | 15529 | 178.06 | 426 | 415 | 84.9 |
| B | 12 | 111 | 9808 | 110.66 | 426 | 415 | 84.9 |
| C | 3 | 233 | 387955 | 3992.42 | 410 | 414 | 97.1 |
| C | 14 | 238 | 62483 | 639.43 | 410 | 414 | 97.1 |
| C | 10 | 187 | 3358 | 30.33 | 410 | 414 | 97.1 |
| D | 1 | 52 | 143024 | 1377.53 | 414 | 401 | 103.5 |
| D | 12 | 110 | 25417 | 241.62 | 414 | 401 | 103.5 |
| D | 2 | 234 | 14774 | 138.82 | 414 | 401 | 103.5 |
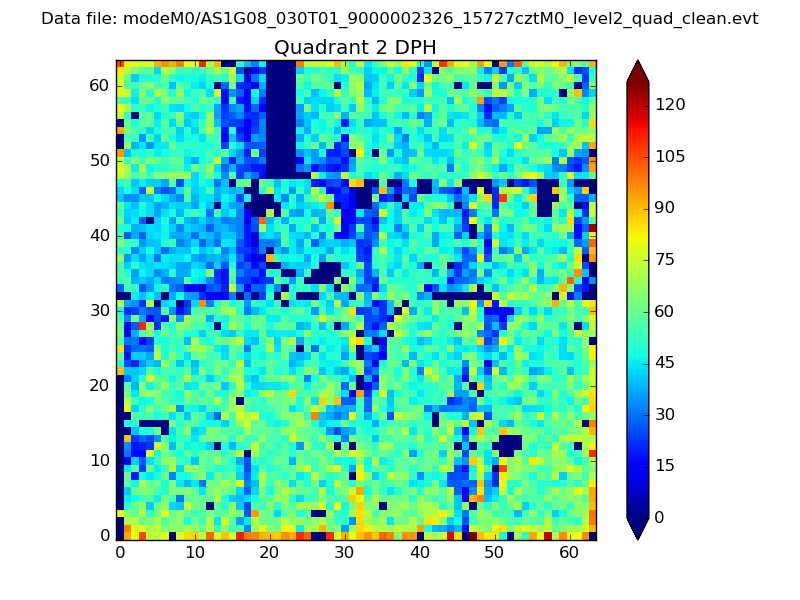
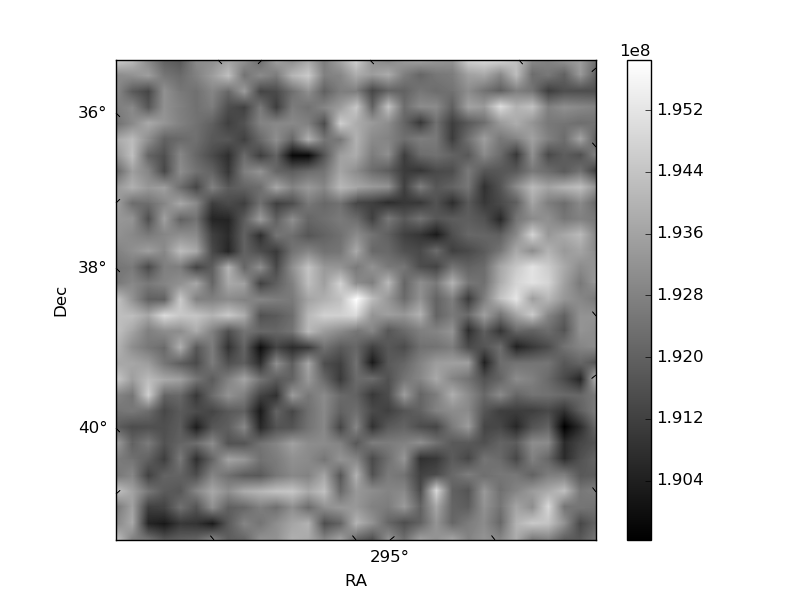
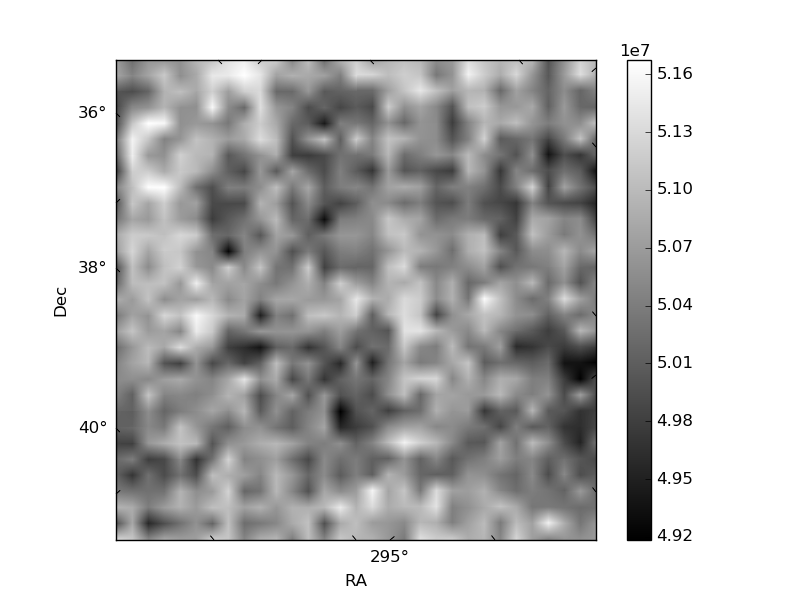
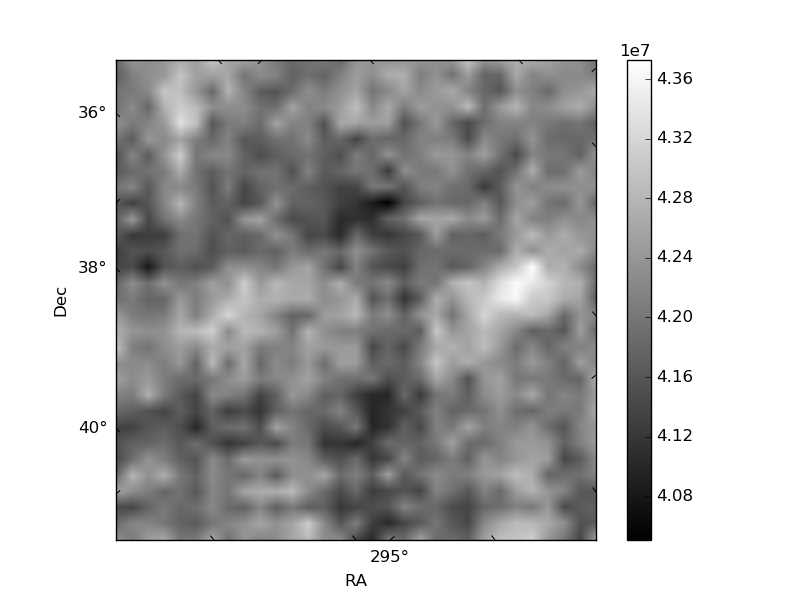
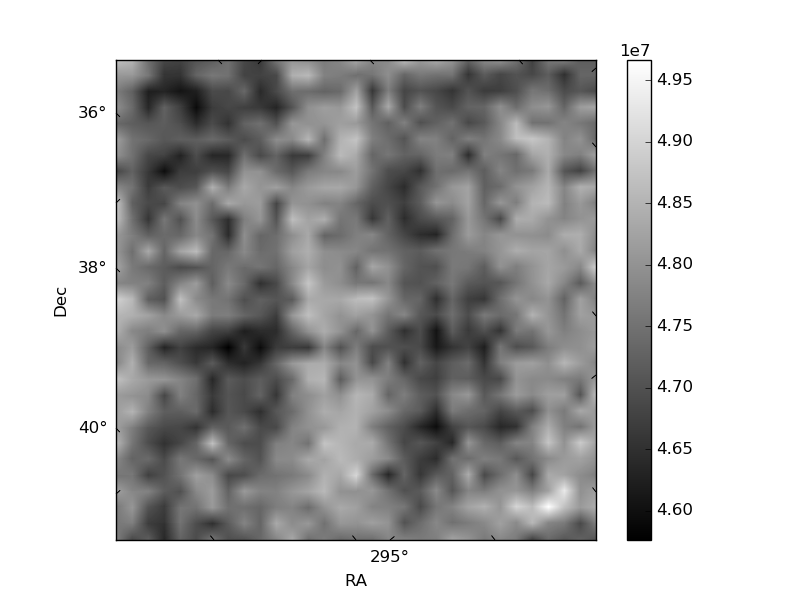
Histogram calculated using DETX and DETY for each event in the final _common_clean file
| Quadrant A | 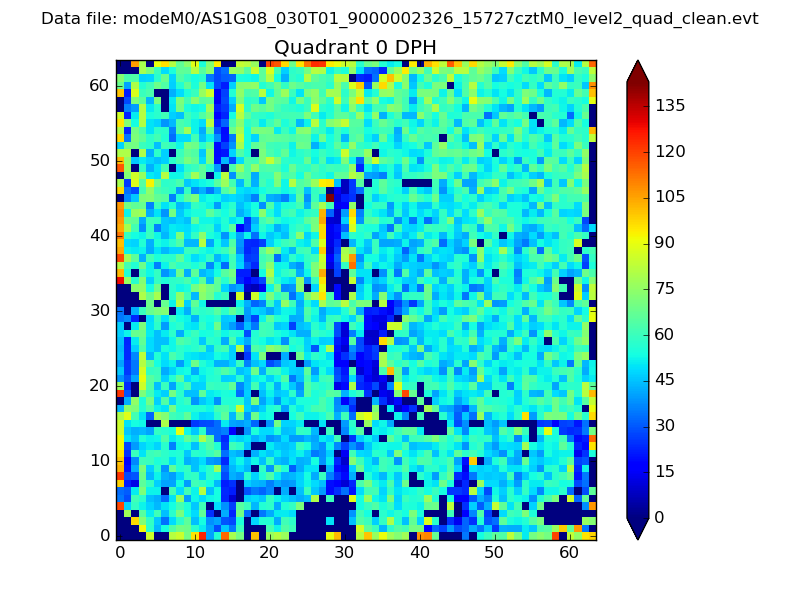 |
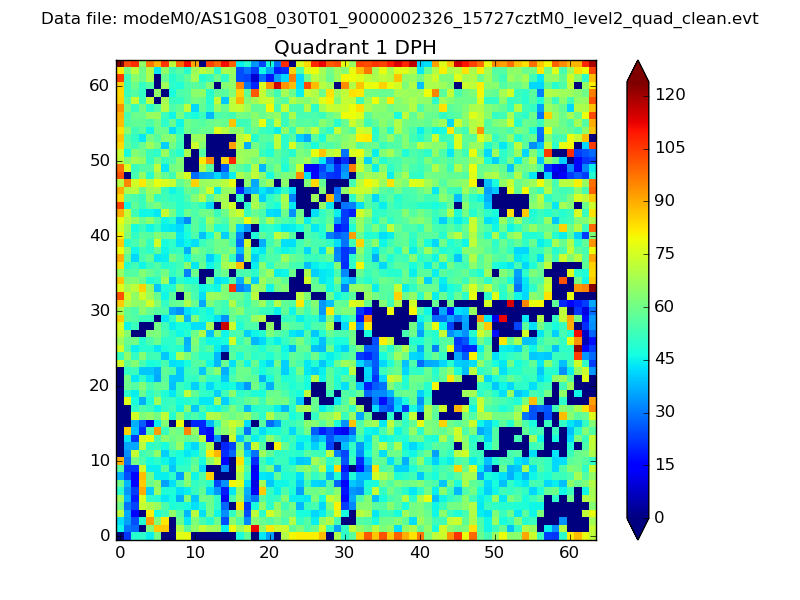 |
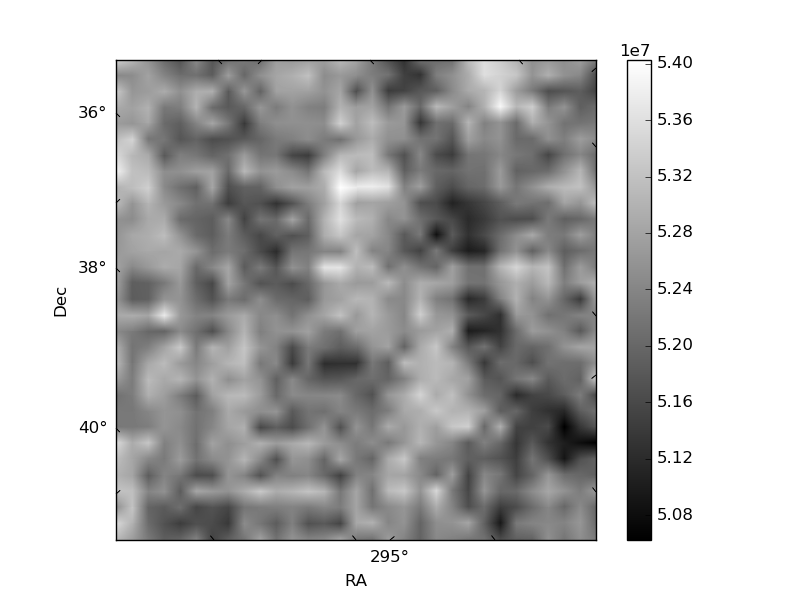
Quadrant B |
|---|---|---|---|
| Quadrant D | 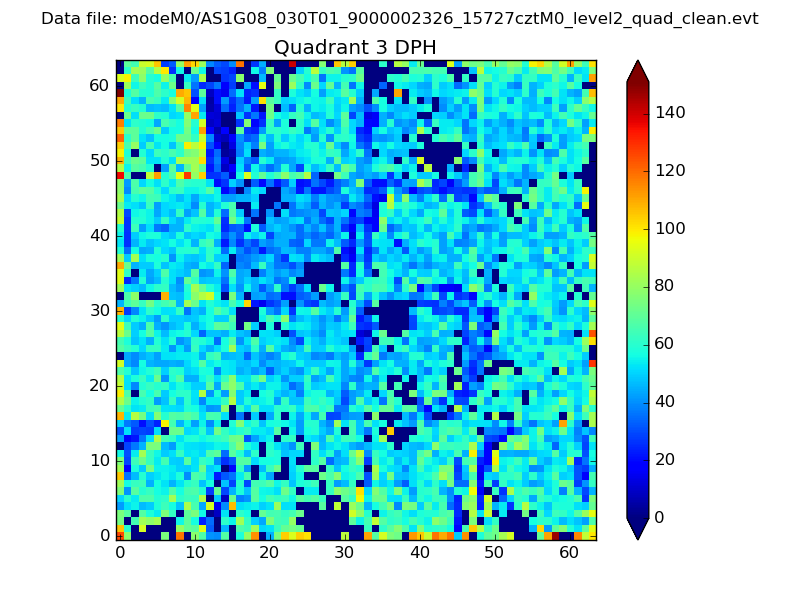 |
 |
Quadrant C |
| Plot type | Count rate plots | Images |
|---|---|---|
| Comparison with Poisson distribution Blue bars denote a histogram of data divided into 1 sec bins. Red curve is a Poisson curve with rate = median count rate of data. |
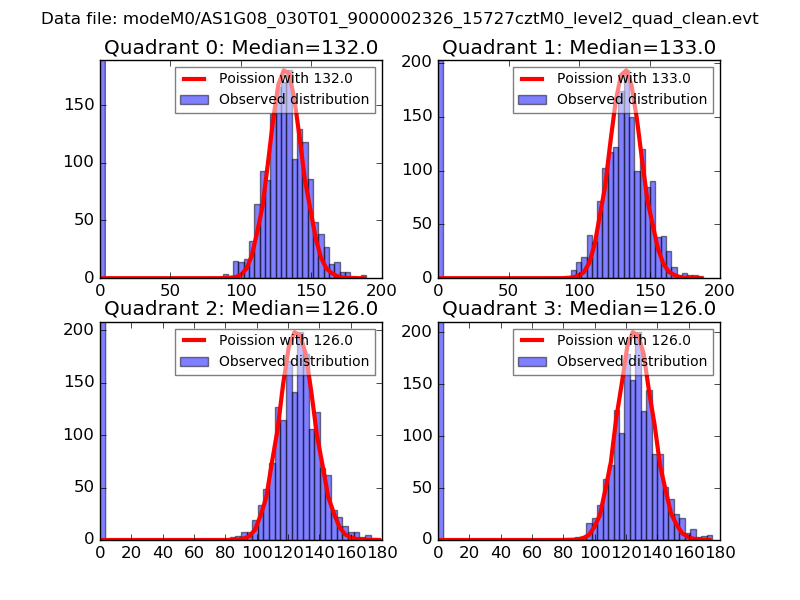 |
 |
| Quadrant-wise count rates Data is divided into 100 sec bins |
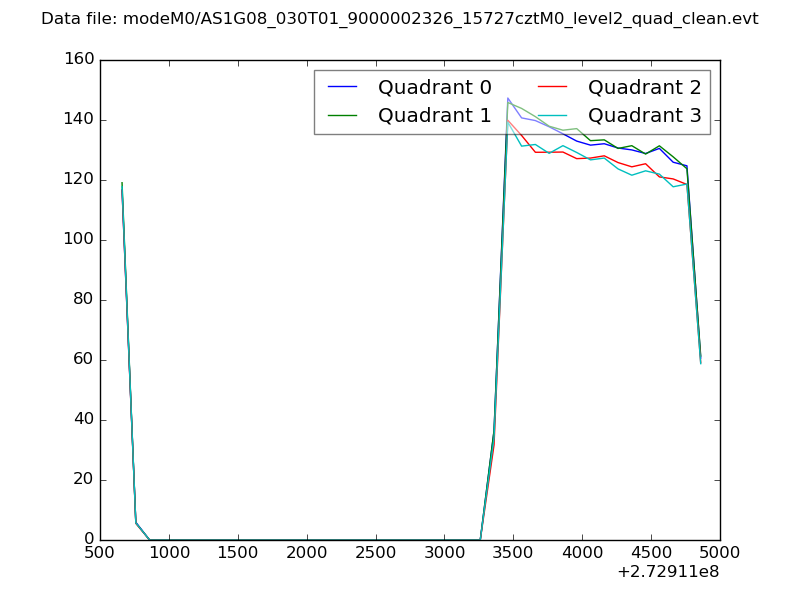 |
|
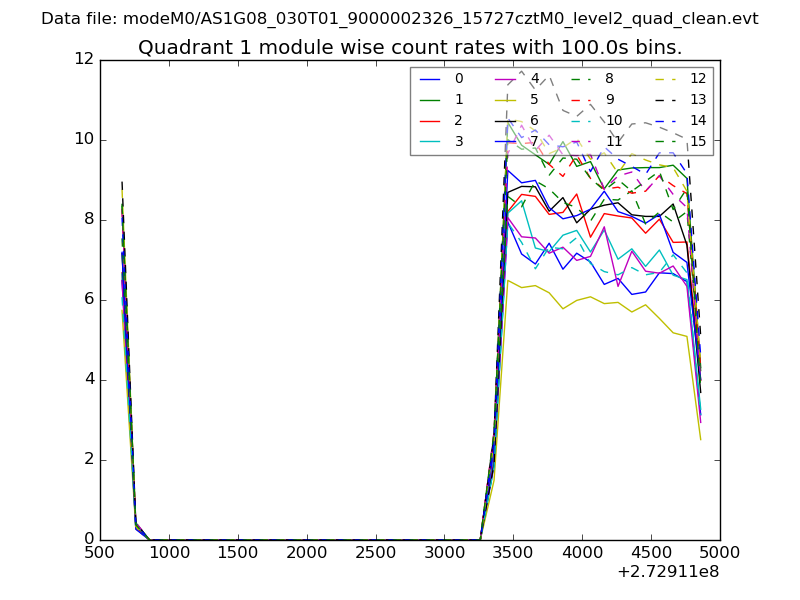
| Module-wise count rates for Quadrant A Data is divided into 100 sec bins |
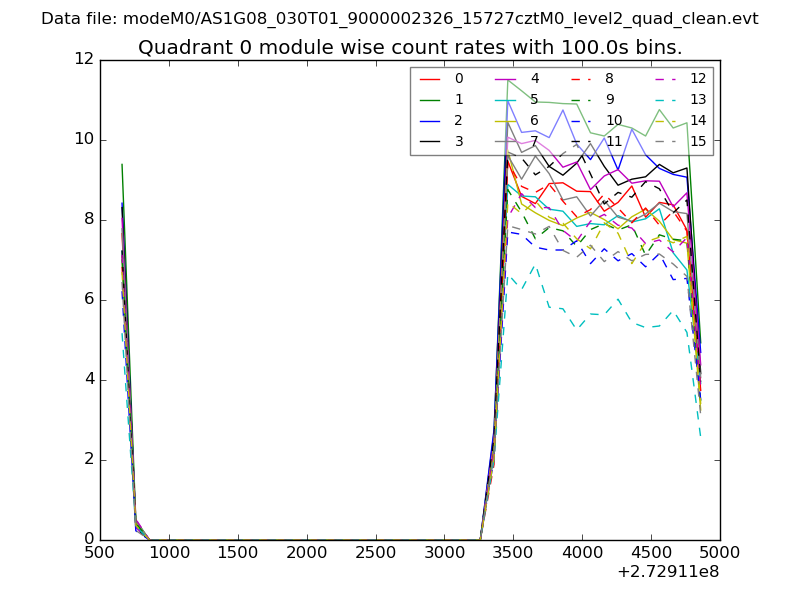 |
 |
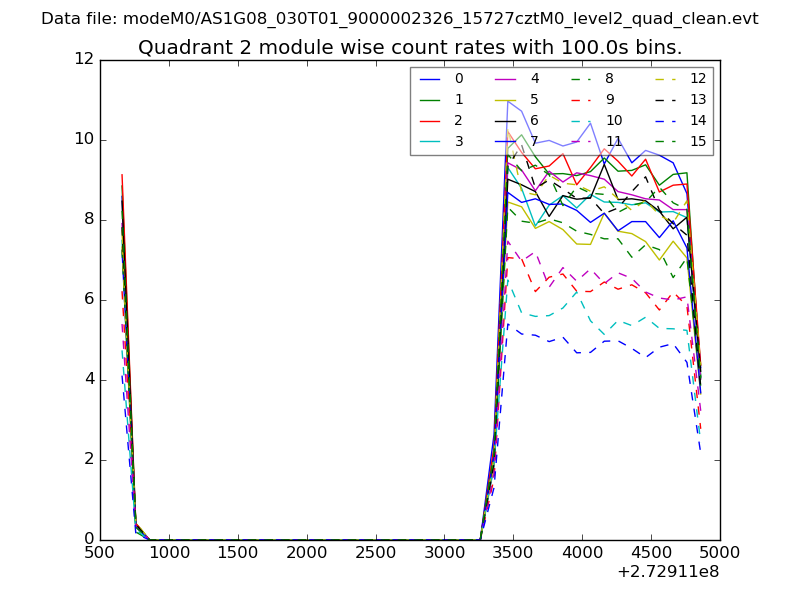
| Module-wise count rates for Quadrant B Data is divided into 100 sec bins |
 |
 |
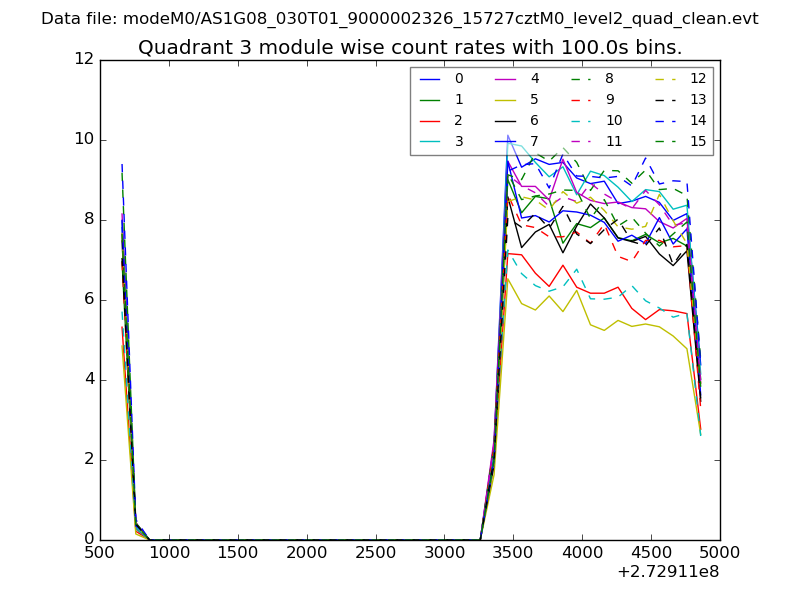
| Module-wise count rates for Quadrant C Data is divided into 100 sec bins |
 |
 |
| Module-wise count rates for Quadrant D Data is divided into 100 sec bins |
 |
 |
| Parameter | Plot |
|---|---|
| CZT HV Monitor | 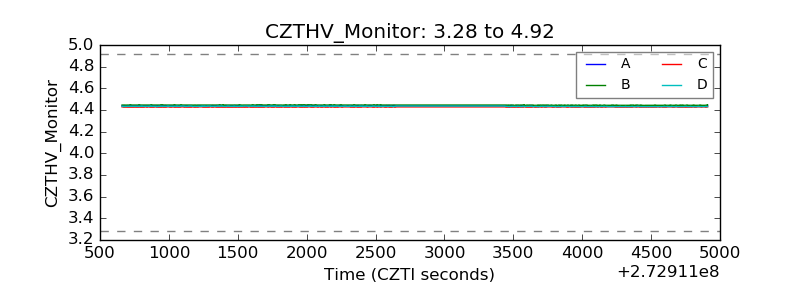 |
| D_VDD | 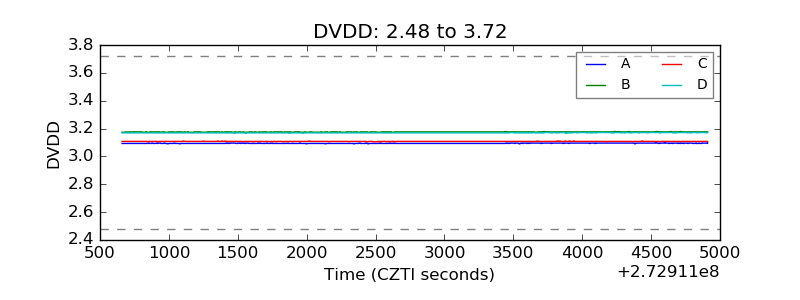 |
| Temperature 1 | 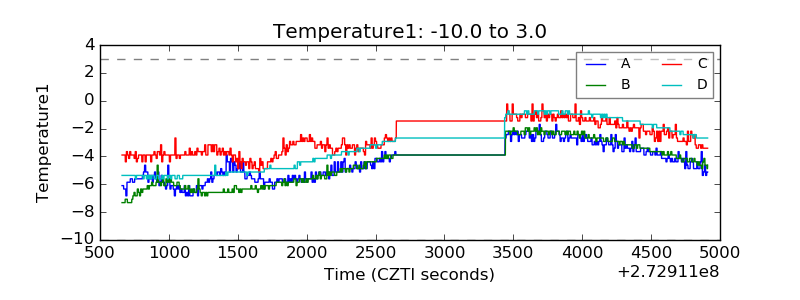 |
| Veto HV Monitor | 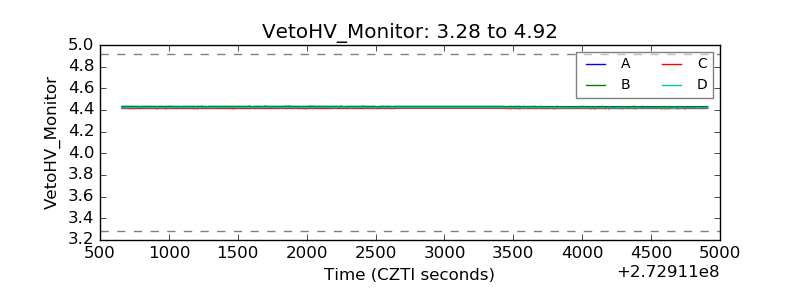 |
| Veto LLD | 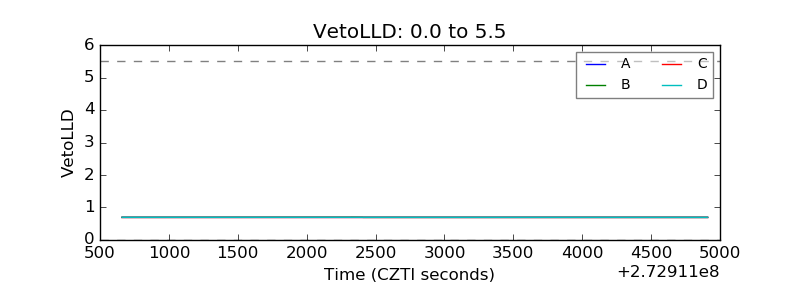 |
| Alpha Counter | 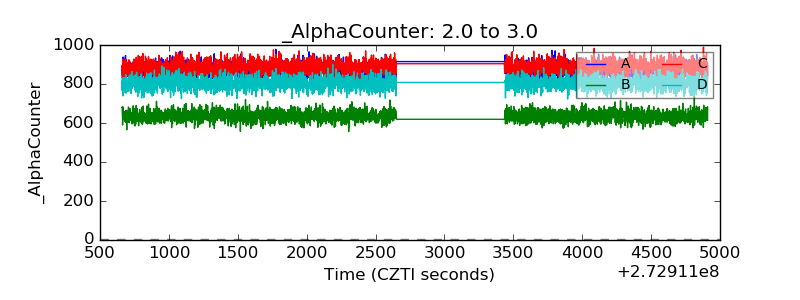 |
| _CPM_Rate | 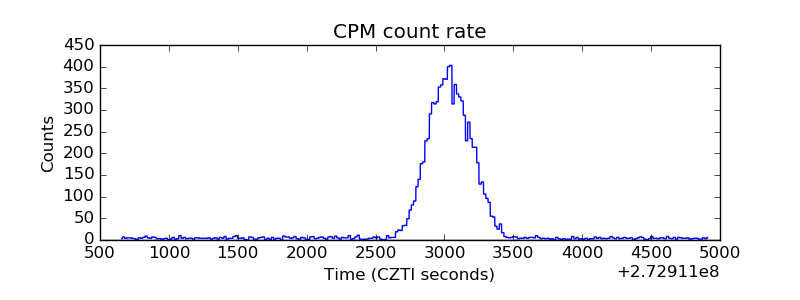 |
| CZT Counter | 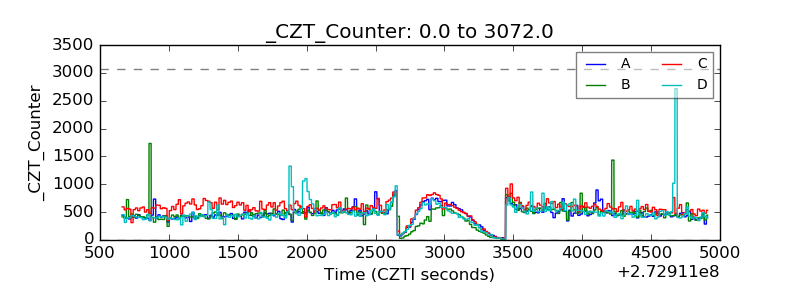 |
| +2.5 Volts monitor |  |
| +5 Volts monitor |  |
| _ROLL_ROT | 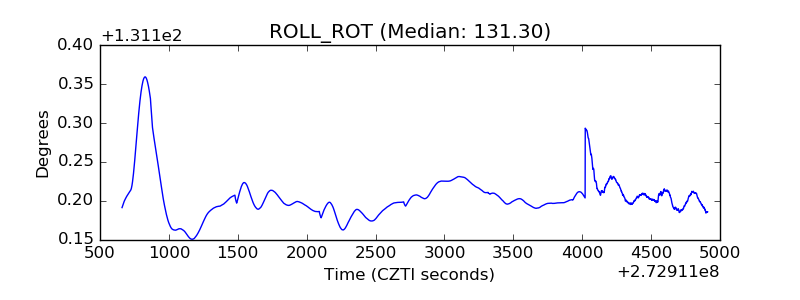 |
| _Roll_DEC | 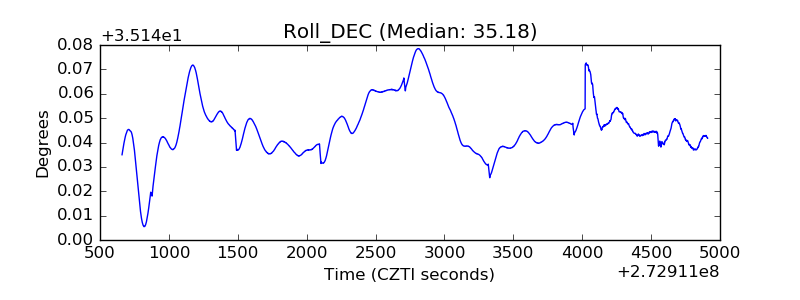 |
| _Roll_RA | 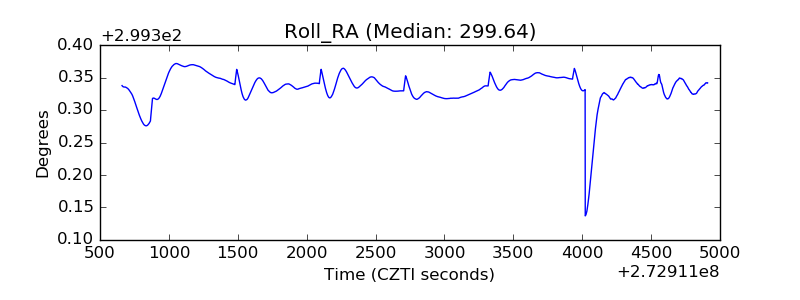 |
| Veto Counter |  |