| Param | Original file | Final file |
|---|---|---|
| Filename | modeM0/AS1G08_030T01_9000002326_15728cztM0_level2.evt | modeM0/AS1G08_030T01_9000002326_15728cztM0_level2_quad_clean.evt |
| Size (bytes) | 470,940,480 | 95,558,400 |
| Size | 449.1 MB | 91.1 MB |
| Events in quadrant A | 3,164,598 | 615,998 |
| Events in quadrant B | 3,312,812 | 620,234 |
| Events in quadrant C | 3,608,272 | 596,309 |
| Events in quadrant D | 3,714,350 | 587,067 |
| Mode SS | |||
|---|---|---|---|
| Quadrant | BADHDUFLAG | Total packets | Discarded packets |
| A | 0 | 138 | 0 |
| B | 0 | 138 | 0 |
| C | 0 | 138 | 0 |
| D | 0 | 138 | 0 |
| Mode M9 | |||
|---|---|---|---|
| Quadrant | BADHDUFLAG | Total packets | Discarded packets |
| A | 0 | 12 | 0 |
| B | 0 | 12 | 0 |
| C | 0 | 12 | 0 |
| D | 0 | 13 | 0 |
| Mode M0 | |||
|---|---|---|---|
| Quadrant | BADHDUFLAG | Total packets | Discarded packets |
| A | 0 | 14083 | 3 |
| B | 0 | 14380 | 2 |
| C | 0 | 14876 | 2 |
| D | 0 | 15785 | 2 |
| Quadrant | Total seconds | Saturated seconds | Saturation percentage |
|---|---|---|---|
| A | 6808 | 35 | 0.514101% |
| B | 6808 | 60 | 0.881316% |
| C | 6808 | 78 | 1.145711% |
| D | 6808 | 41 | 0.602233% |
Noise dominated data is calculated using 1-second bins in cleaned event files. If a bin has >2000 counts, and if more than 50% of those come from <1% of pixels, then it is considered to be noise-dominated and hence unusable.
| Quadrant | # 1 sec bins | Bins with >0 counts | Bins with >2000 counts | High rate bins dominated by noise | Noise dominated (total time) | Noise dominated (detector-on time) | Marked lightcurve |
|---|---|---|---|---|---|---|---|
| A | 7740 | 6810 | 3 | 3 | 0.04% | 0.04% | 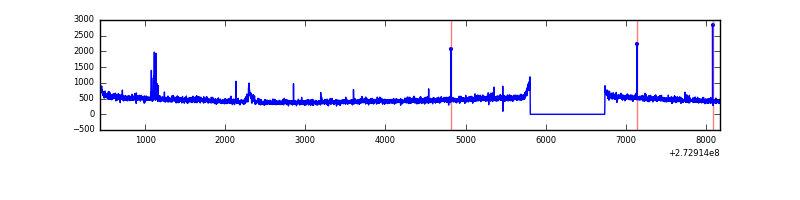 |
| B | 7740 | 6810 | 8 | 8 | 0.10% | 0.12% | 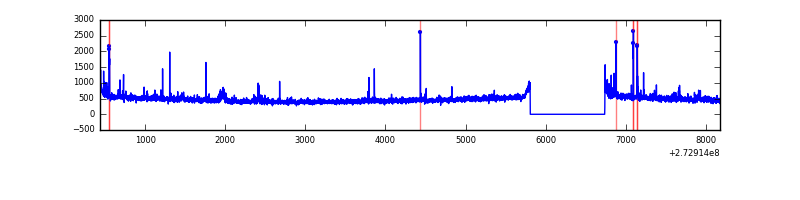 |
| C | 7740 | 6810 | 0 | 0 | 0.00% | 0.00% | 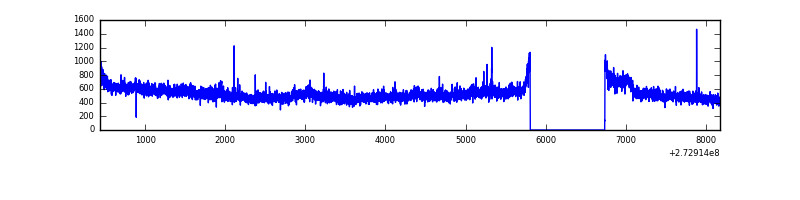 |
| D | 7740 | 6810 | 16 | 16 | 0.21% | 0.23% | 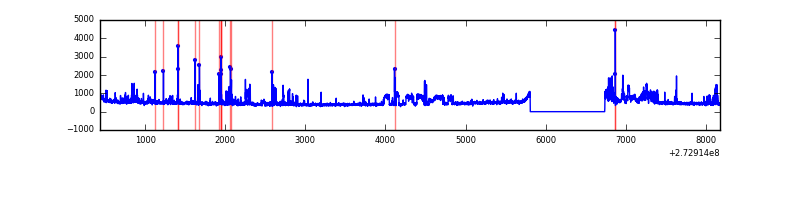 |
Top three noisy pixels from each quadrant. If the there are fewer than three noisy pixels in the level2.evt file, extra rows are filled as -1
| Pixel properties | Quadrant properties | ||||||
|---|---|---|---|---|---|---|---|
| Quadrant | DetID | PixID | Counts | Sigma | Mean | Median | Sigma |
| A | 15 | 239 | 40218 | 241.81 | 807 | 790 | 163.1 |
| A | 13 | 248 | 18196 | 106.75 | 807 | 790 | 163.1 |
| A | 9 | 143 | 7474 | 40.99 | 807 | 790 | 163.1 |
| B | 5 | 236 | 33783 | 211.23 | 808 | 787 | 156.2 |
| B | 4 | 216 | 30137 | 187.89 | 808 | 787 | 156.2 |
| B | 3 | 209 | 28956 | 180.33 | 808 | 787 | 156.2 |
| C | 3 | 233 | 426814 | 2342.34 | 781 | 786 | 181.9 |
| C | 14 | 238 | 120743 | 659.53 | 781 | 786 | 181.9 |
| C | 10 | 22 | 10331 | 52.48 | 781 | 786 | 181.9 |
| D | 12 | 110 | 410210 | 1948.2 | 782 | 764 | 210.2 |
| D | 1 | 52 | 251919 | 1195.03 | 782 | 764 | 210.2 |
| D | 10 | 172 | 29379 | 136.15 | 782 | 764 | 210.2 |
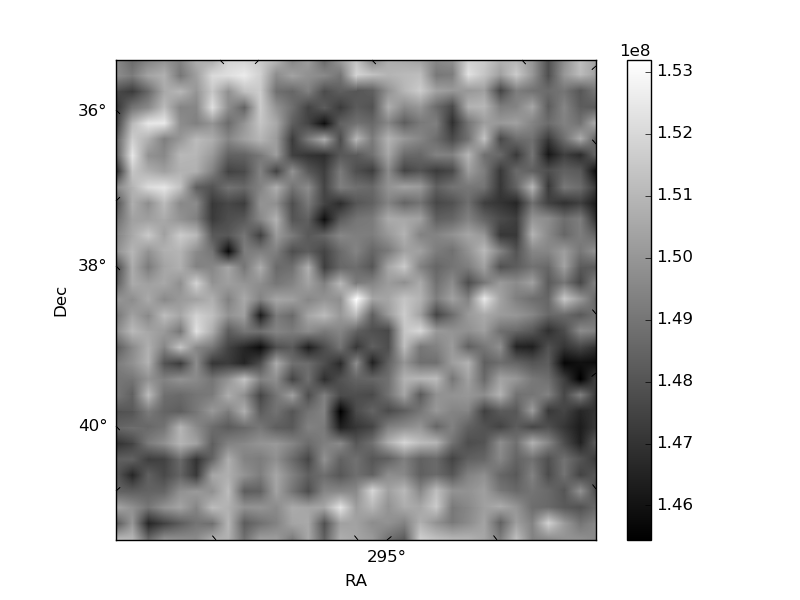
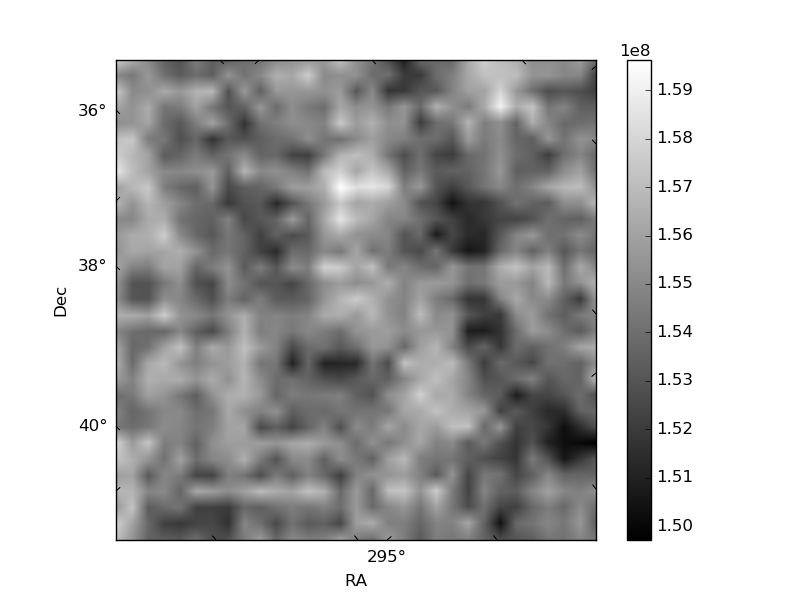
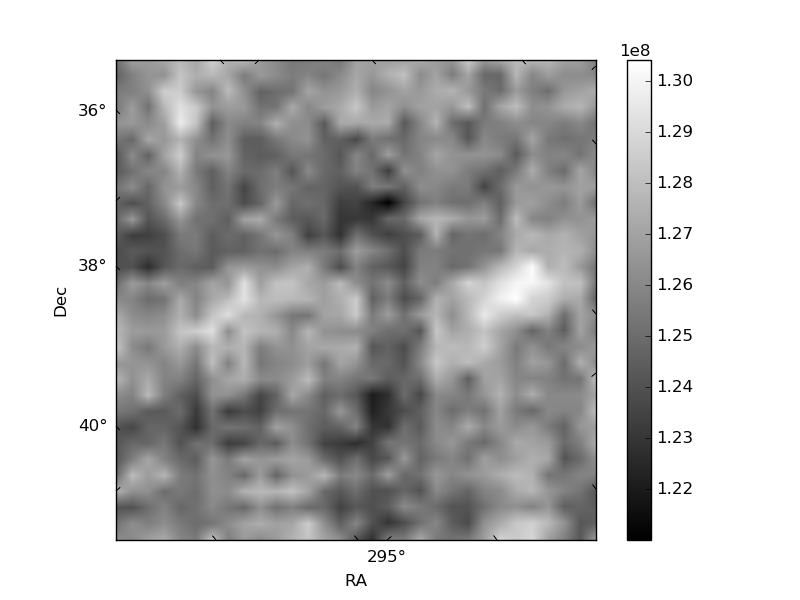
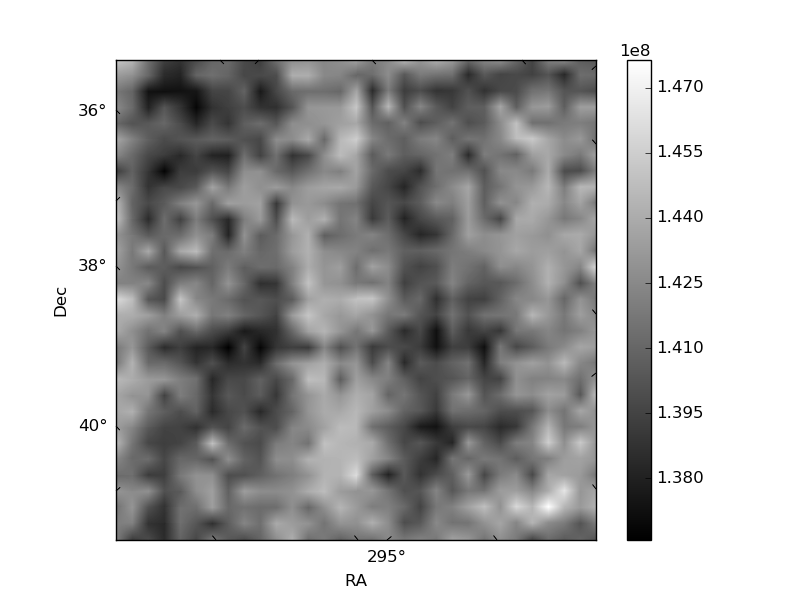
Histogram calculated using DETX and DETY for each event in the final _common_clean file
| Quadrant A |  |
 |
Quadrant B |
|---|---|---|---|
| Quadrant D |  |
 |
Quadrant C |
| Plot type | Count rate plots | Images |
|---|---|---|
| Comparison with Poisson distribution Blue bars denote a histogram of data divided into 1 sec bins. Red curve is a Poisson curve with rate = median count rate of data. |
 |
 |
| Quadrant-wise count rates Data is divided into 100 sec bins |
 |
|
| Module-wise count rates for Quadrant A Data is divided into 100 sec bins |
 |
 |
| Module-wise count rates for Quadrant B Data is divided into 100 sec bins |
 |
 |
| Module-wise count rates for Quadrant C Data is divided into 100 sec bins |
 |
 |
| Module-wise count rates for Quadrant D Data is divided into 100 sec bins |
 |
 |
| Parameter | Plot |
|---|---|
| CZT HV Monitor |  |
| D_VDD | 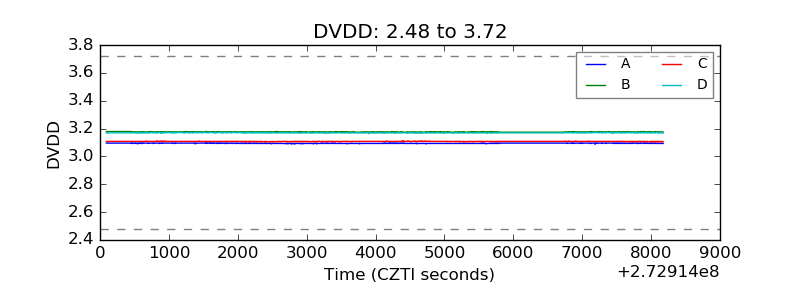 |
| Temperature 1 | 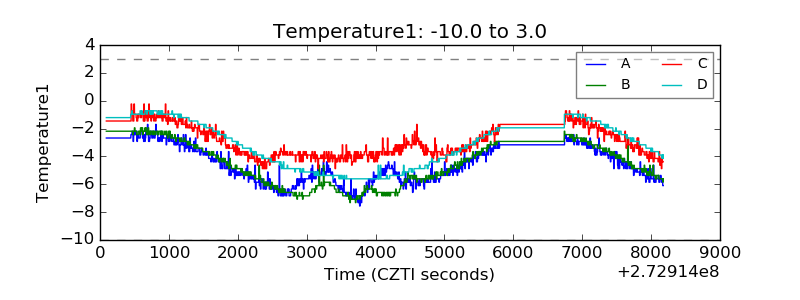 |
| Veto HV Monitor |  |
| Veto LLD | 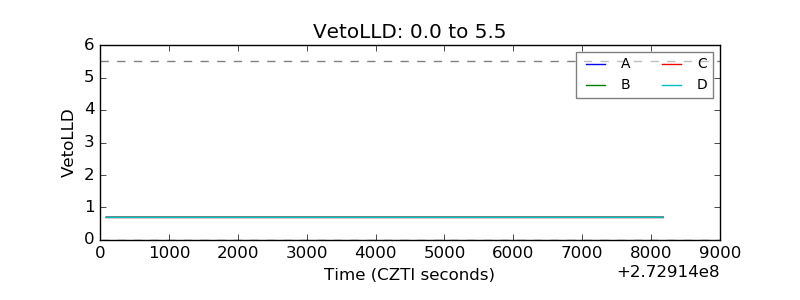 |
| Alpha Counter |  |
| _CPM_Rate |  |
| CZT Counter |  |
| +2.5 Volts monitor |  |
| +5 Volts monitor |  |
| _ROLL_ROT |  |
| _Roll_DEC |  |
| _Roll_RA |  |
| Veto Counter |  |