| Param | Original file | Final file |
|---|---|---|
| Filename | modeM0/AS1G08_030T01_9000002326_15731cztM0_level2.evt | modeM0/AS1G08_030T01_9000002326_15731cztM0_level2_quad_clean.evt |
| Size (bytes) | 453,147,840 | 93,182,400 |
| Size | 432.2 MB | 88.9 MB |
| Events in quadrant A | 3,003,723 | 606,674 |
| Events in quadrant B | 3,160,709 | 618,497 |
| Events in quadrant C | 3,446,997 | 587,336 |
| Events in quadrant D | 3,681,417 | 567,036 |
| Mode SS | |||
|---|---|---|---|
| Quadrant | BADHDUFLAG | Total packets | Discarded packets |
| A | 0 | 130 | 0 |
| B | 0 | 130 | 0 |
| C | 0 | 130 | 0 |
| D | 0 | 130 | 0 |
| Mode M9 | |||
|---|---|---|---|
| Quadrant | BADHDUFLAG | Total packets | Discarded packets |
| A | 0 | 17 | 0 |
| B | 0 | 17 | 0 |
| C | 0 | 17 | 0 |
| D | 0 | 18 | 0 |
| Mode M0 | |||
|---|---|---|---|
| Quadrant | BADHDUFLAG | Total packets | Discarded packets |
| A | 0 | 13154 | 3 |
| B | 0 | 13500 | 2 |
| C | 0 | 14261 | 2 |
| D | 0 | 15361 | 2 |
| Quadrant | Total seconds | Saturated seconds | Saturation percentage |
|---|---|---|---|
| A | 6336 | 38 | 0.599747% |
| B | 6336 | 47 | 0.741793% |
| C | 6336 | 81 | 1.278409% |
| D | 6336 | 154 | 2.430556% |
Noise dominated data is calculated using 1-second bins in cleaned event files. If a bin has >2000 counts, and if more than 50% of those come from <1% of pixels, then it is considered to be noise-dominated and hence unusable.
| Quadrant | # 1 sec bins | Bins with >0 counts | Bins with >2000 counts | High rate bins dominated by noise | Noise dominated (total time) | Noise dominated (detector-on time) | Marked lightcurve |
|---|---|---|---|---|---|---|---|
| A | 7512 | 6338 | 6 | 6 | 0.08% | 0.09% | 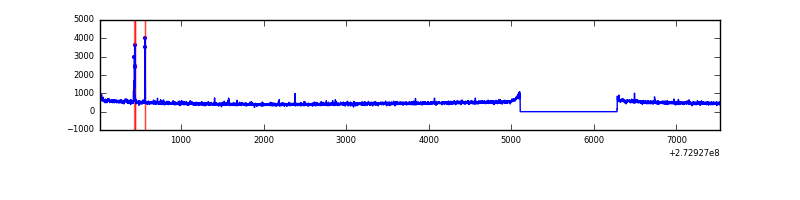 |
| B | 7512 | 6338 | 3 | 3 | 0.04% | 0.05% | 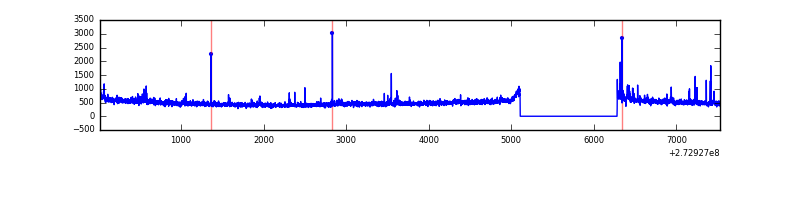 |
| C | 7512 | 6338 | 0 | 0 | 0.00% | 0.00% | 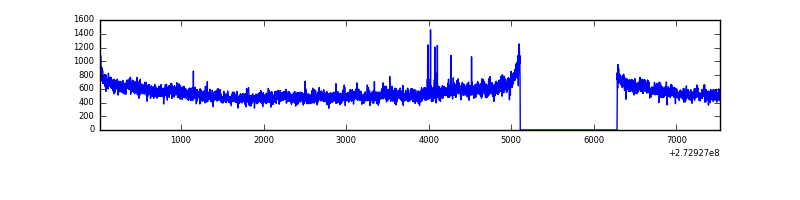 |
| D | 7512 | 6338 | 115 | 115 | 1.53% | 1.81% | 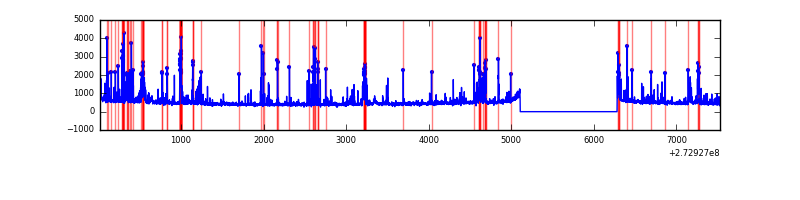 |
Top three noisy pixels from each quadrant. If the there are fewer than three noisy pixels in the level2.evt file, extra rows are filled as -1
| Pixel properties | Quadrant properties | ||||||
|---|---|---|---|---|---|---|---|
| Quadrant | DetID | PixID | Counts | Sigma | Mean | Median | Sigma |
| A | 15 | 239 | 39676 | 252.61 | 767 | 750 | 154.1 |
| A | 15 | 157 | 9715 | 58.18 | 767 | 750 | 154.1 |
| A | 0 | 226 | 6778 | 39.12 | 767 | 750 | 154.1 |
| B | 4 | 216 | 29359 | 195.14 | 774 | 755 | 146.6 |
| B | 3 | 209 | 20795 | 136.72 | 774 | 755 | 146.6 |
| B | 5 | 65 | 19082 | 125.03 | 774 | 755 | 146.6 |
| C | 3 | 233 | 394652 | 2263.76 | 744 | 752 | 174.0 |
| C | 14 | 238 | 116445 | 664.89 | 744 | 752 | 174.0 |
| C | 9 | 54 | 15587 | 85.26 | 744 | 752 | 174.0 |
| D | 1 | 52 | 800597 | 4121.42 | 736 | 719 | 194.1 |
| D | 12 | 221 | 46208 | 234.38 | 736 | 719 | 194.1 |
| D | 2 | 234 | 24099 | 120.47 | 736 | 719 | 194.1 |
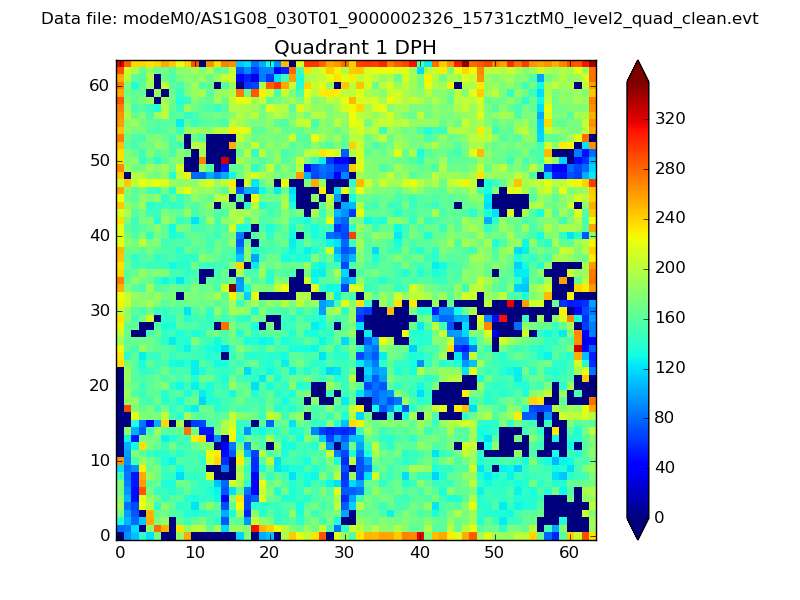
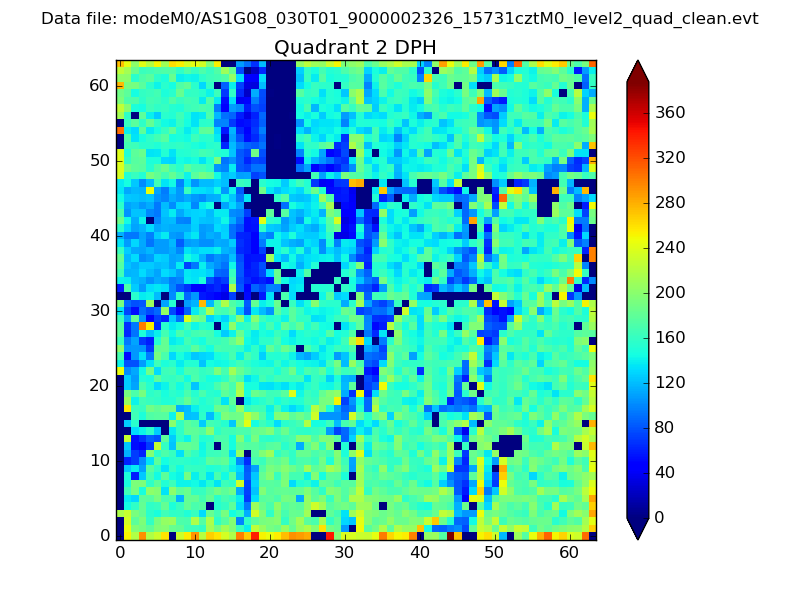
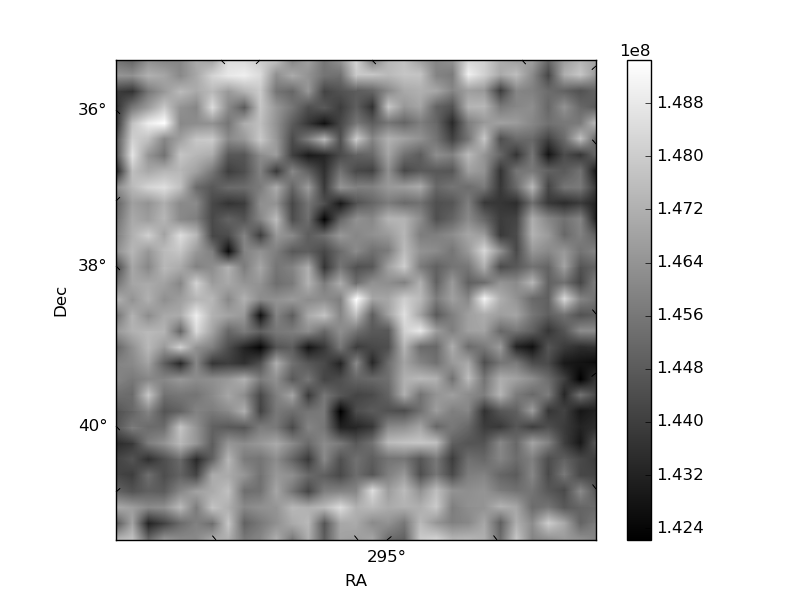
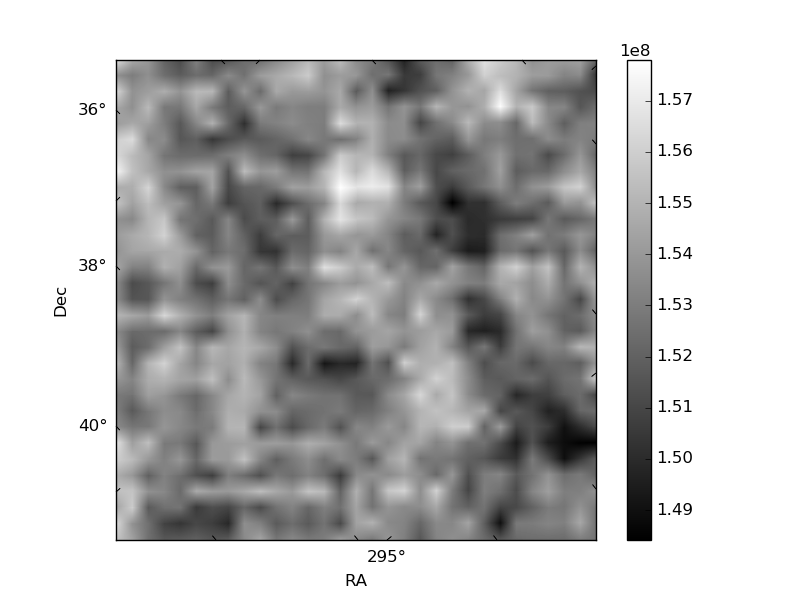
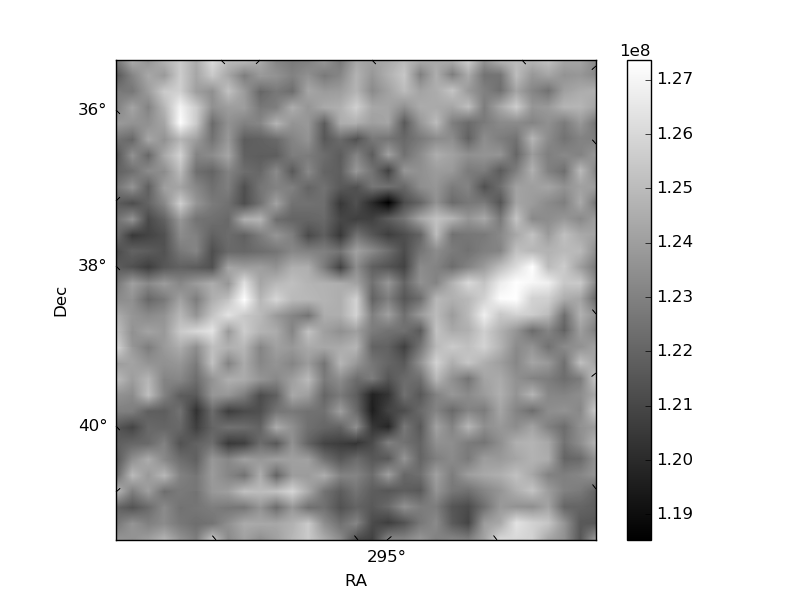
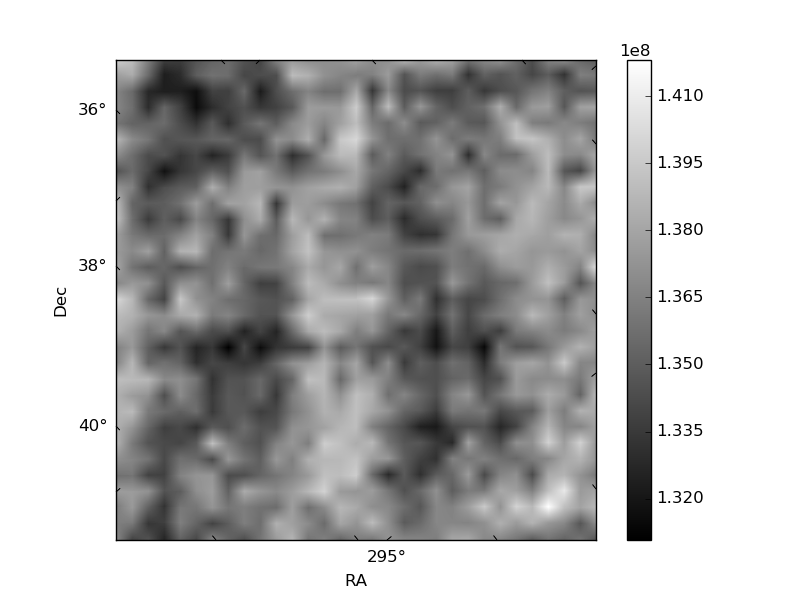
Histogram calculated using DETX and DETY for each event in the final _common_clean file
| Quadrant A |  |
 |
Quadrant B |
|---|---|---|---|
| Quadrant D |  |
 |
Quadrant C |
| Plot type | Count rate plots | Images |
|---|---|---|
| Comparison with Poisson distribution Blue bars denote a histogram of data divided into 1 sec bins. Red curve is a Poisson curve with rate = median count rate of data. |
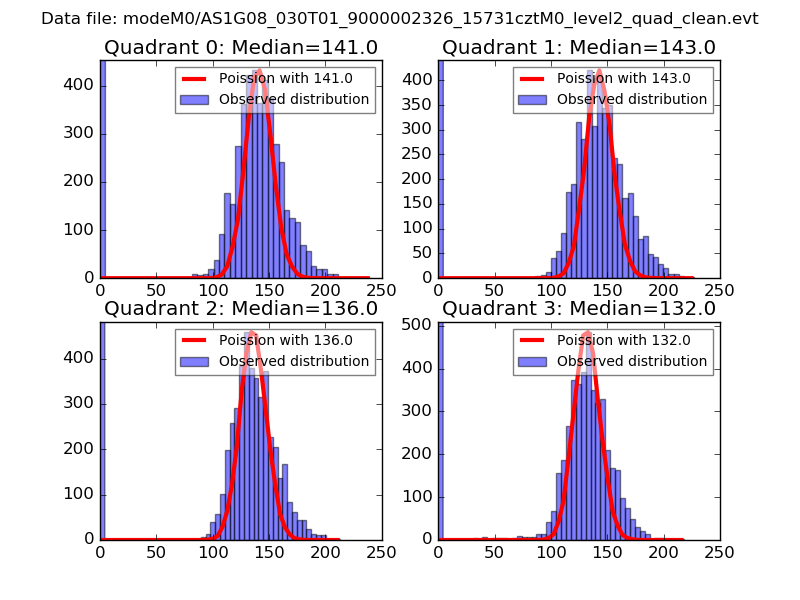 |
 |
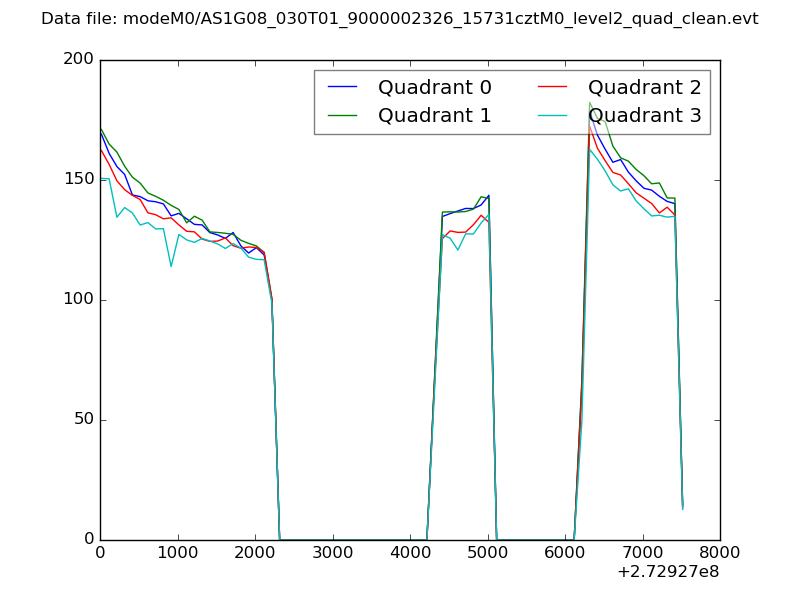
| Quadrant-wise count rates Data is divided into 100 sec bins |
 |
|
| Module-wise count rates for Quadrant A Data is divided into 100 sec bins |
 |
 |
| Module-wise count rates for Quadrant B Data is divided into 100 sec bins |
 |
 |
| Module-wise count rates for Quadrant C Data is divided into 100 sec bins |
 |
 |
| Module-wise count rates for Quadrant D Data is divided into 100 sec bins |
 |
 |
| Parameter | Plot |
|---|---|
| CZT HV Monitor |  |
| D_VDD | 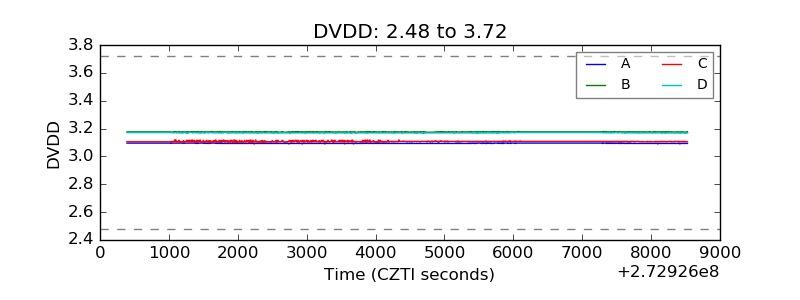 |
| Temperature 1 | 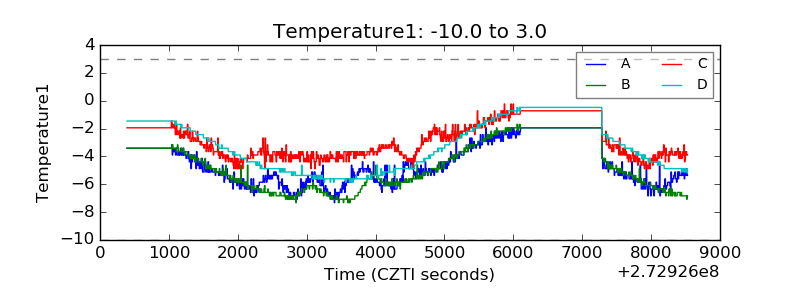 |
| Veto HV Monitor | 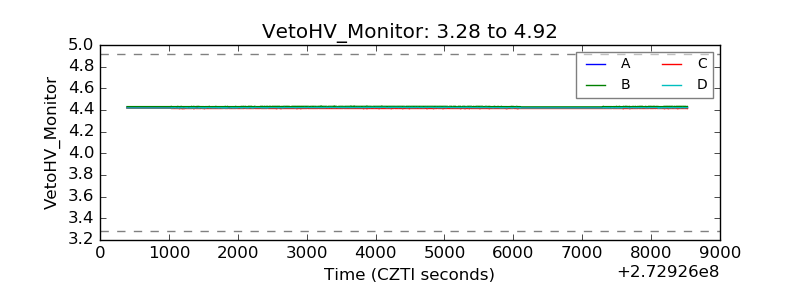 |
| Veto LLD | 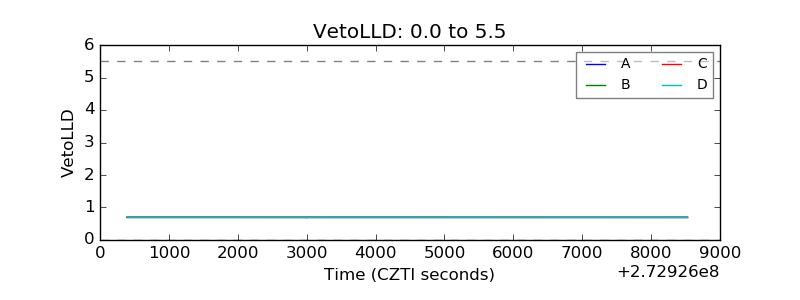 |
| Alpha Counter | 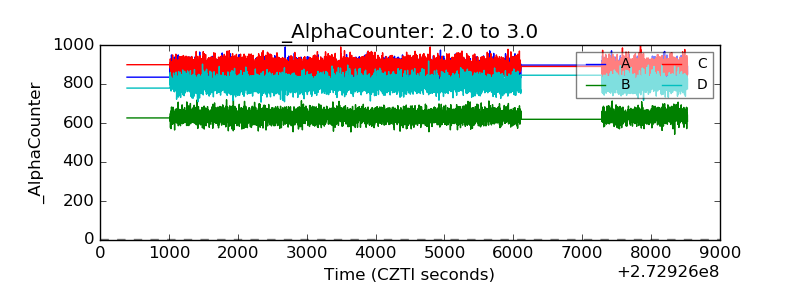 |
| _CPM_Rate | 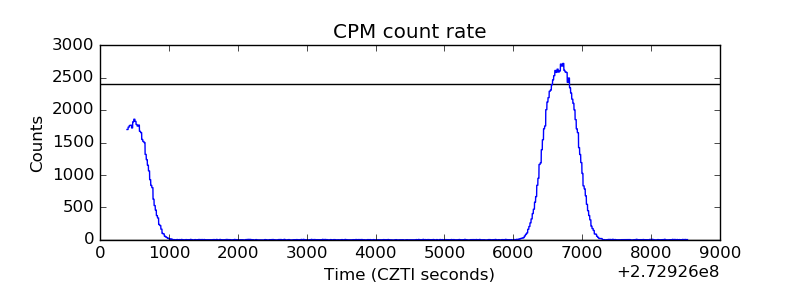 |
| CZT Counter | 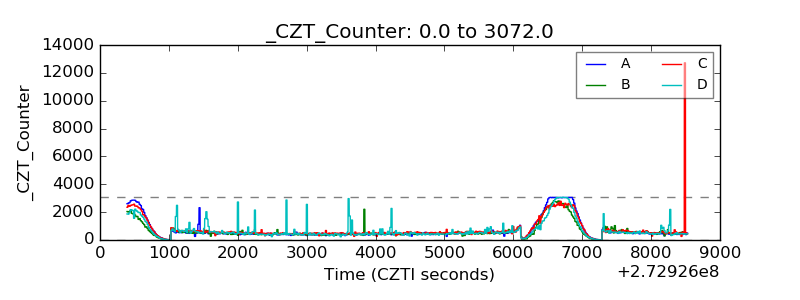 |
| +2.5 Volts monitor |  |
| +5 Volts monitor | 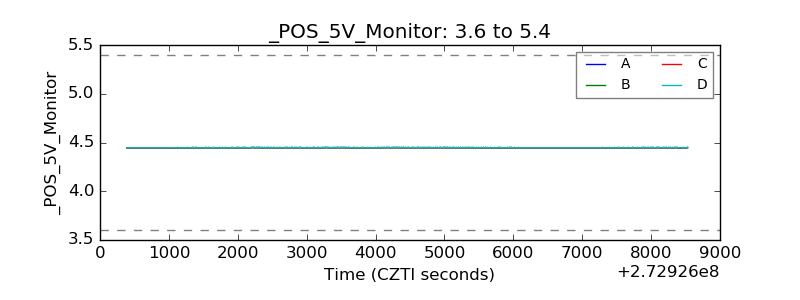 |
| _ROLL_ROT |  |
| _Roll_DEC | 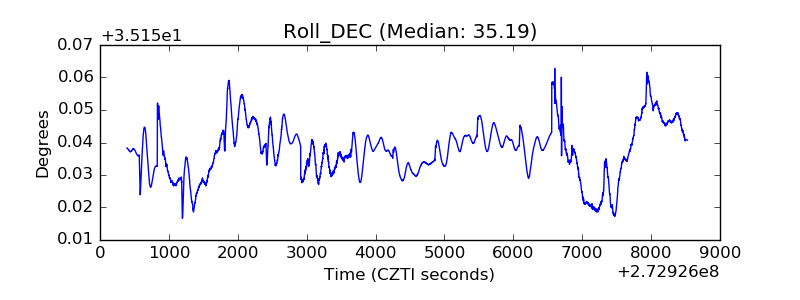 |
| _Roll_RA | 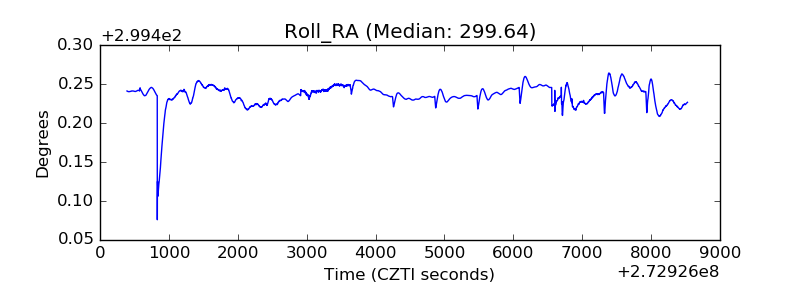 |
| Veto Counter | 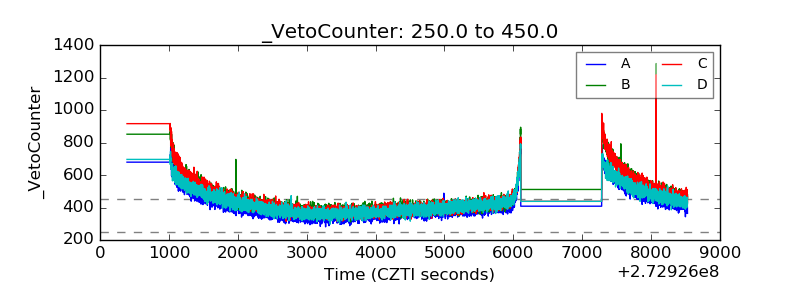 |