| Param | Original file | Final file |
|---|---|---|
| Filename | modeM0/AS1T02_066T01_9000002324cztM0_level2.fits | modeM0/AS1T02_066T01_9000002324cztM0_level2_quad_clean.evt |
| Size (bytes) | 168,232,320 | 155,252,160 |
| Size | 160.4 MB | 148.1 MB |
| Events in quadrant A | 1,006,498 | 913,363 |
| Events in quadrant B | 980,322 | 926,700 |
| Events in quadrant C | 994,646 | 858,770 |
| Events in quadrant D | 839,222 | 728,760 |
| Mode M0 | |||
|---|---|---|---|
| Quadrant | BADHDUFLAG | Total packets | Discarded packets |
| A | 0 | 40123 | 0 |
| B | 0 | 39258 | 0 |
| C | 0 | 44188 | 0 |
| D | 0 | 54200 | 0 |
| Mode M9 | |||
|---|---|---|---|
| Quadrant | BADHDUFLAG | Total packets | Discarded packets |
| A | 0 | 12 | 0 |
| B | 0 | 12 | 0 |
| C | 0 | 12 | 0 |
| D | 0 | 12 | 0 |
| Mode SS | |||
|---|---|---|---|
| Quadrant | BADHDUFLAG | Total packets | Discarded packets |
| A | 0 | 374 | 0 |
| B | 0 | 374 | 0 |
| C | 0 | 374 | 0 |
| D | 0 | 374 | 0 |
| Quadrant | Total seconds | Saturated seconds | Saturation percentage |
|---|---|---|---|
| A | 18483 | 624 | 3.376075% |
| B | 18483 | 422 | 2.283179% |
| C | 18483 | 624 | 3.376075% |
| D | 18483 | 1623 | 8.781042% |
Noise dominated data is calculated using 1-second bins in cleaned event files. If a bin has >2000 counts, and if more than 50% of those come from <1% of pixels, then it is considered to be noise-dominated and hence unusable.
| Quadrant | # 1 sec bins | Bins with >0 counts | Bins with >2000 counts | High rate bins dominated by noise | Noise dominated (total time) | Noise dominated (detector-on time) | Marked lightcurve |
|---|---|---|---|---|---|---|---|
| A | 19648 | 18483 | 0 | 0 | 0.00% | 0.00% | 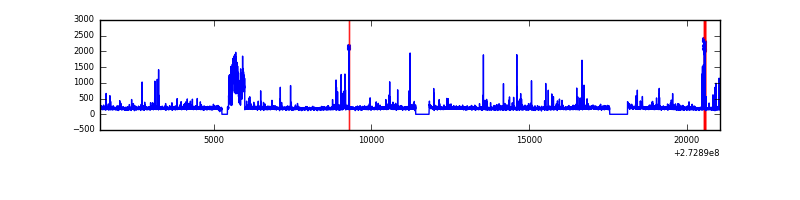 |
| B | 19648 | 18483 | 0 | 0 | 0.00% | 0.00% | 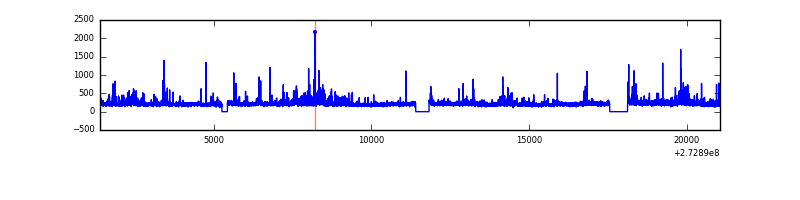 |
| C | 19648 | 18484 | 0 | 0 | 0.00% | 0.00% | 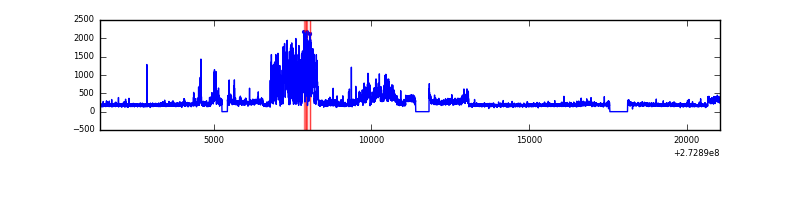 |
| D | 19648 | 18473 | 0 | 0 | 0.00% | 0.00% | 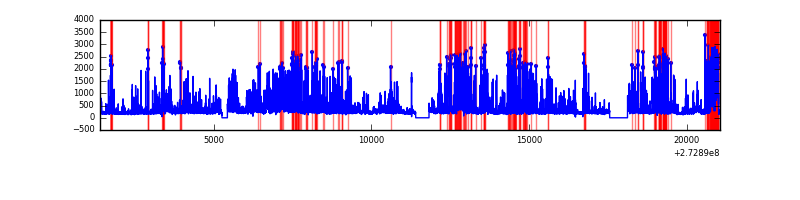 |
Top three noisy pixels from each quadrant. If the there are fewer than three noisy pixels in the level2.evt file, extra rows are filled as -1
| Pixel properties | Quadrant properties | ||||||
|---|---|---|---|---|---|---|---|
| Quadrant | DetID | PixID | Counts | Sigma | Mean | Median | Sigma |
| A | 0 | 29 | 976 | 10.84 | 261 | 244 | 67.5 |
| A | 7 | 110 | 835 | 8.76 | 261 | 244 | 67.5 |
| A | 15 | 236 | 755 | 7.57 | 261 | 244 | 67.5 |
| B | 2 | 9 | 841 | 11.0 | 258 | 245 | 54.2 |
| B | 2 | 8 | 703 | 8.45 | 258 | 245 | 54.2 |
| B | 5 | 225 | 669 | 7.82 | 258 | 245 | 54.2 |
| C | 1 | 80 | 766 | 7.49 | 262 | 243 | 69.8 |
| C | 1 | 81 | 723 | 6.87 | 262 | 243 | 69.8 |
| C | 3 | 126 | 672 | 6.14 | 262 | 243 | 69.8 |
| D | 1 | 19 | 623 | 6.25 | 238 | 216 | 65.1 |
| D | 3 | 14 | 620 | 6.2 | 238 | 216 | 65.1 |
| D | 6 | 231 | 596 | 5.83 | 238 | 216 | 65.1 |
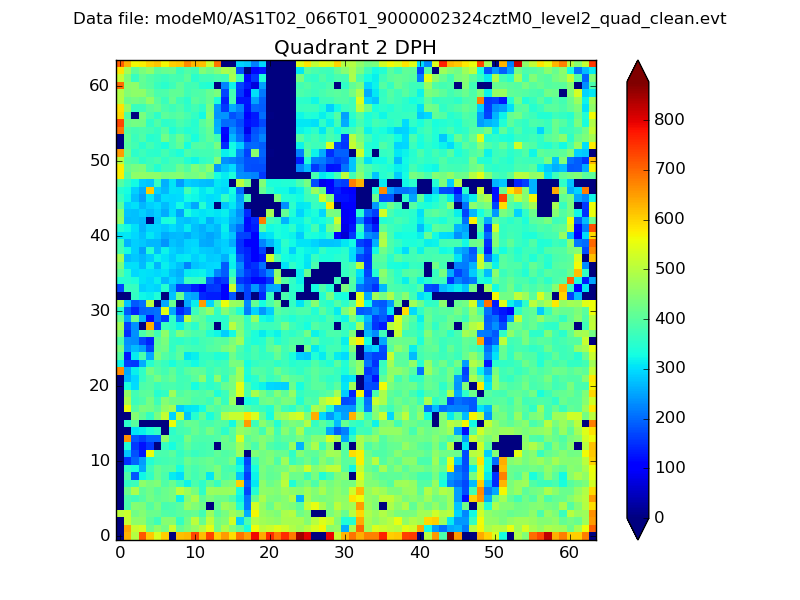
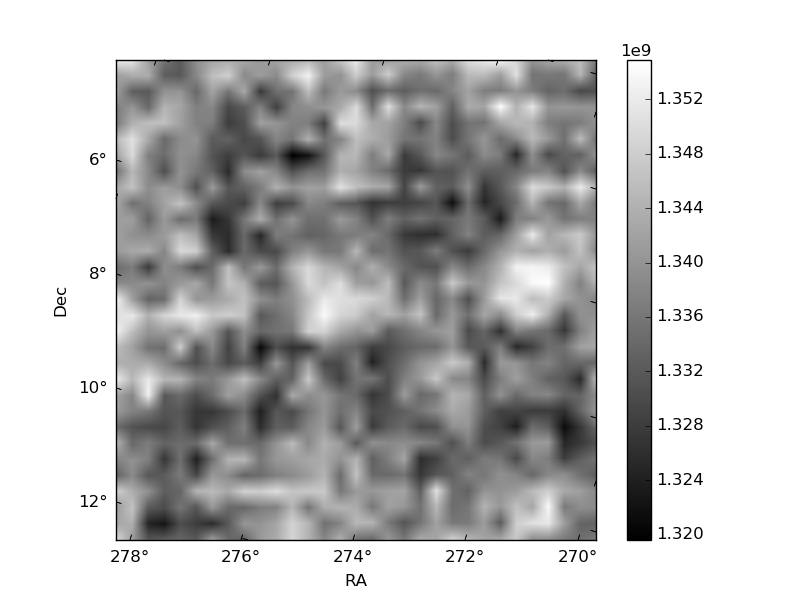
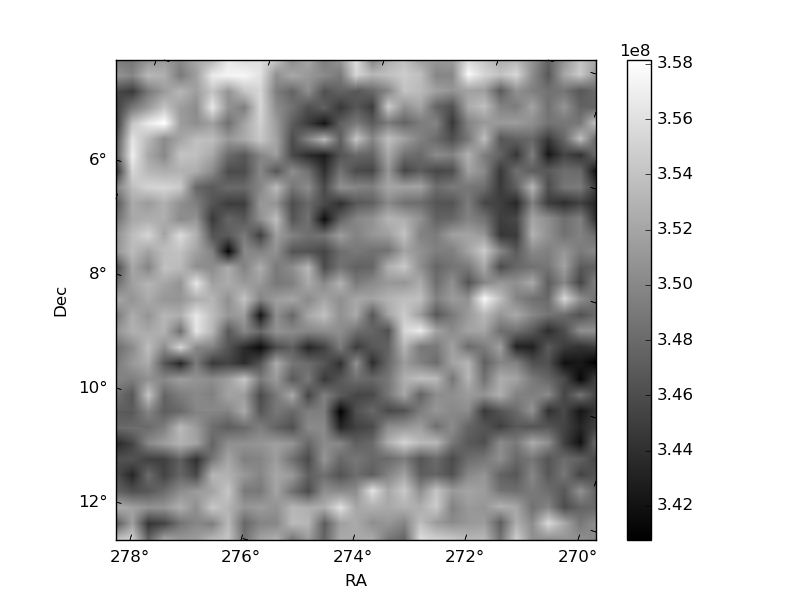
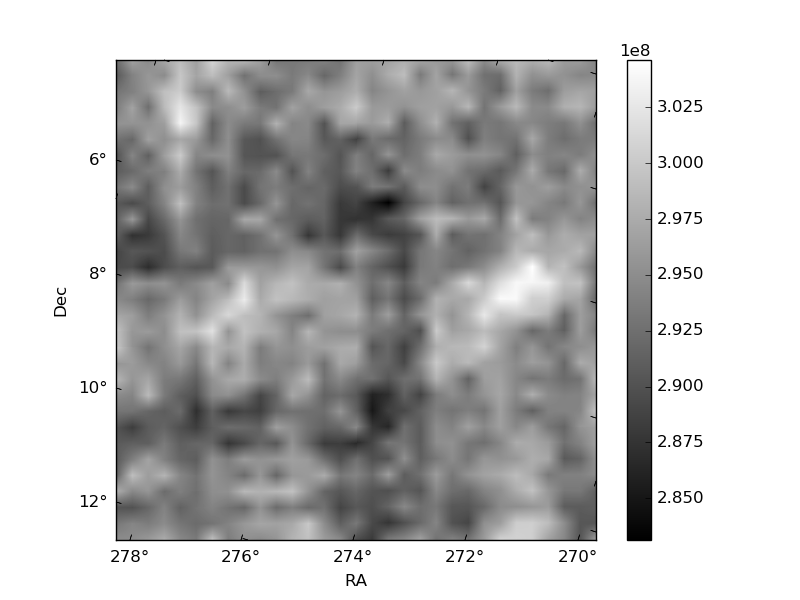
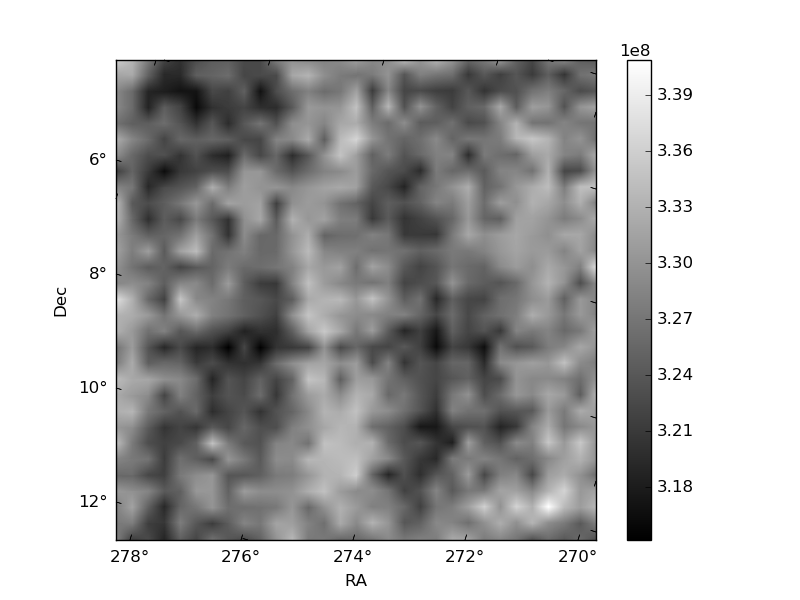
Histogram calculated using DETX and DETY for each event in the final _common_clean file
| Quadrant A | 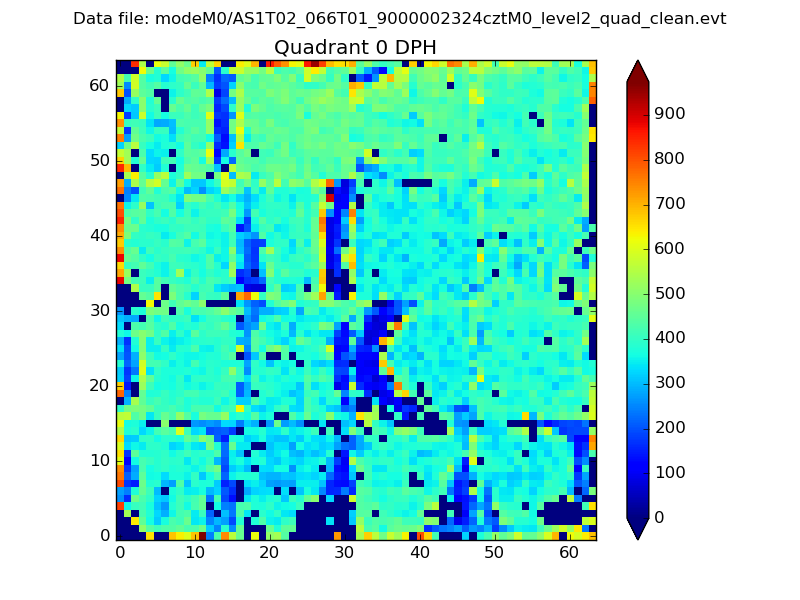 |
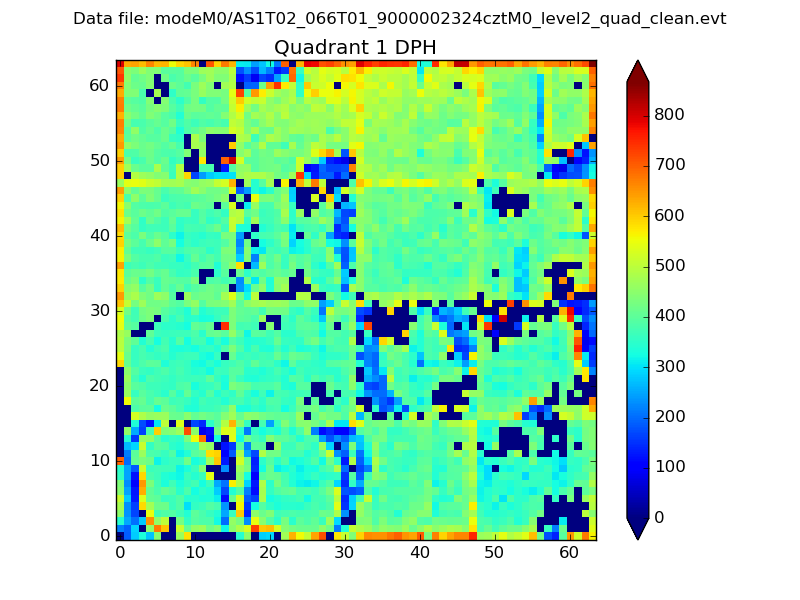 |
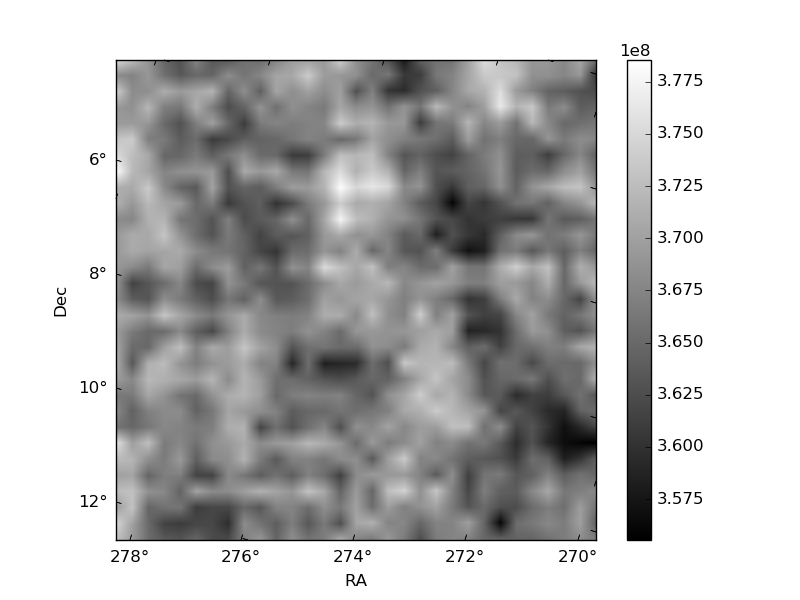
Quadrant B |
|---|---|---|---|
| Quadrant D | 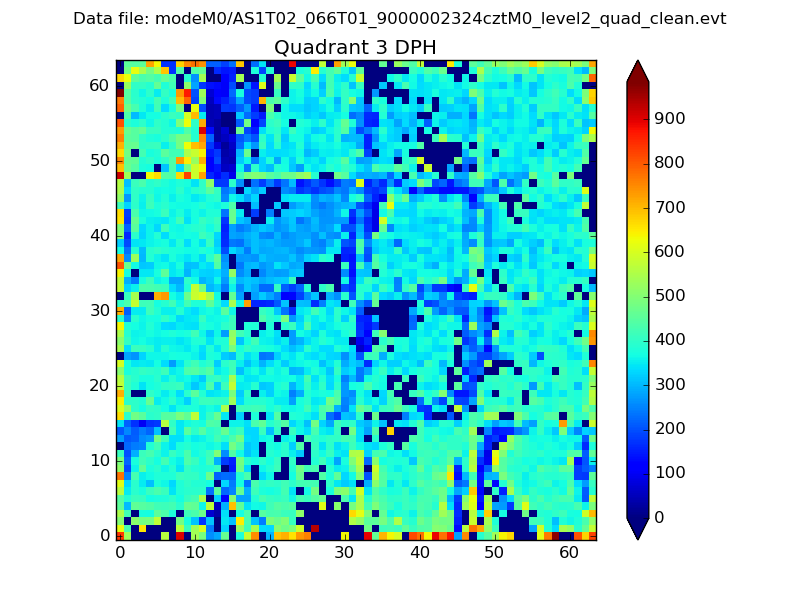 |
 |
Quadrant C |
| Plot type | Count rate plots | Images |
|---|---|---|
| Comparison with Poisson distribution Blue bars denote a histogram of data divided into 1 sec bins. Red curve is a Poisson curve with rate = median count rate of data. |
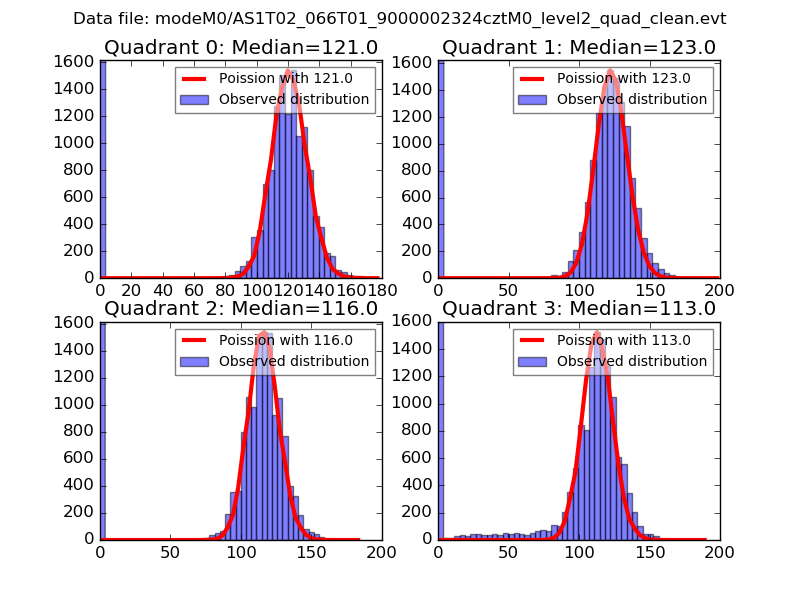 |
 |
| Quadrant-wise count rates Data is divided into 100 sec bins |
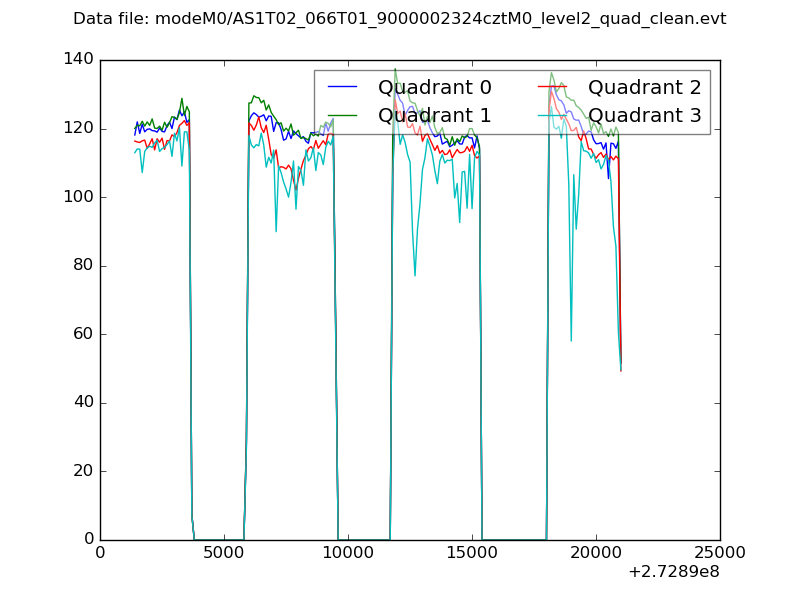 |
|
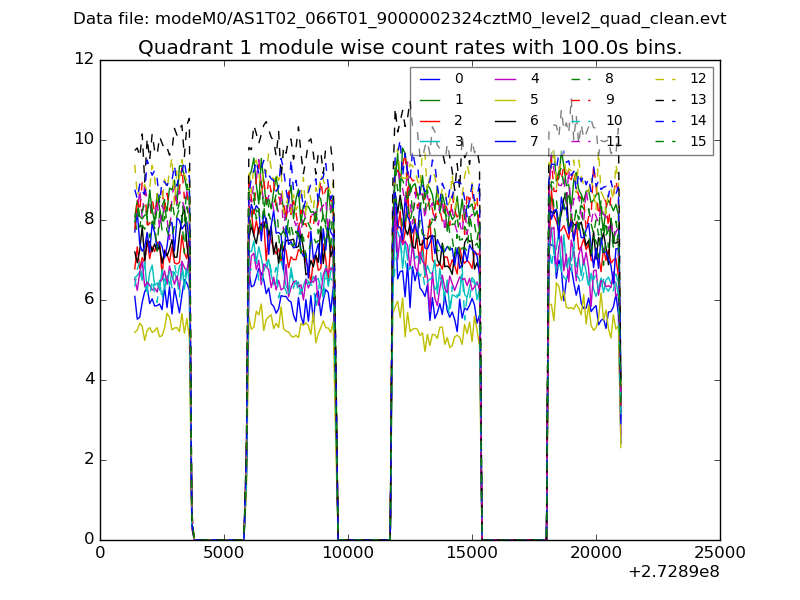
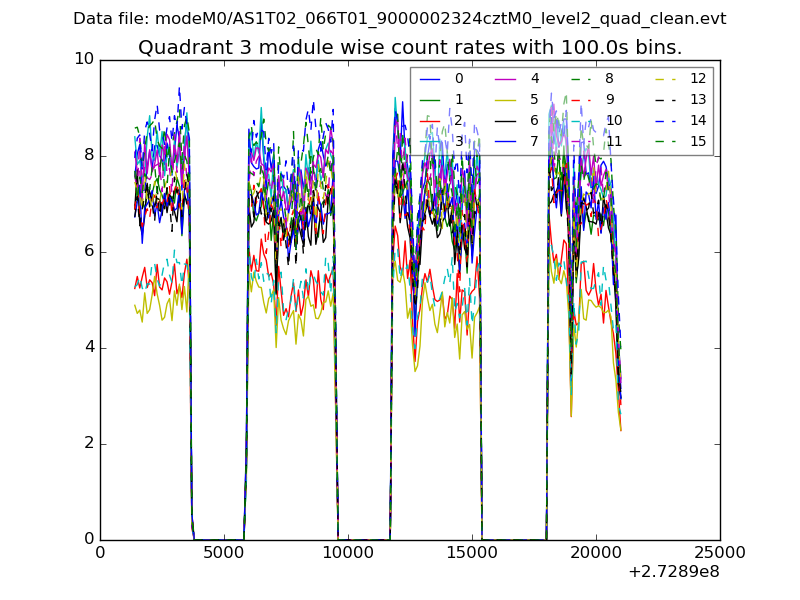
| Module-wise count rates for Quadrant A Data is divided into 100 sec bins |
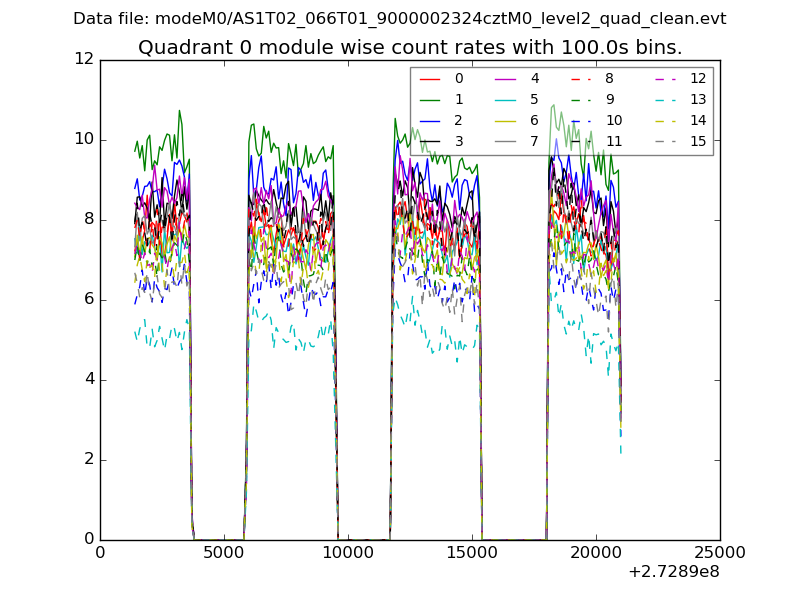 |
 |
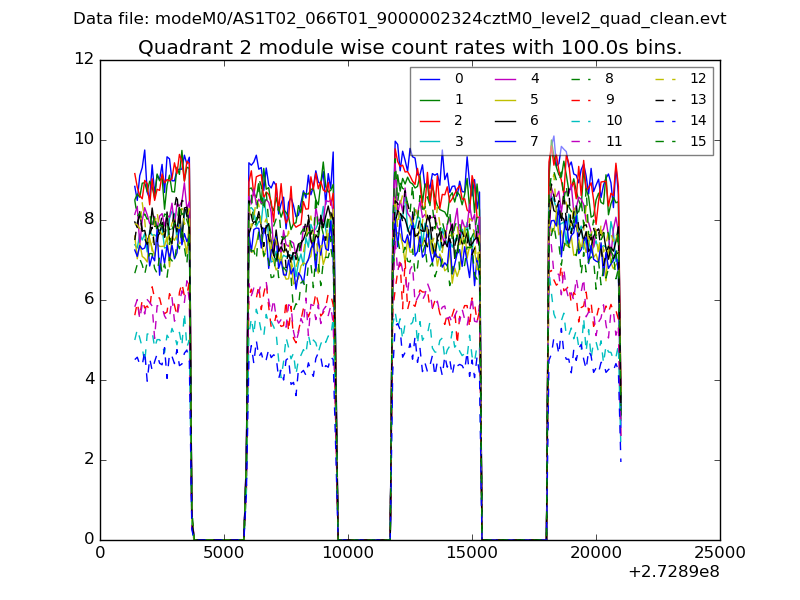
| Module-wise count rates for Quadrant B Data is divided into 100 sec bins |
 |
 |
| Module-wise count rates for Quadrant C Data is divided into 100 sec bins |
 |
 |
| Module-wise count rates for Quadrant D Data is divided into 100 sec bins |
 |
 |
| Parameter | Plot |
|---|---|
| CZT HV Monitor | 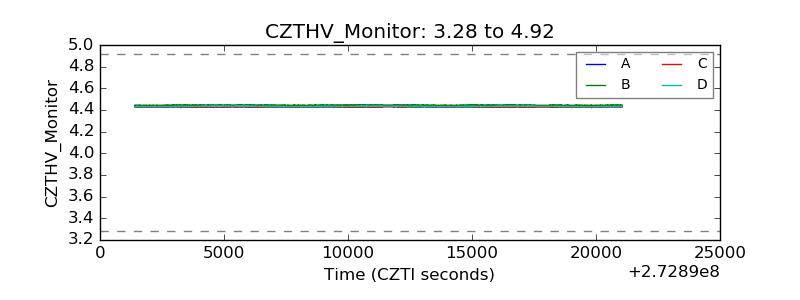 |
| D_VDD | 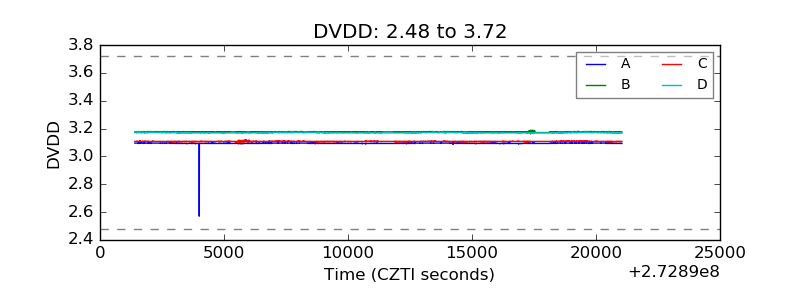 |
| Temperature 1 | 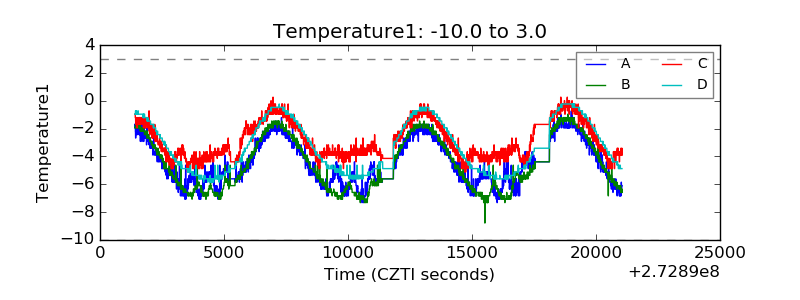 |
| Veto HV Monitor | 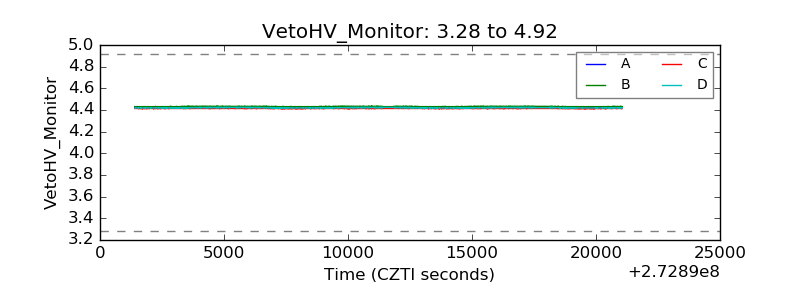 |
| Veto LLD | 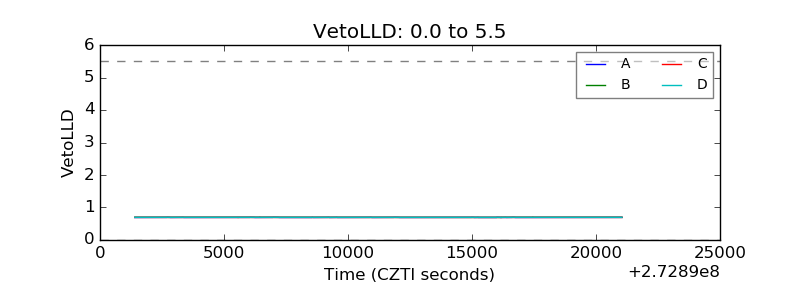 |
| Alpha Counter | 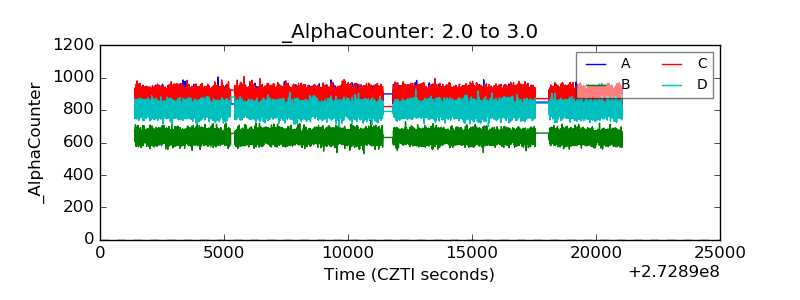 |
| _CPM_Rate | 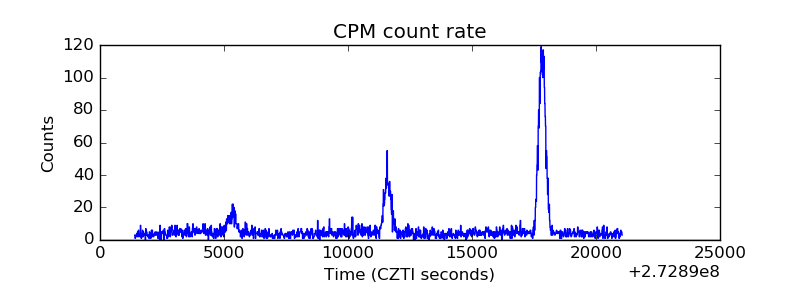 |
| CZT Counter | 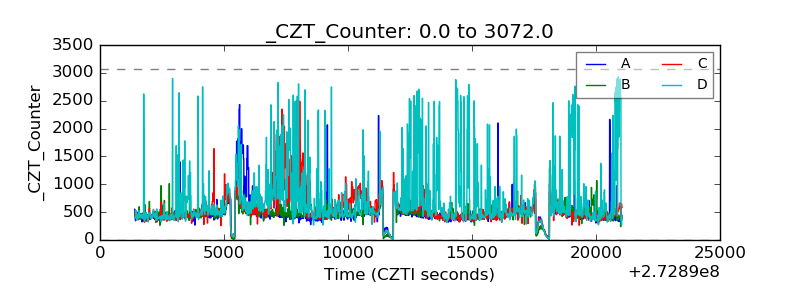 |
| +2.5 Volts monitor | 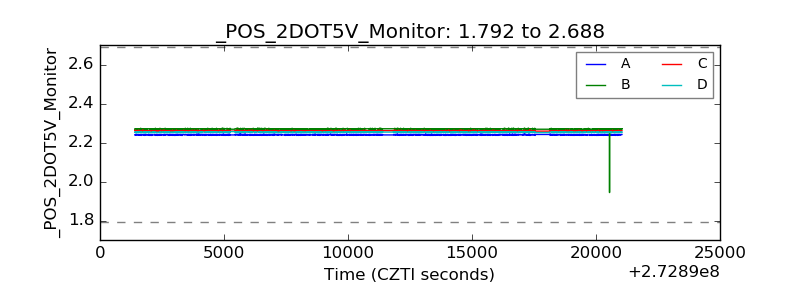 |
| +5 Volts monitor | 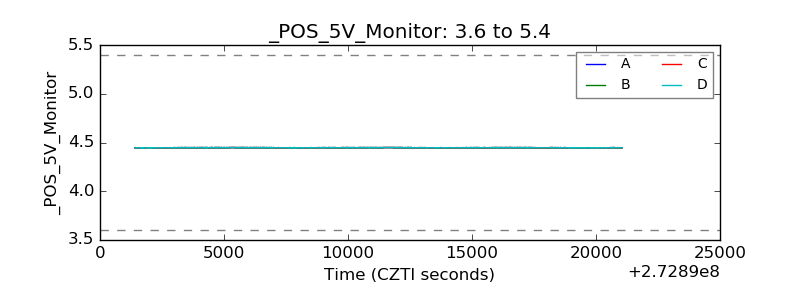 |
| _ROLL_ROT | 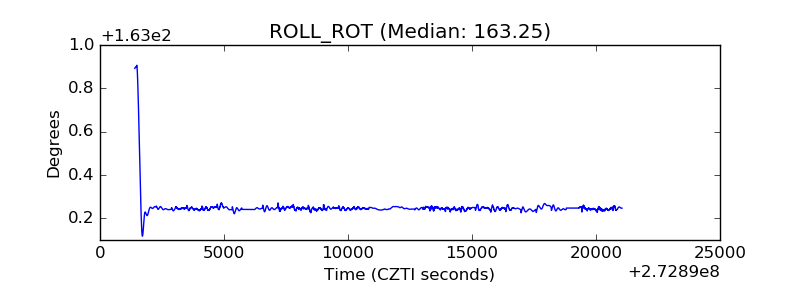 |
| _Roll_DEC | 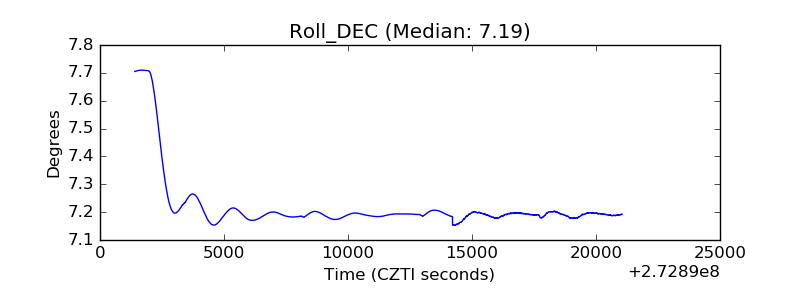 |
| _Roll_RA | 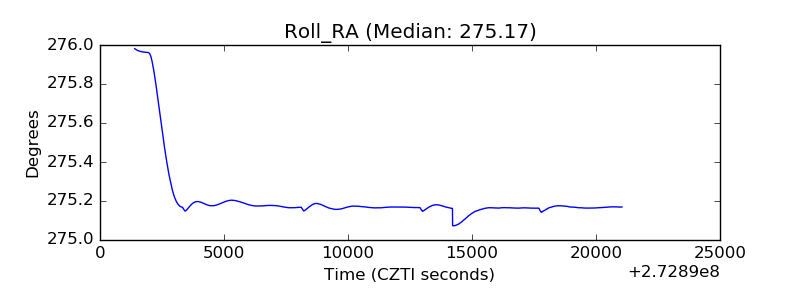 |
| Veto Counter | 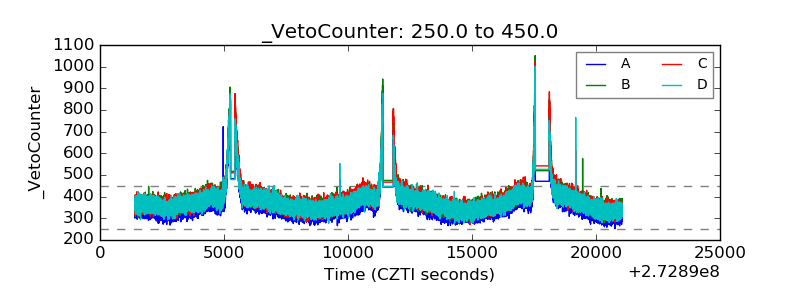 |