| Param | Original file | Final file |
|---|---|---|
| Filename | modeM0/AS1T02_066T01_9000002324_15724cztM0_level2.evt | modeM0/AS1T02_066T01_9000002324_15724cztM0_level2_quad_clean.evt |
| Size (bytes) | 445,000,320 | 69,171,840 |
| Size | 424.4 MB | 66.0 MB |
| Events in quadrant A | 3,167,199 | 433,707 |
| Events in quadrant B | 2,851,043 | 441,065 |
| Events in quadrant C | 3,169,413 | 419,025 |
| Events in quadrant D | 3,904,612 | 405,136 |
| Mode M0 | |||
|---|---|---|---|
| Quadrant | BADHDUFLAG | Total packets | Discarded packets |
| A | 0 | 13279 | 2 |
| B | 0 | 12062 | 1 |
| C | 0 | 13244 | 1 |
| D | 0 | 15510 | 1 |
| Mode M9 | |||
|---|---|---|---|
| Quadrant | BADHDUFLAG | Total packets | Discarded packets |
| A | 0 | 2 | 0 |
| B | 0 | 2 | 0 |
| C | 0 | 2 | 0 |
| D | 0 | 2 | 0 |
| Mode SS | |||
|---|---|---|---|
| Quadrant | BADHDUFLAG | Total packets | Discarded packets |
| A | 0 | 114 | 0 |
| B | 0 | 114 | 0 |
| C | 0 | 114 | 0 |
| D | 0 | 114 | 0 |
| Quadrant | Total seconds | Saturated seconds | Saturation percentage |
|---|---|---|---|
| A | 5657 | 417 | 7.371398% |
| B | 5657 | 246 | 4.348595% |
| C | 5657 | 293 | 5.179424% |
| D | 5657 | 462 | 8.166873% |
Noise dominated data is calculated using 1-second bins in cleaned event files. If a bin has >2000 counts, and if more than 50% of those come from <1% of pixels, then it is considered to be noise-dominated and hence unusable.
| Quadrant | # 1 sec bins | Bins with >0 counts | Bins with >2000 counts | High rate bins dominated by noise | Noise dominated (total time) | Noise dominated (detector-on time) | Marked lightcurve |
|---|---|---|---|---|---|---|---|
| A | 5833 | 5659 | 92 | 92 | 1.58% | 1.63% | 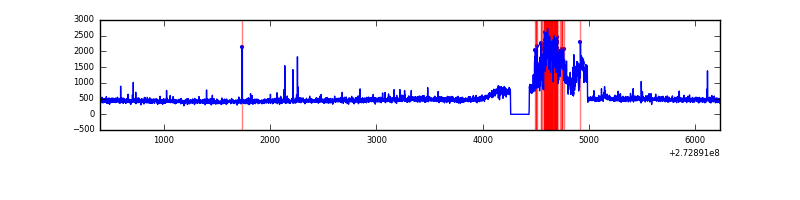 |
| B | 5833 | 5659 | 1 | 1 | 0.02% | 0.02% | 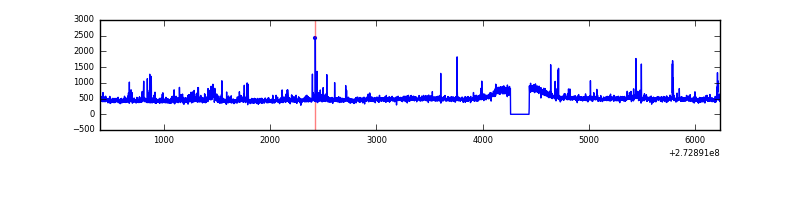 |
| C | 5833 | 5659 | 10 | 10 | 0.17% | 0.18% | 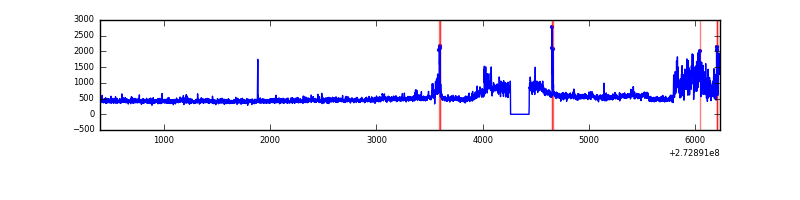 |
| D | 5833 | 5659 | 176 | 176 | 3.02% | 3.11% |  |
Top three noisy pixels from each quadrant. If the there are fewer than three noisy pixels in the level2.evt file, extra rows are filled as -1
| Pixel properties | Quadrant properties | ||||||
|---|---|---|---|---|---|---|---|
| Quadrant | DetID | PixID | Counts | Sigma | Mean | Median | Sigma |
| A | 15 | 239 | 525096 | 3774.0 | 678 | 661 | 139.0 |
| A | 9 | 143 | 34893 | 246.34 | 678 | 661 | 139.0 |
| A | 0 | 226 | 5995 | 38.39 | 678 | 661 | 139.0 |
| B | 4 | 173 | 52852 | 390.43 | 690 | 671 | 133.7 |
| B | 4 | 216 | 30791 | 225.36 | 690 | 671 | 133.7 |
| B | 0 | 189 | 21631 | 156.83 | 690 | 671 | 133.7 |
| C | 3 | 233 | 389717 | 2473.27 | 659 | 664 | 157.3 |
| C | 14 | 238 | 99486 | 628.23 | 659 | 664 | 157.3 |
| C | 9 | 54 | 57250 | 359.73 | 659 | 664 | 157.3 |
| D | 1 | 52 | 1364105 | 8198.2 | 659 | 639 | 166.3 |
| D | 2 | 234 | 26560 | 155.86 | 659 | 639 | 166.3 |
| D | 7 | 223 | 13754 | 78.86 | 659 | 639 | 166.3 |
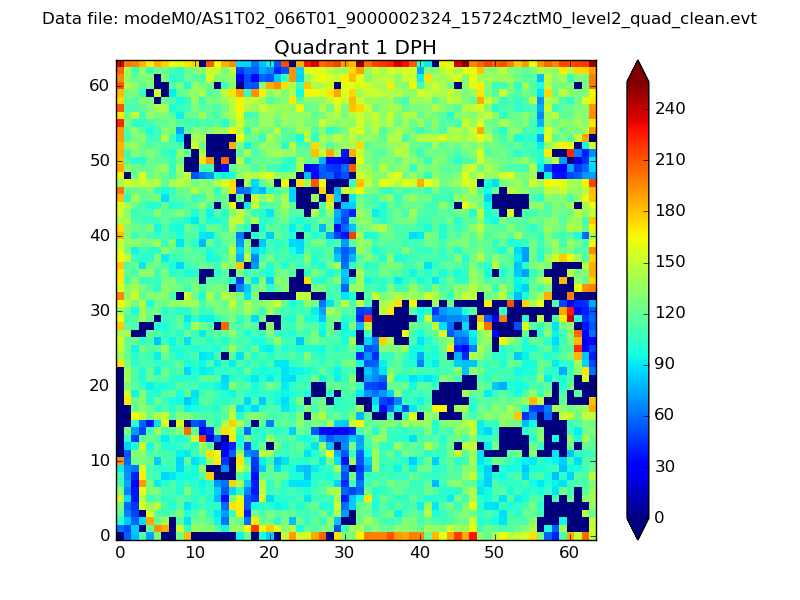
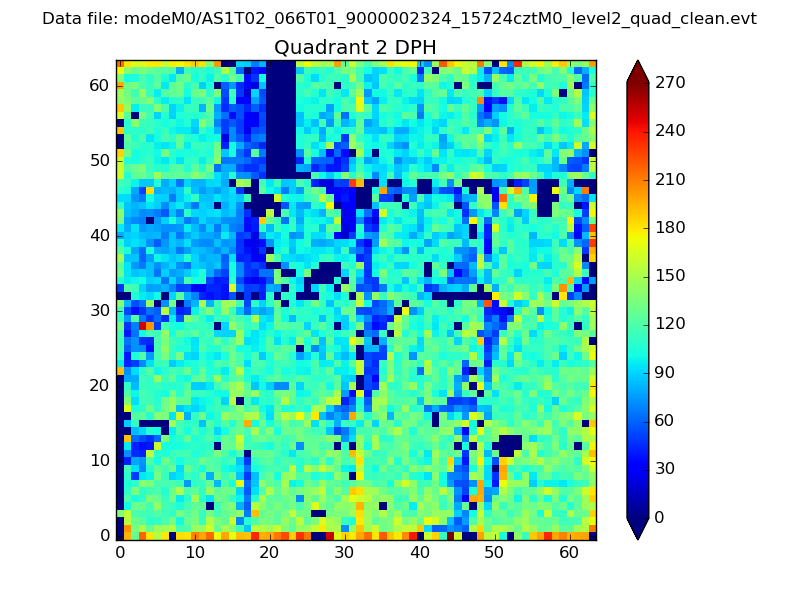
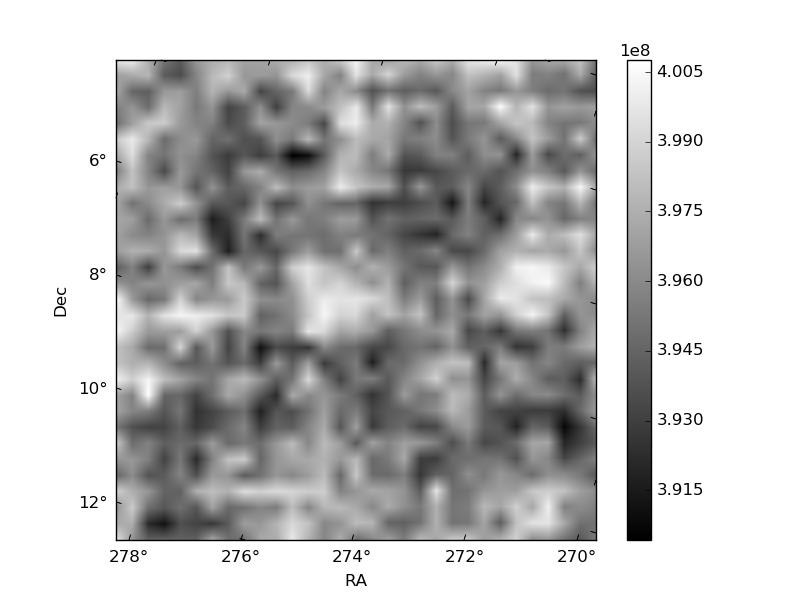
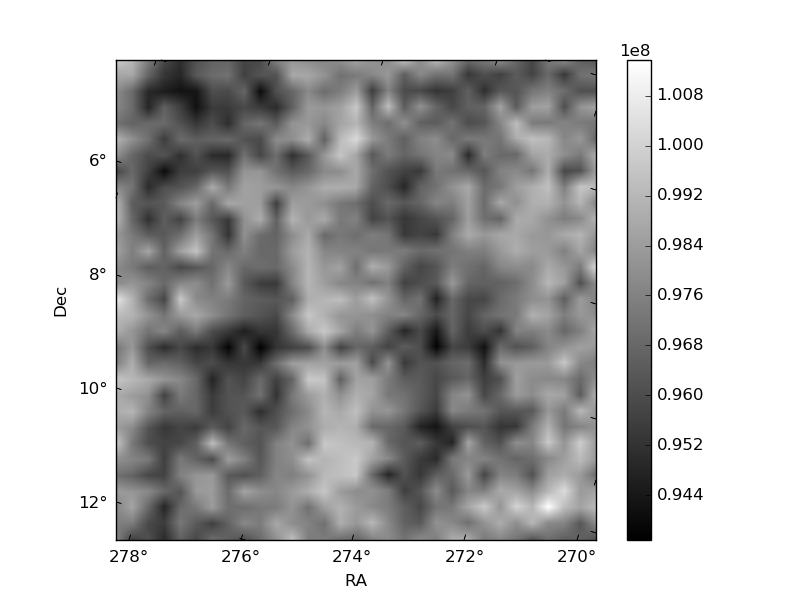
Histogram calculated using DETX and DETY for each event in the final _common_clean file
| Quadrant A | 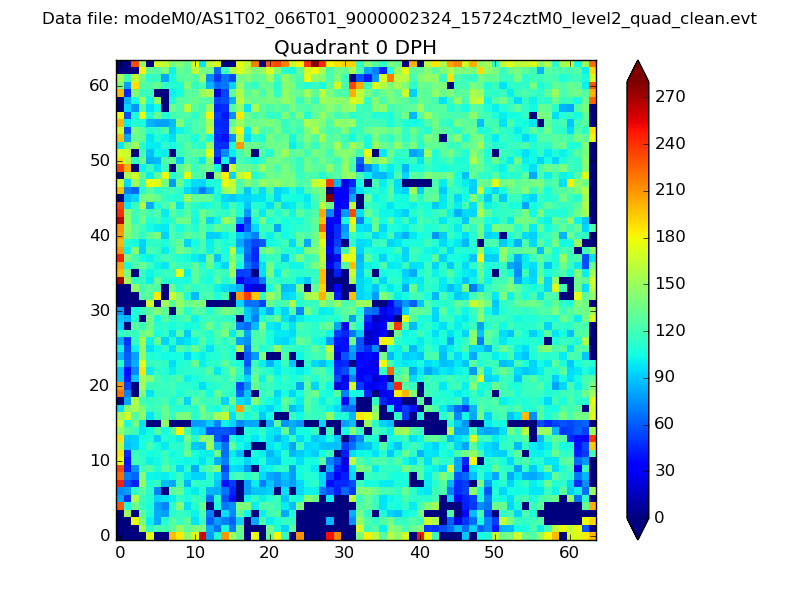 |
 |
Quadrant B |
|---|---|---|---|
| Quadrant D | 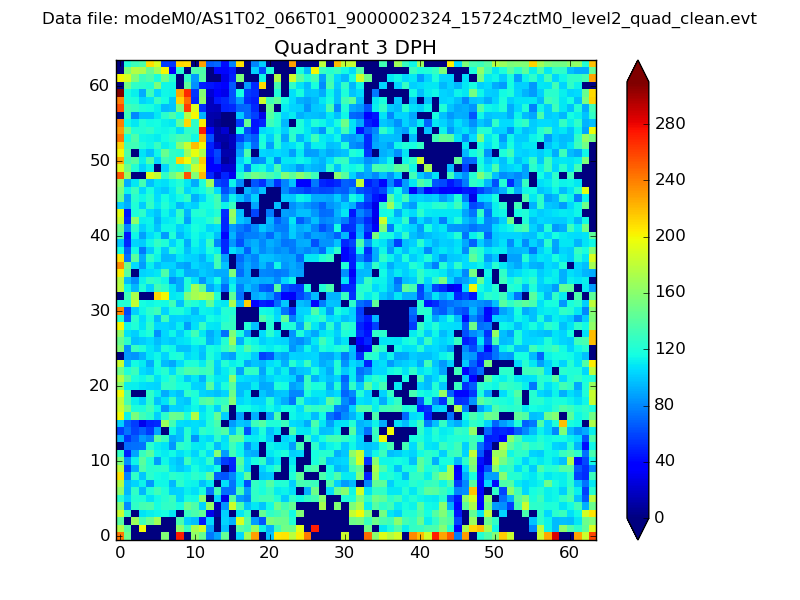 |
 |
Quadrant C |
| Plot type | Count rate plots | Images |
|---|---|---|
| Comparison with Poisson distribution Blue bars denote a histogram of data divided into 1 sec bins. Red curve is a Poisson curve with rate = median count rate of data. |
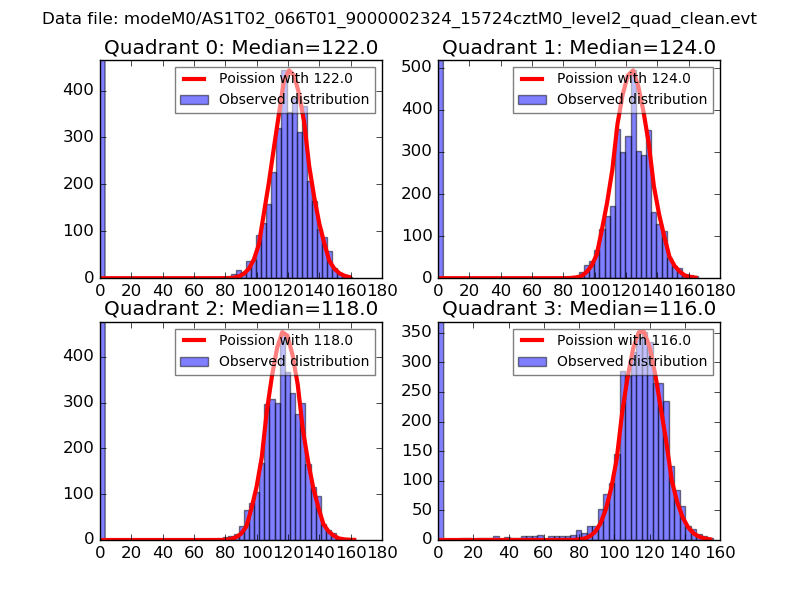 |
 |
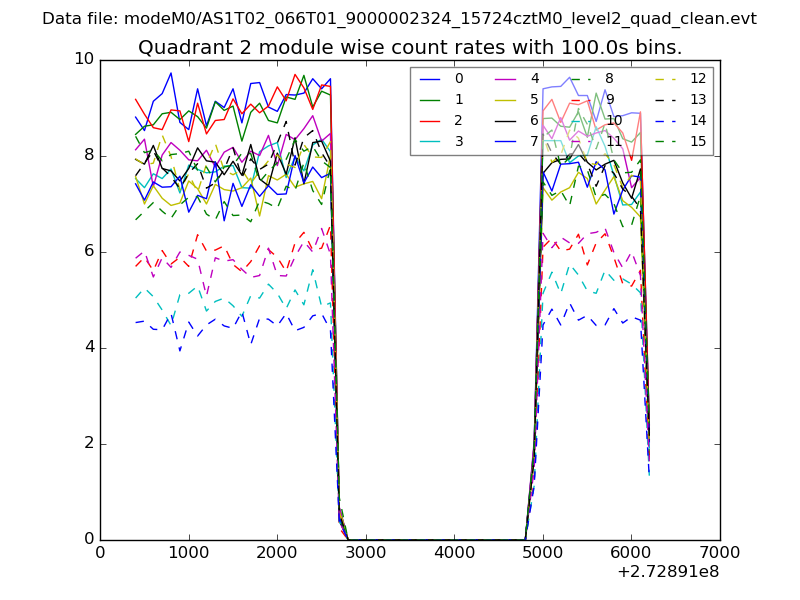
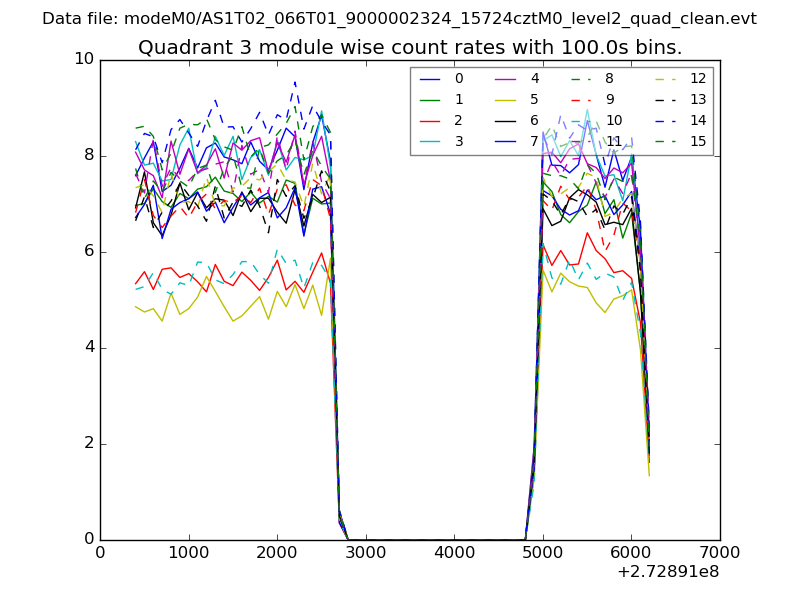
| Quadrant-wise count rates Data is divided into 100 sec bins |
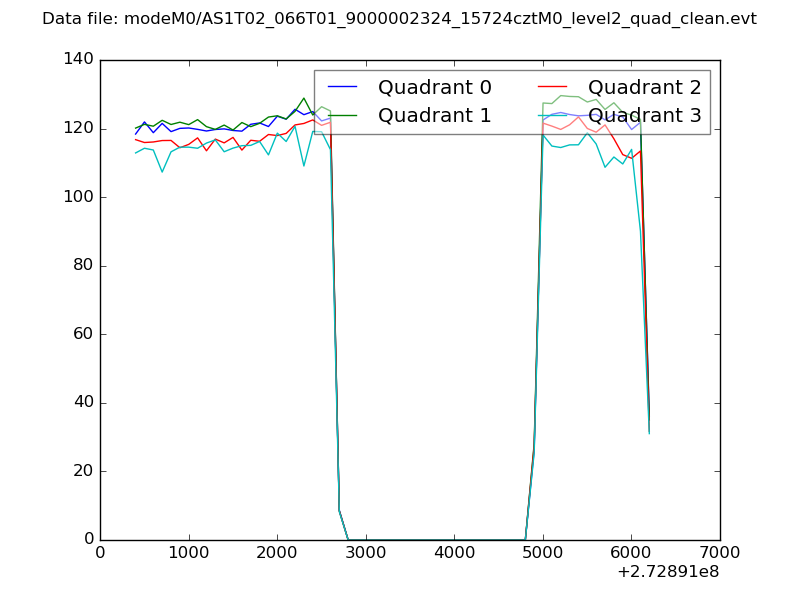 |
|
| Module-wise count rates for Quadrant A Data is divided into 100 sec bins |
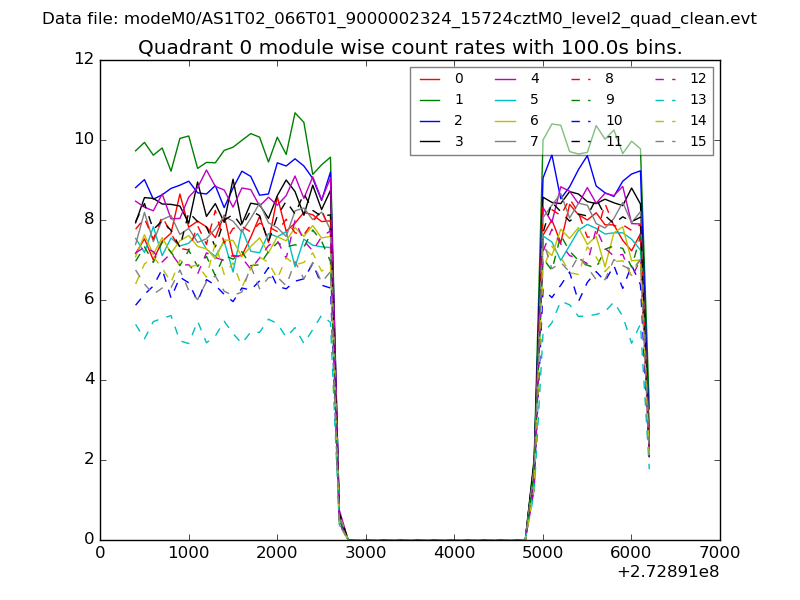 |
 |
| Module-wise count rates for Quadrant B Data is divided into 100 sec bins |
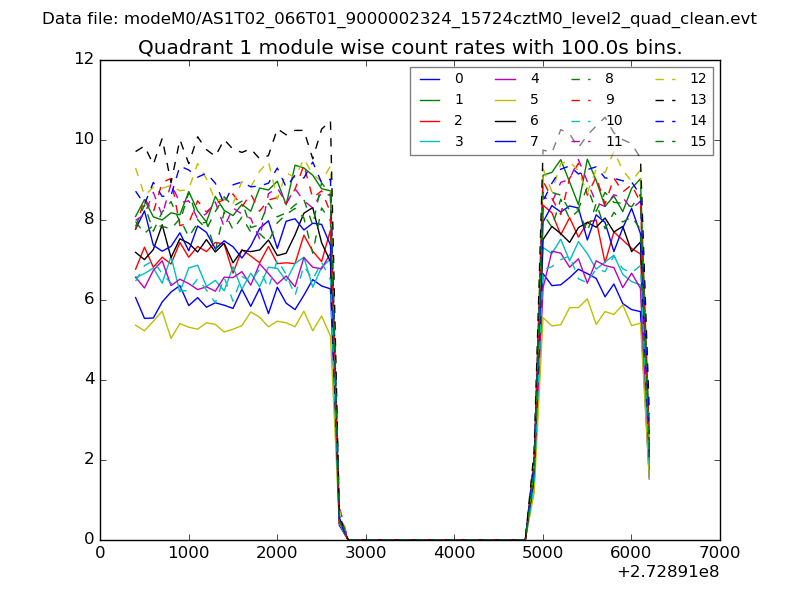 |
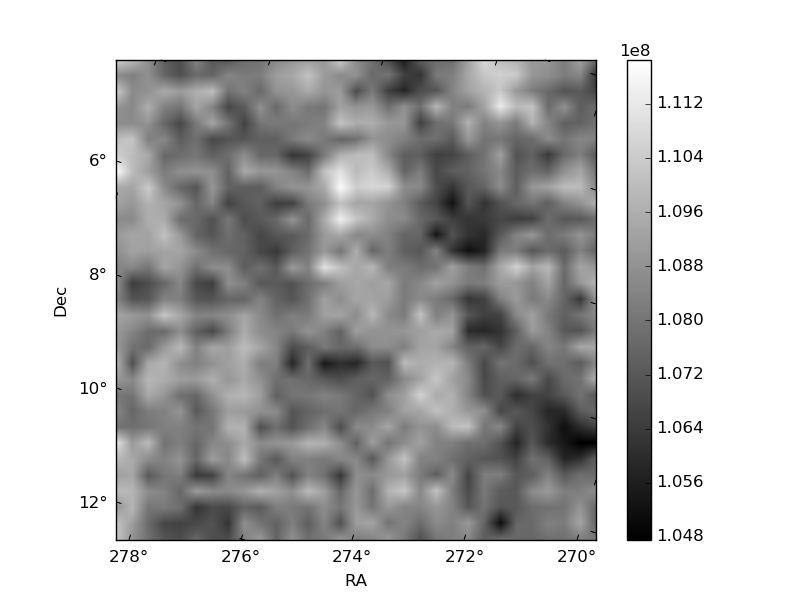 |
| Module-wise count rates for Quadrant C Data is divided into 100 sec bins |
 |
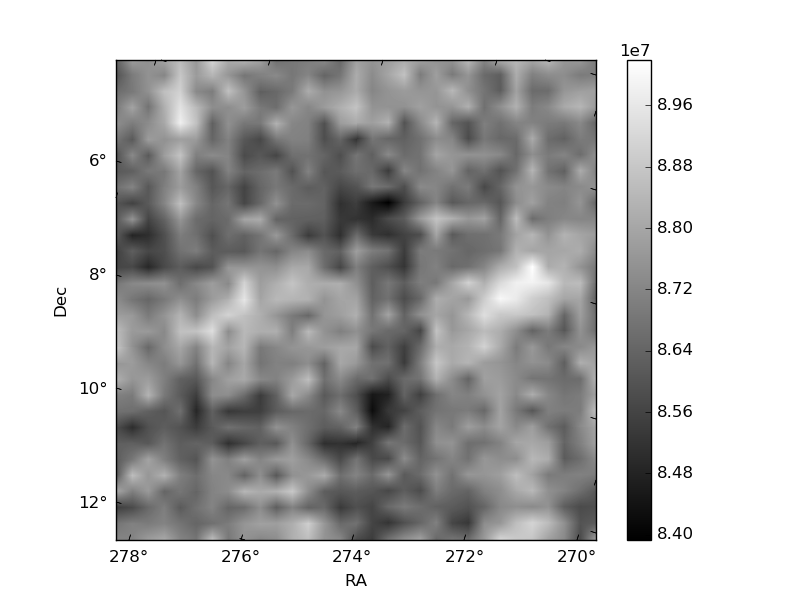 |
| Module-wise count rates for Quadrant D Data is divided into 100 sec bins |
 |
 |
| Parameter | Plot |
|---|---|
| CZT HV Monitor | 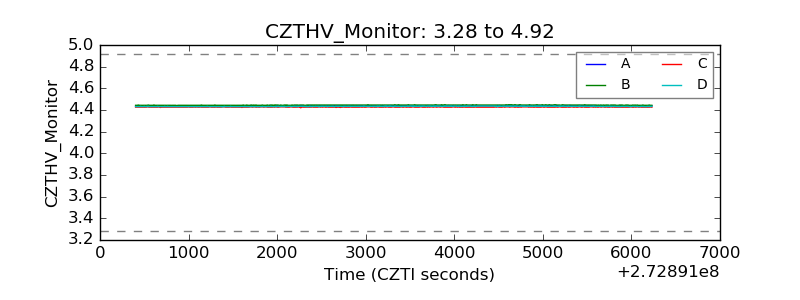 |
| D_VDD | 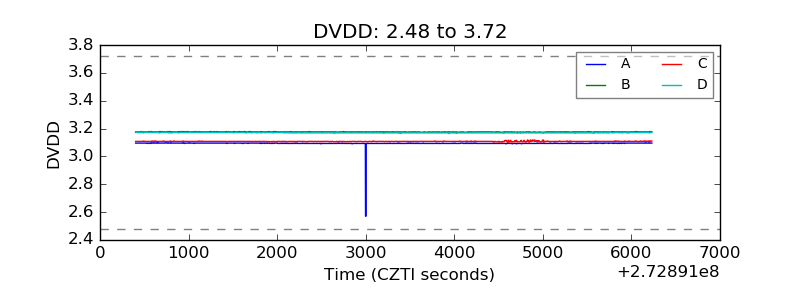 |
| Temperature 1 | 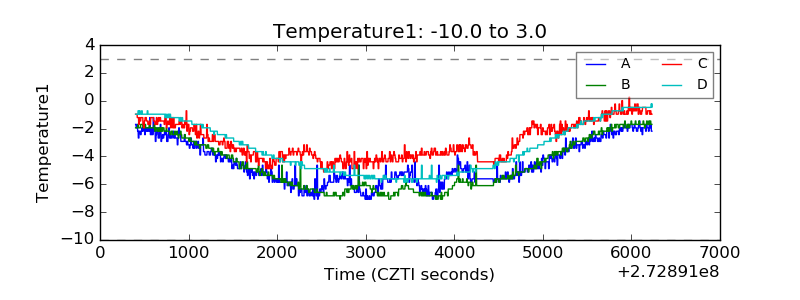 |
| Veto HV Monitor |  |
| Veto LLD | 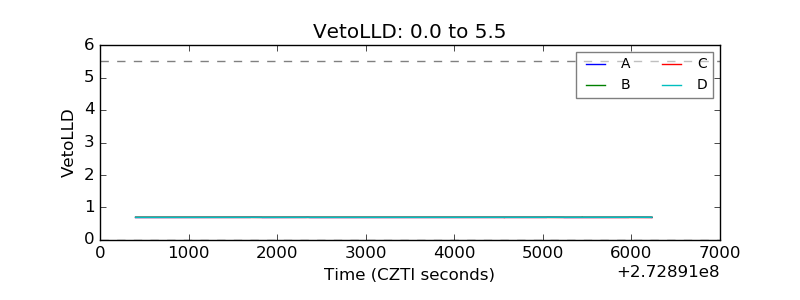 |
| Alpha Counter | 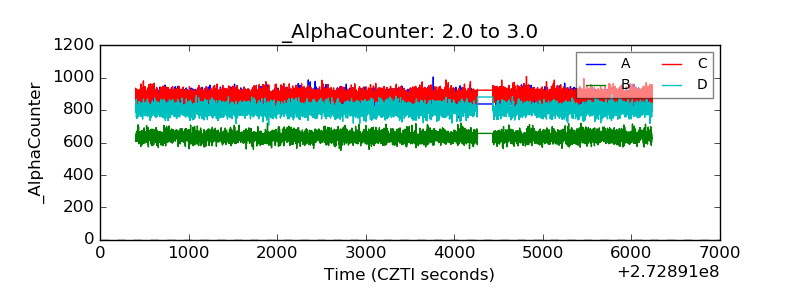 |
| _CPM_Rate | 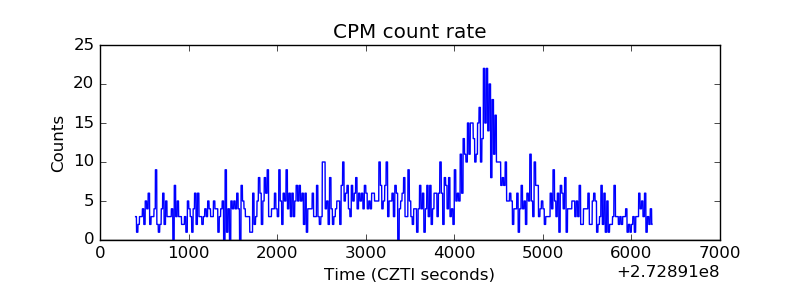 |
| CZT Counter | 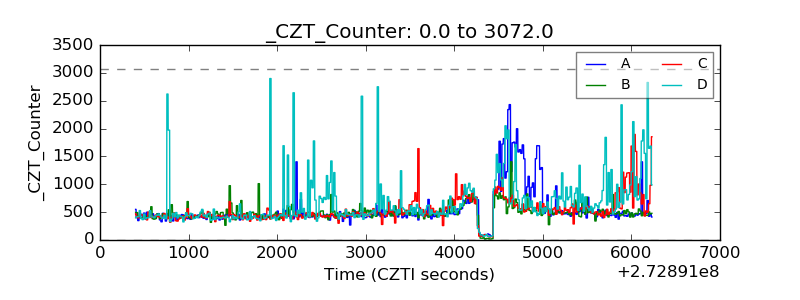 |
| +2.5 Volts monitor |  |
| +5 Volts monitor |  |
| _ROLL_ROT | 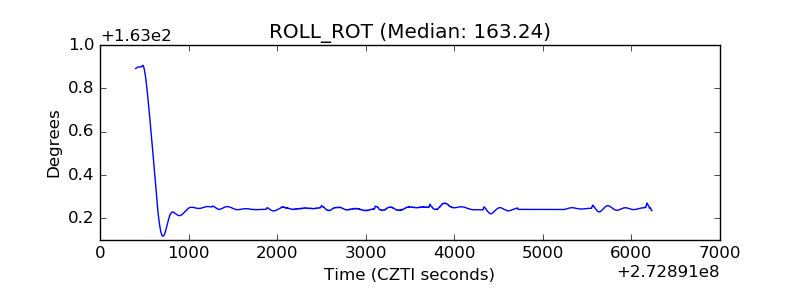 |
| _Roll_DEC | 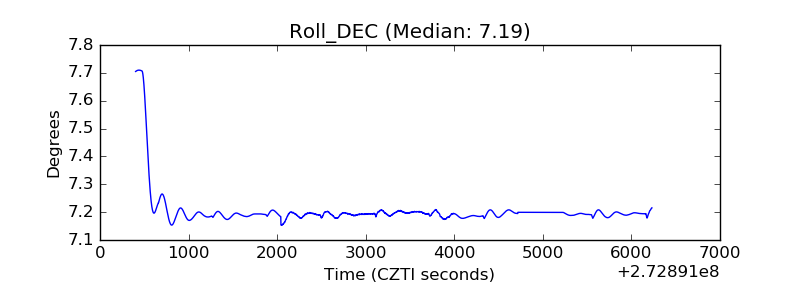 |
| _Roll_RA | 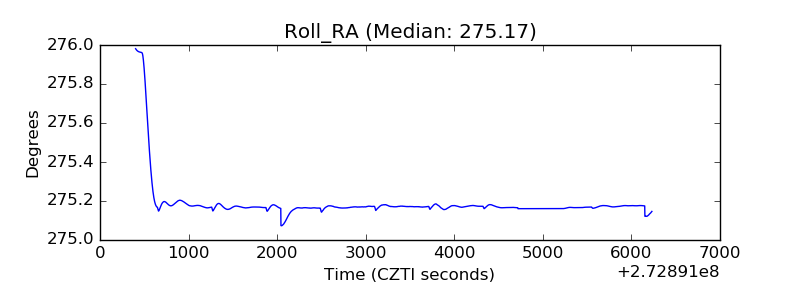 |
| Veto Counter | 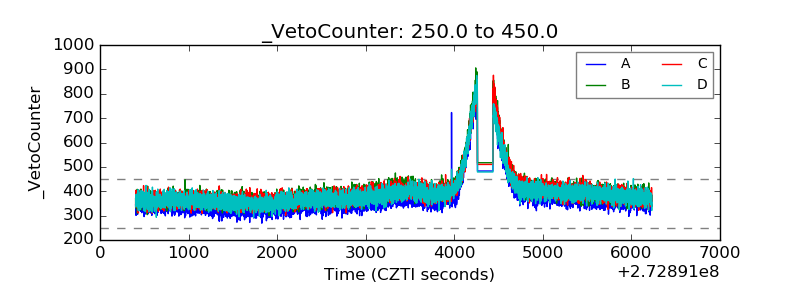 |