| Param | Original file | Final file |
|---|---|---|
| Filename | modeM0/AS1T02_066T01_9000002324_15727cztM0_level2.evt | modeM0/AS1T02_066T01_9000002324_15727cztM0_level2_quad_clean.evt |
| Size (bytes) | 1,086,793,920 | 178,741,440 |
| Size | 1.0 GB | 170.5 MB |
| Events in quadrant A | 6,366,439 | 1,153,609 |
| Events in quadrant B | 6,735,406 | 1,177,418 |
| Events in quadrant C | 8,061,698 | 1,109,010 |
| Events in quadrant D | 10,834,341 | 1,036,733 |
| Mode M0 | |||
|---|---|---|---|
| Quadrant | BADHDUFLAG | Total packets | Discarded packets |
| A | 0 | 28327 | 2 |
| B | 0 | 28707 | 2 |
| C | 0 | 33253 | 2 |
| D | 0 | 41409 | 2 |
| Mode M9 | |||
|---|---|---|---|
| Quadrant | BADHDUFLAG | Total packets | Discarded packets |
| A | 0 | 10 | 0 |
| B | 0 | 10 | 0 |
| C | 0 | 10 | 0 |
| D | 0 | 10 | 0 |
| Mode SS | |||
|---|---|---|---|
| Quadrant | BADHDUFLAG | Total packets | Discarded packets |
| A | 0 | 274 | 0 |
| B | 0 | 274 | 0 |
| C | 0 | 274 | 0 |
| D | 0 | 274 | 0 |
| Quadrant | Total seconds | Saturated seconds | Saturation percentage |
|---|---|---|---|
| A | 13558 | 208 | 1.534150% |
| B | 13558 | 177 | 1.305502% |
| C | 13558 | 347 | 2.559375% |
| D | 13558 | 1244 | 9.175395% |
Noise dominated data is calculated using 1-second bins in cleaned event files. If a bin has >2000 counts, and if more than 50% of those come from <1% of pixels, then it is considered to be noise-dominated and hence unusable.
| Quadrant | # 1 sec bins | Bins with >0 counts | Bins with >2000 counts | High rate bins dominated by noise | Noise dominated (total time) | Noise dominated (detector-on time) | Marked lightcurve |
|---|---|---|---|---|---|---|---|
| A | 14549 | 13561 | 37 | 37 | 0.25% | 0.27% | 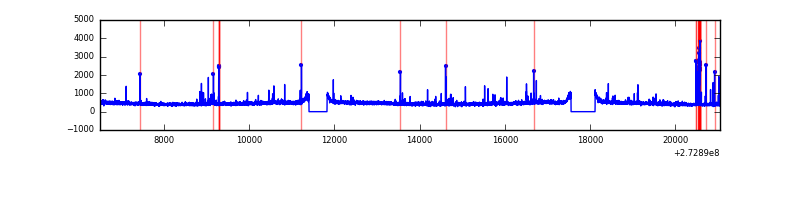 |
| B | 14549 | 13561 | 7 | 7 | 0.05% | 0.05% | 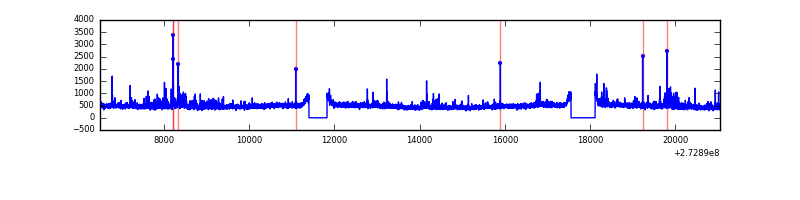 |
| C | 14549 | 13561 | 86 | 86 | 0.59% | 0.63% | 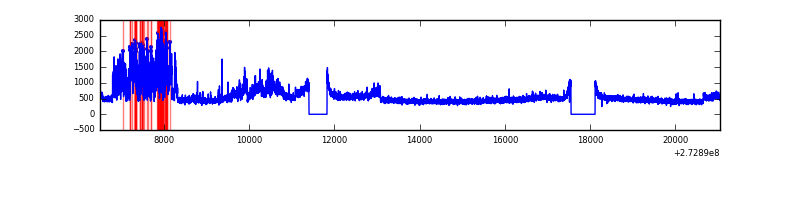 |
| D | 14549 | 13561 | 1005 | 1005 | 6.91% | 7.41% | 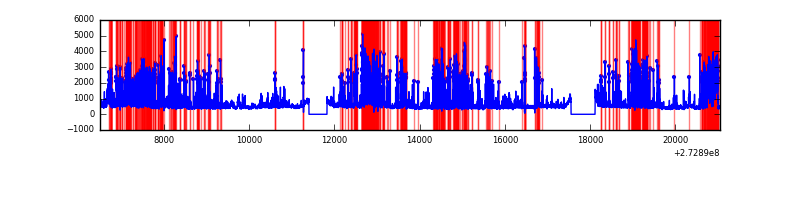 |
Top three noisy pixels from each quadrant. If the there are fewer than three noisy pixels in the level2.evt file, extra rows are filled as -1
| Pixel properties | Quadrant properties | ||||||
|---|---|---|---|---|---|---|---|
| Quadrant | DetID | PixID | Counts | Sigma | Mean | Median | Sigma |
| A | 9 | 143 | 138676 | 430.61 | 1585 | 1549 | 318.4 |
| A | 15 | 239 | 112716 | 349.09 | 1585 | 1549 | 318.4 |
| A | 15 | 174 | 14464 | 40.56 | 1585 | 1549 | 318.4 |
| B | 4 | 216 | 99763 | 323.39 | 1588 | 1547 | 303.7 |
| B | 5 | 65 | 95801 | 310.34 | 1588 | 1547 | 303.7 |
| B | 4 | 173 | 81681 | 263.85 | 1588 | 1547 | 303.7 |
| C | 3 | 233 | 1892068 | 5324.32 | 1519 | 1528 | 355.1 |
| C | 14 | 238 | 227450 | 636.26 | 1519 | 1528 | 355.1 |
| C | 9 | 54 | 13030 | 32.39 | 1519 | 1528 | 355.1 |
| D | 1 | 52 | 4841221 | 12797.14 | 1490 | 1451 | 378.2 |
| D | 7 | 223 | 79892 | 207.41 | 1490 | 1451 | 378.2 |
| D | 13 | 172 | 70809 | 183.39 | 1490 | 1451 | 378.2 |
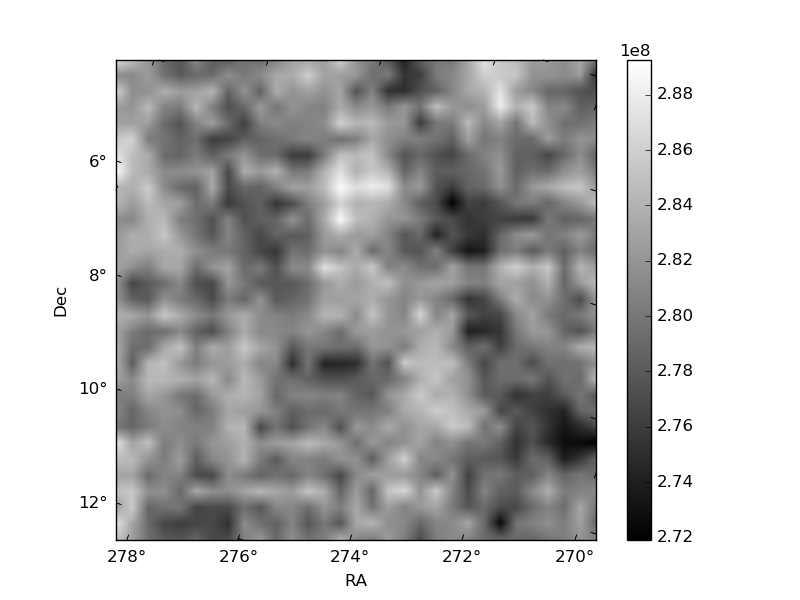
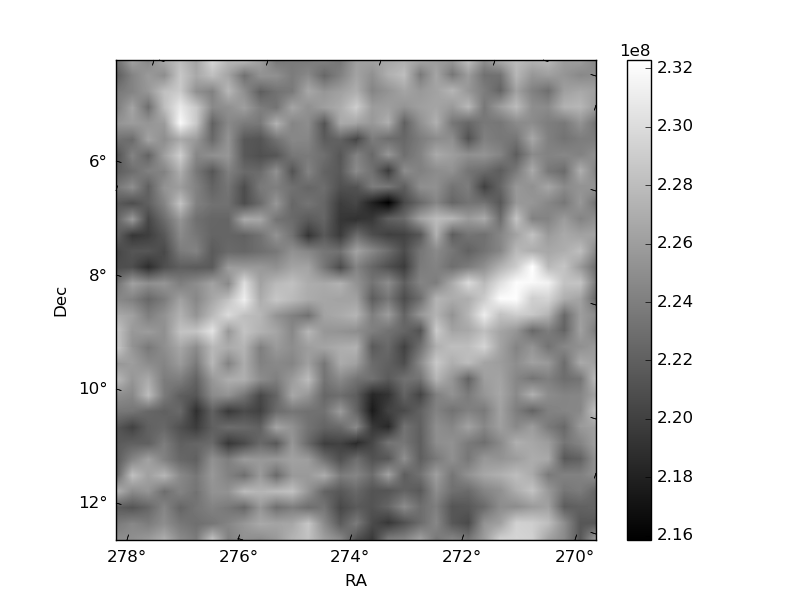
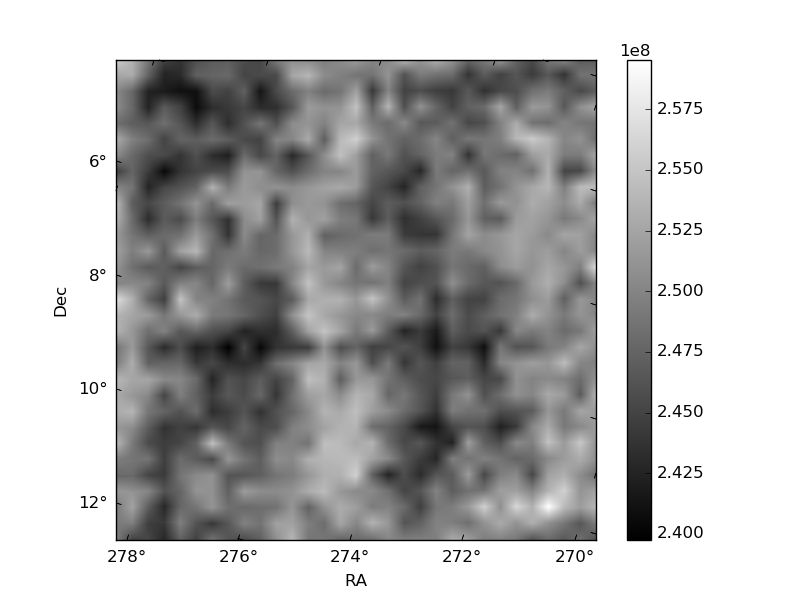
Histogram calculated using DETX and DETY for each event in the final _common_clean file
| Quadrant A | 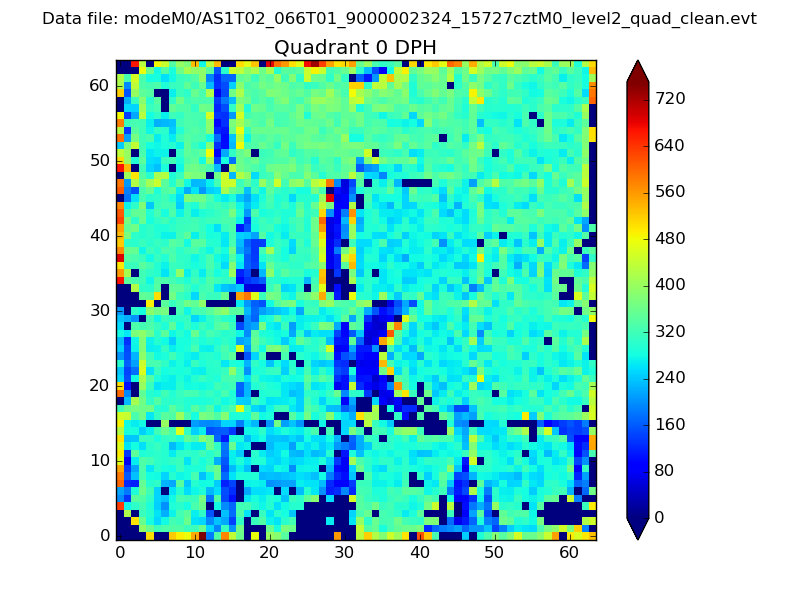 |
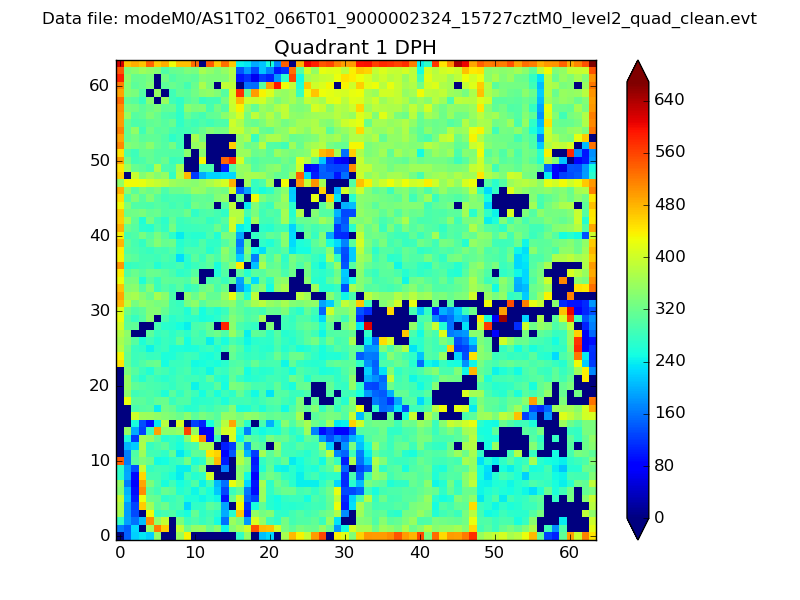 |
Quadrant B |
|---|---|---|---|
| Quadrant D | 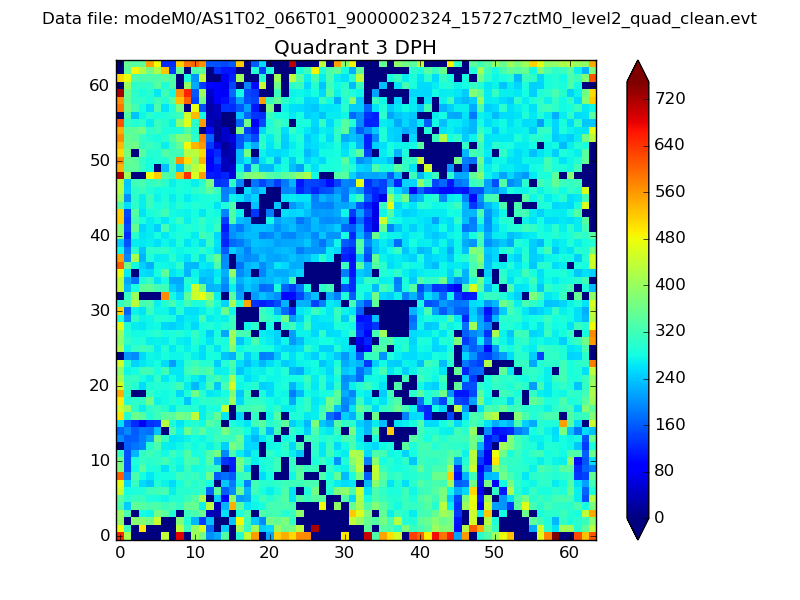 |
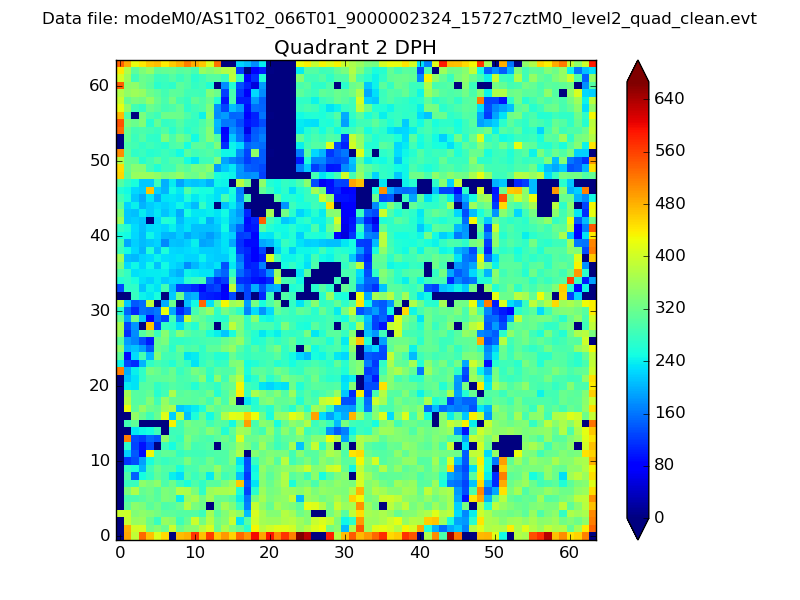 |
Quadrant C |
| Plot type | Count rate plots | Images |
|---|---|---|
| Comparison with Poisson distribution Blue bars denote a histogram of data divided into 1 sec bins. Red curve is a Poisson curve with rate = median count rate of data. |
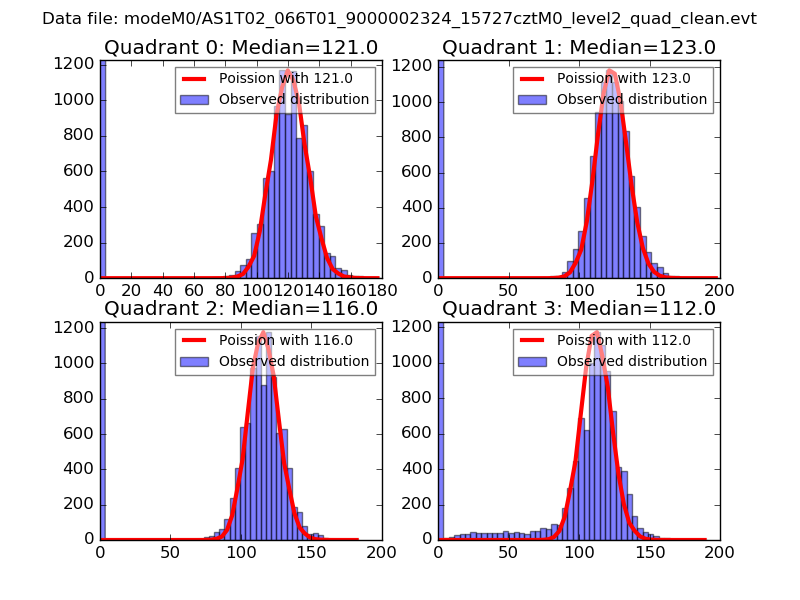 |
 |
| Quadrant-wise count rates Data is divided into 100 sec bins |
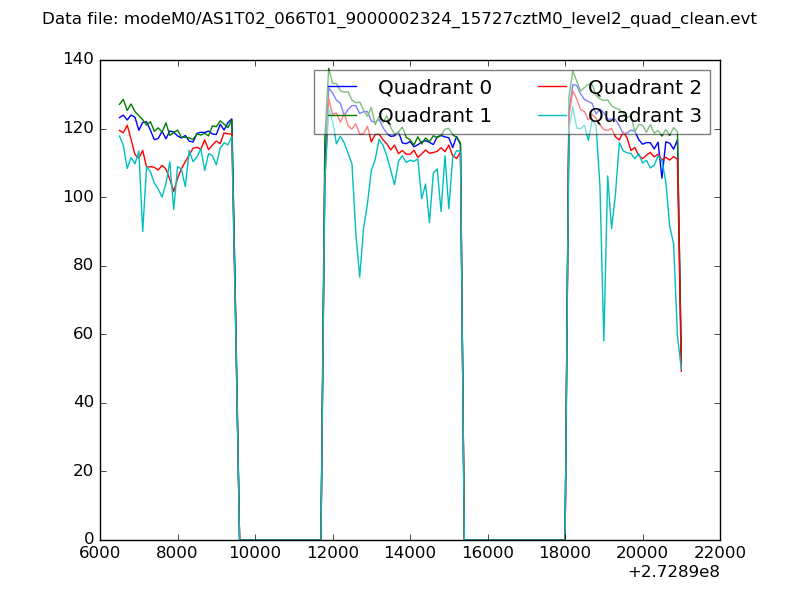 |
|
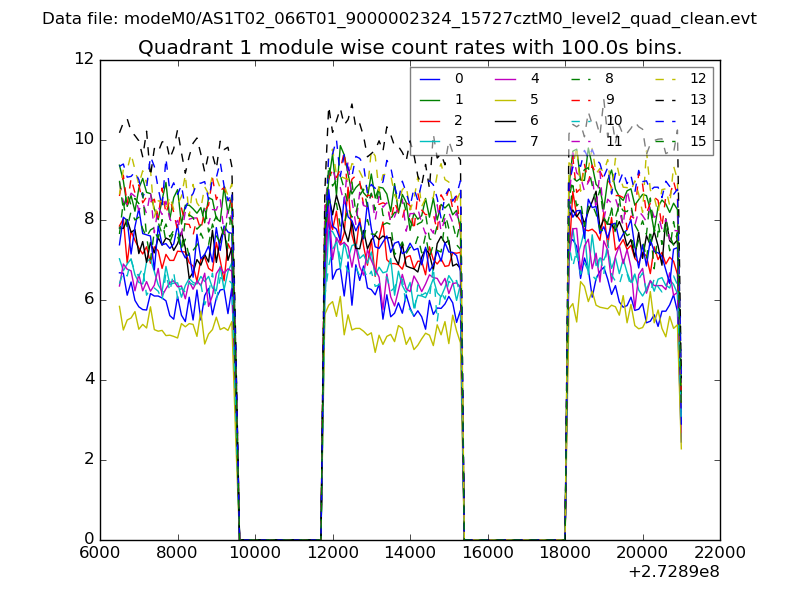
| Module-wise count rates for Quadrant A Data is divided into 100 sec bins |
 |
 |
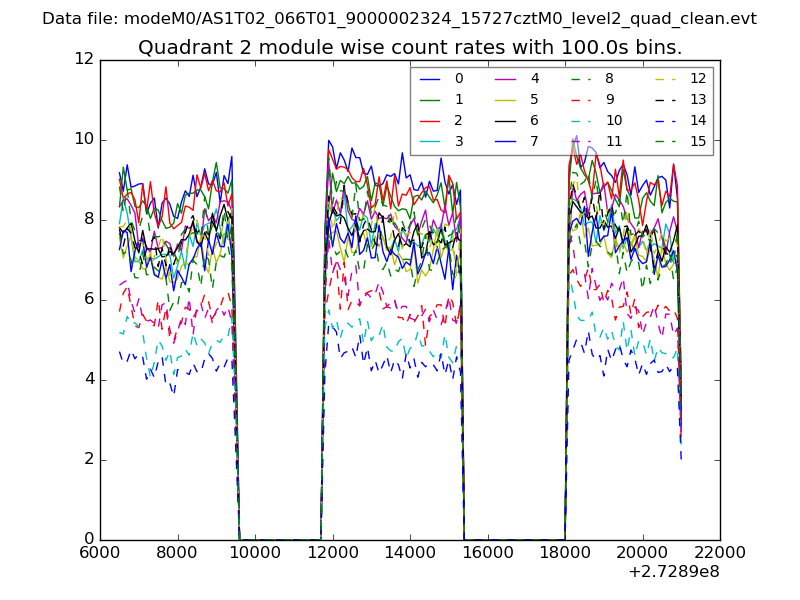
| Module-wise count rates for Quadrant B Data is divided into 100 sec bins |
 |
 |
| Module-wise count rates for Quadrant C Data is divided into 100 sec bins |
 |
 |
| Module-wise count rates for Quadrant D Data is divided into 100 sec bins |
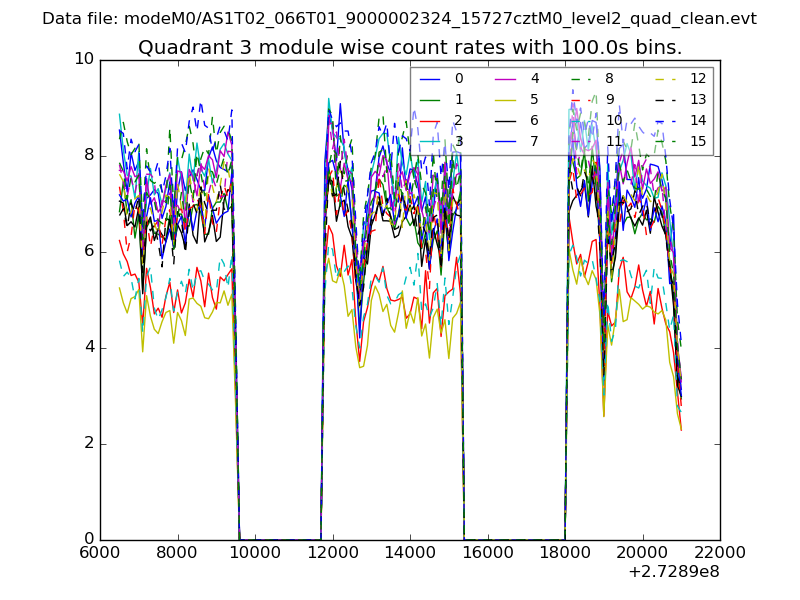 |
 |
| Parameter | Plot |
|---|---|
| CZT HV Monitor | 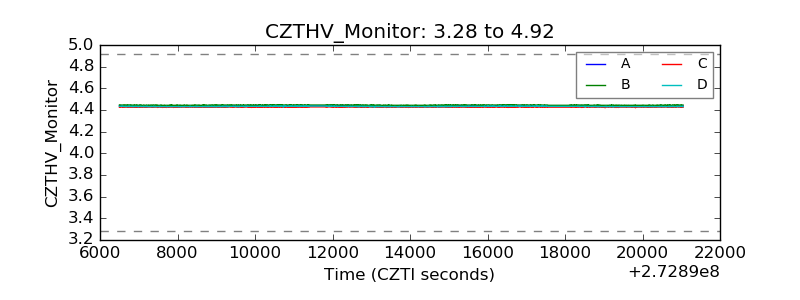 |
| D_VDD | 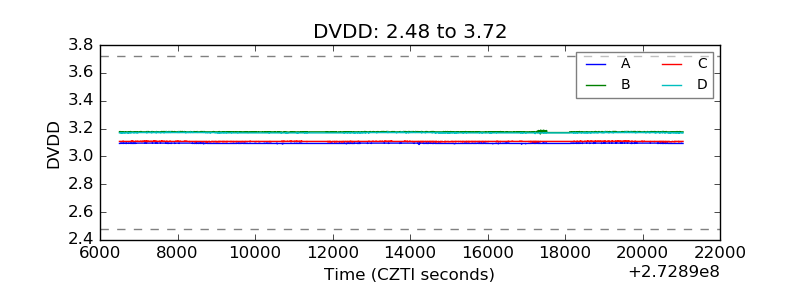 |
| Temperature 1 |  |
| Veto HV Monitor | 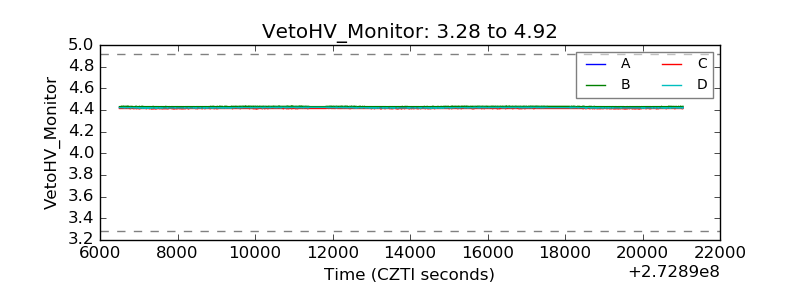 |
| Veto LLD | 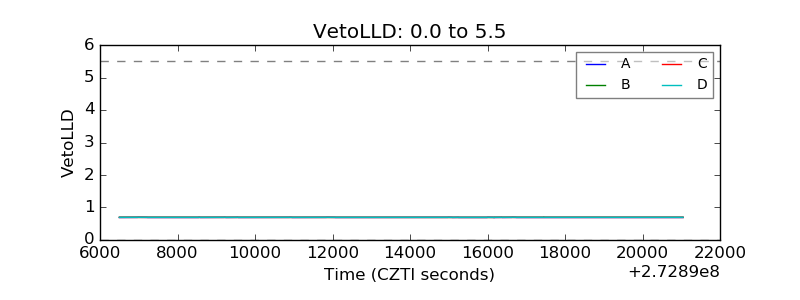 |
| Alpha Counter | 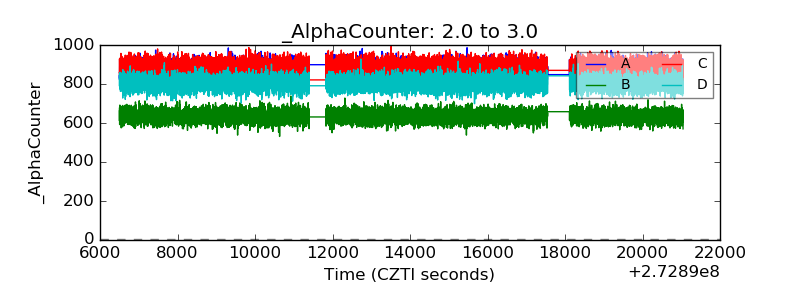 |
| _CPM_Rate | 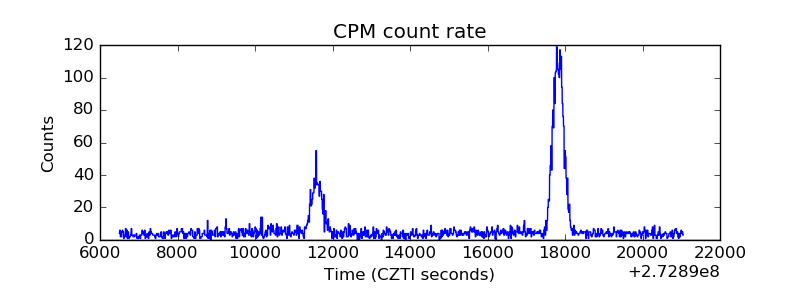 |
| CZT Counter | 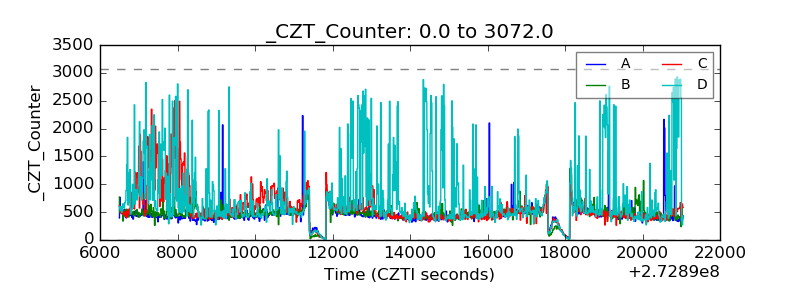 |
| +2.5 Volts monitor |  |
| +5 Volts monitor |  |
| _ROLL_ROT | 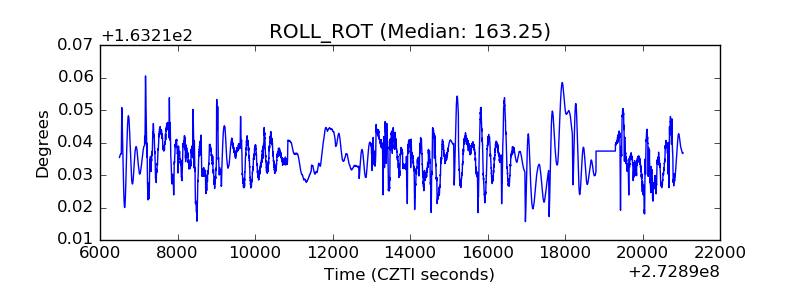 |
| _Roll_DEC | 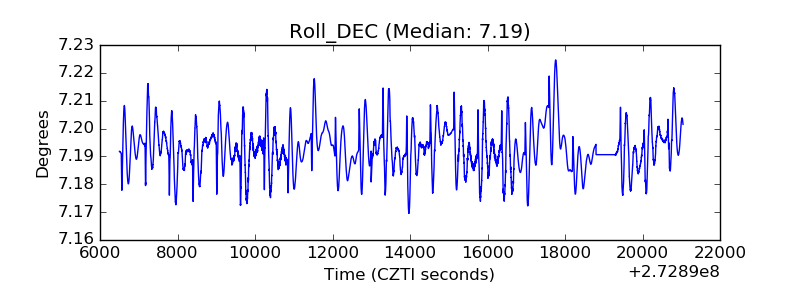 |
| _Roll_RA | 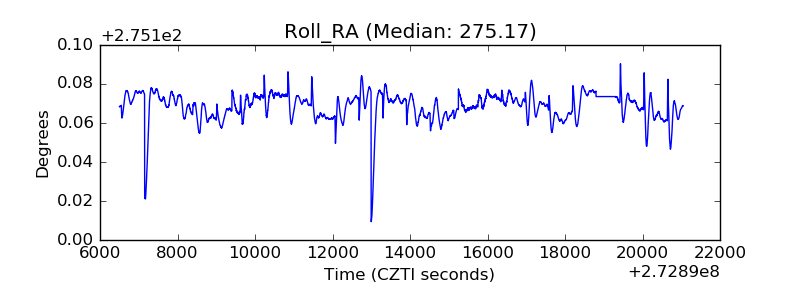 |
| Veto Counter | 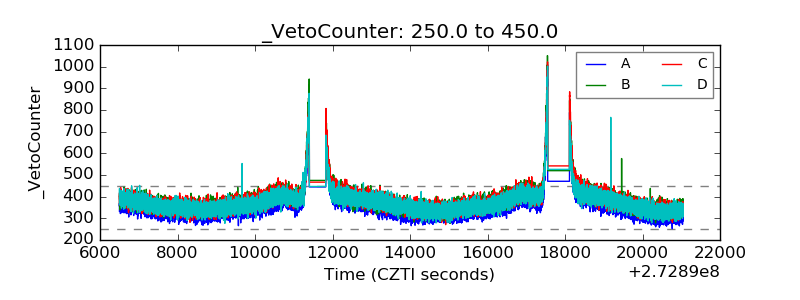 |