| Param | Original file | Final file |
|---|---|---|
| Filename | modeM0/AS1C03_015T04_9000002328cztM0_level2.fits | modeM0/AS1C03_015T04_9000002328cztM0_level2_quad_clean.evt |
| Size (bytes) | 166,829,760 | 208,771,200 |
| Size | 159.1 MB | 199.1 MB |
| Events in quadrant A | 1,023,458 | 1,333,678 |
| Events in quadrant B | 986,824 | 1,359,220 |
| Events in quadrant C | 991,028 | 1,277,402 |
| Events in quadrant D | 859,306 | 1,160,339 |
| Mode SS | |||
|---|---|---|---|
| Quadrant | BADHDUFLAG | Total packets | Discarded packets |
| A | 0 | 352 | 0 |
| B | 0 | 352 | 0 |
| C | 0 | 352 | 0 |
| D | 0 | 352 | 0 |
| Mode M0 | |||
|---|---|---|---|
| Quadrant | BADHDUFLAG | Total packets | Discarded packets |
| A | 0 | 35635 | 0 |
| B | 0 | 36040 | 0 |
| C | 0 | 37727 | 0 |
| D | 0 | 41046 | 0 |
| Mode M9 | |||
|---|---|---|---|
| Quadrant | BADHDUFLAG | Total packets | Discarded packets |
| A | 0 | 37 | 0 |
| B | 0 | 37 | 0 |
| C | 0 | 37 | 0 |
| D | 0 | 37 | 0 |
| Quadrant | Total seconds | Saturated seconds | Saturation percentage |
|---|---|---|---|
| A | 17290 | 51 | 0.294968% |
| B | 17290 | 99 | 0.572585% |
| C | 17290 | 161 | 0.931174% |
| D | 17290 | 417 | 2.411799% |
Noise dominated data is calculated using 1-second bins in cleaned event files. If a bin has >2000 counts, and if more than 50% of those come from <1% of pixels, then it is considered to be noise-dominated and hence unusable.
| Quadrant | # 1 sec bins | Bins with >0 counts | Bins with >2000 counts | High rate bins dominated by noise | Noise dominated (total time) | Noise dominated (detector-on time) | Marked lightcurve |
|---|---|---|---|---|---|---|---|
| A | 21010 | 17290 | 0 | 0 | 0.00% | 0.00% |  |
| B | 21010 | 17291 | 0 | 0 | 0.00% | 0.00% | 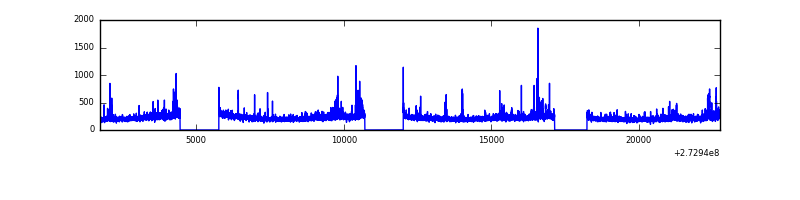 |
| C | 21010 | 17290 | 0 | 0 | 0.00% | 0.00% |  |
| D | 21010 | 17285 | 0 | 0 | 0.00% | 0.00% | 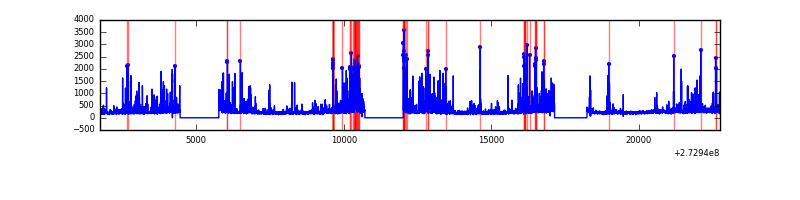 |
Top three noisy pixels from each quadrant. If the there are fewer than three noisy pixels in the level2.evt file, extra rows are filled as -1
| Pixel properties | Quadrant properties | ||||||
|---|---|---|---|---|---|---|---|
| Quadrant | DetID | PixID | Counts | Sigma | Mean | Median | Sigma |
| A | 0 | 29 | 1047 | 11.87 | 266 | 252 | 67.0 |
| A | 7 | 110 | 836 | 8.72 | 266 | 252 | 67.0 |
| A | 0 | 30 | 775 | 7.81 | 266 | 252 | 67.0 |
| B | 2 | 9 | 789 | 10.31 | 261 | 251 | 52.2 |
| B | 3 | 17 | 668 | 7.99 | 261 | 251 | 52.2 |
| B | 5 | 128 | 649 | 7.63 | 261 | 251 | 52.2 |
| C | 1 | 81 | 778 | 7.74 | 261 | 246 | 68.7 |
| C | 1 | 80 | 762 | 7.51 | 261 | 246 | 68.7 |
| C | 12 | 241 | 698 | 6.58 | 261 | 246 | 68.7 |
| D | 3 | 14 | 672 | 6.73 | 245 | 224 | 66.6 |
| D | 7 | 3 | 624 | 6.01 | 245 | 224 | 66.6 |
| D | 6 | 67 | 615 | 5.87 | 245 | 224 | 66.6 |
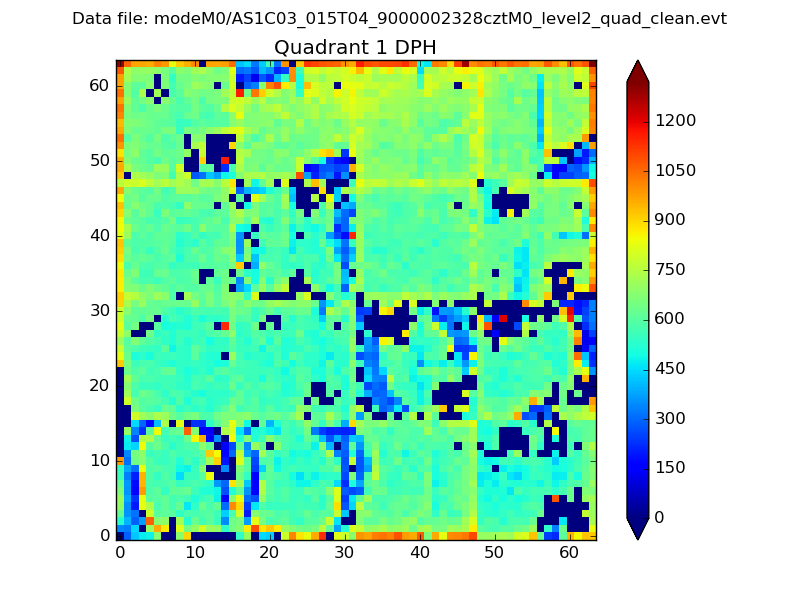
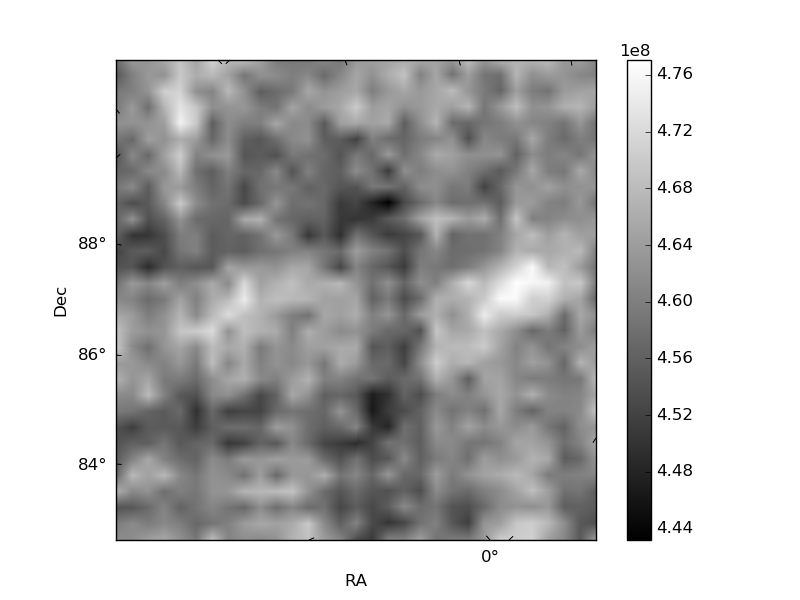
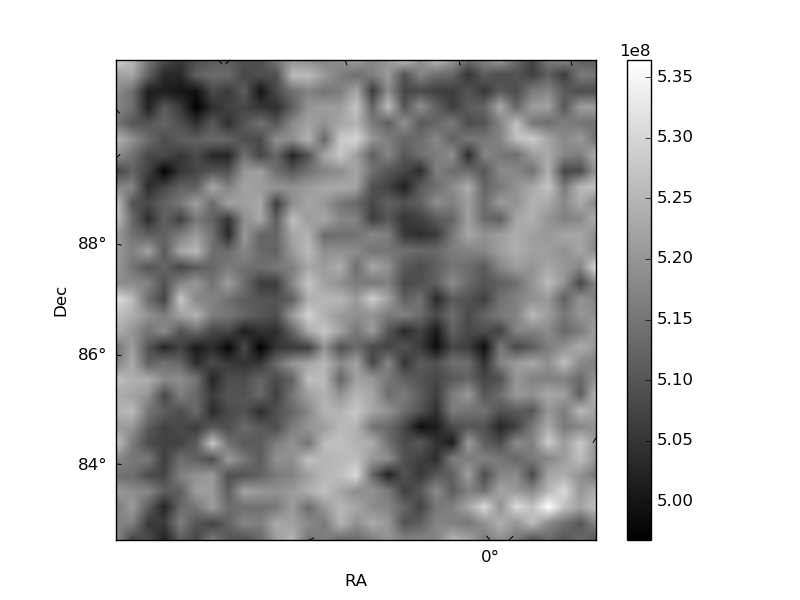
Histogram calculated using DETX and DETY for each event in the final _common_clean file
| Quadrant A |  |
 |
Quadrant B |
|---|---|---|---|
| Quadrant D | 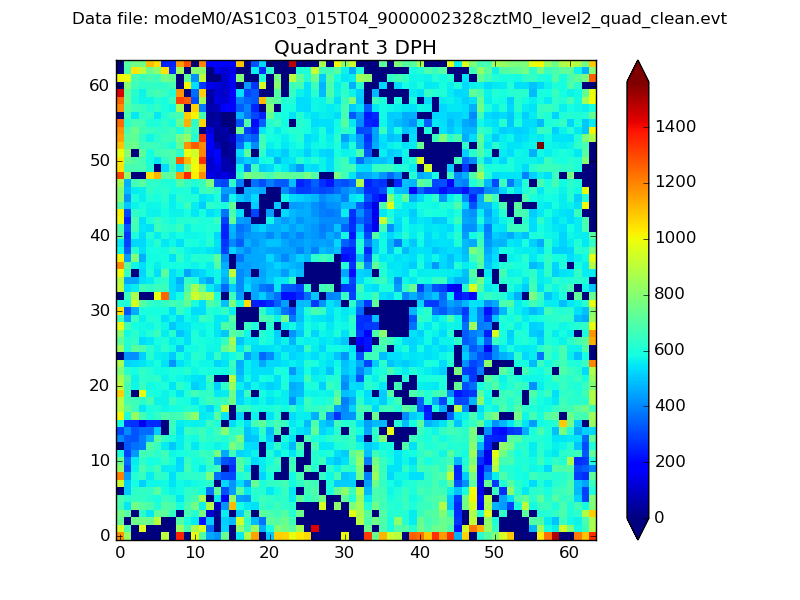 |
 |
Quadrant C |
| Plot type | Count rate plots | Images |
|---|---|---|
| Comparison with Poisson distribution Blue bars denote a histogram of data divided into 1 sec bins. Red curve is a Poisson curve with rate = median count rate of data. |
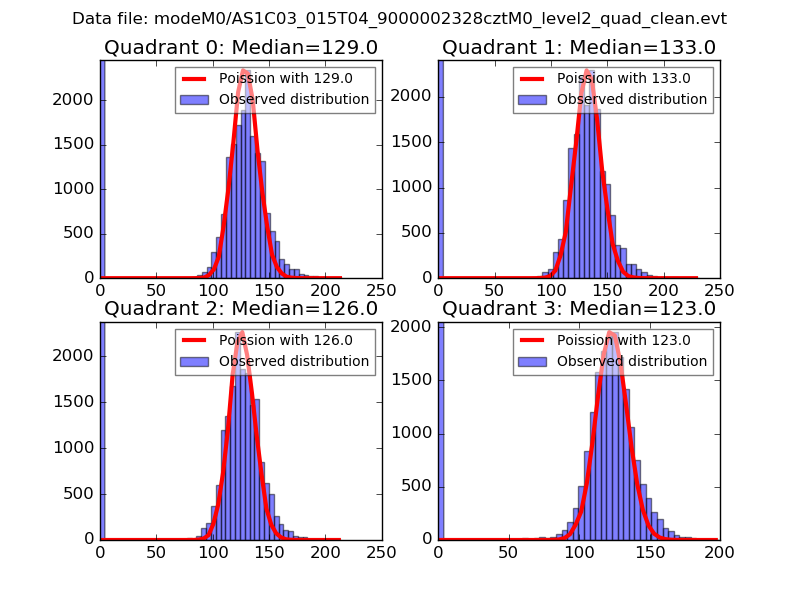 |
 |
| Quadrant-wise count rates Data is divided into 100 sec bins |
 |
|
| Module-wise count rates for Quadrant A Data is divided into 100 sec bins |
 |
 |
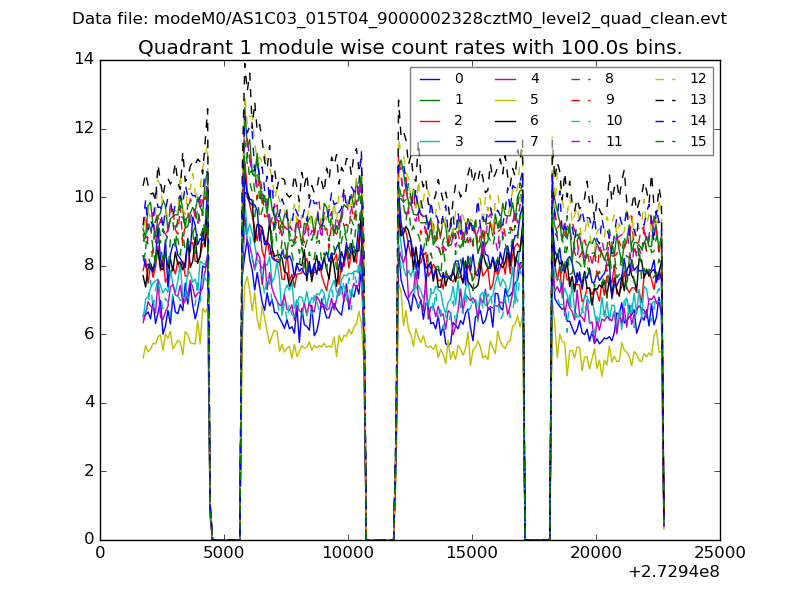
| Module-wise count rates for Quadrant B Data is divided into 100 sec bins |
 |
 |
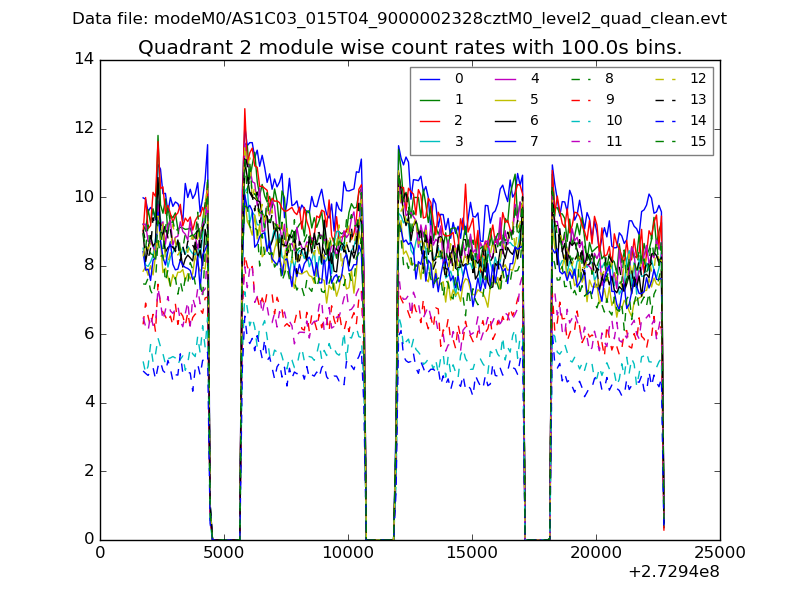
| Module-wise count rates for Quadrant C Data is divided into 100 sec bins |
 |
 |
| Module-wise count rates for Quadrant D Data is divided into 100 sec bins |
 |
 |
| Parameter | Plot |
|---|---|
| CZT HV Monitor |  |
| D_VDD | 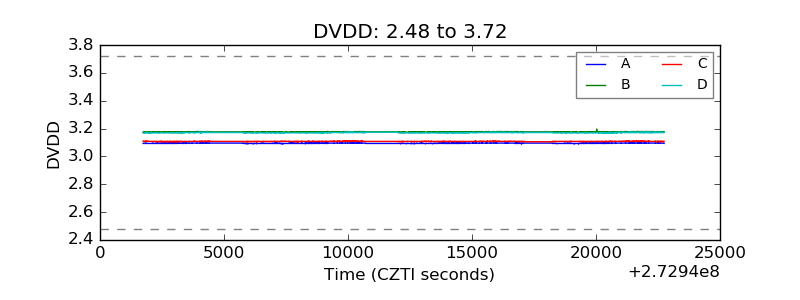 |
| Temperature 1 |  |
| Veto HV Monitor |  |
| Veto LLD |  |
| Alpha Counter |  |
| _CPM_Rate |  |
| CZT Counter | 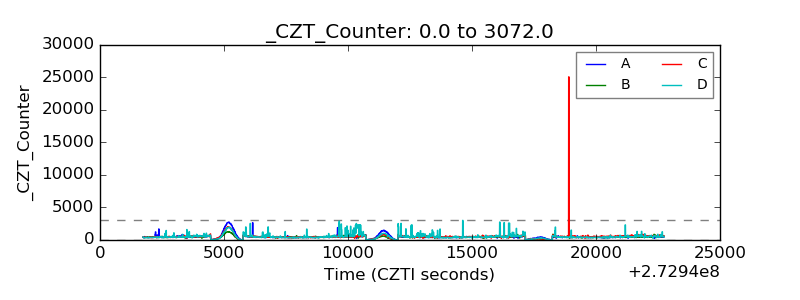 |
| +2.5 Volts monitor |  |
| +5 Volts monitor | 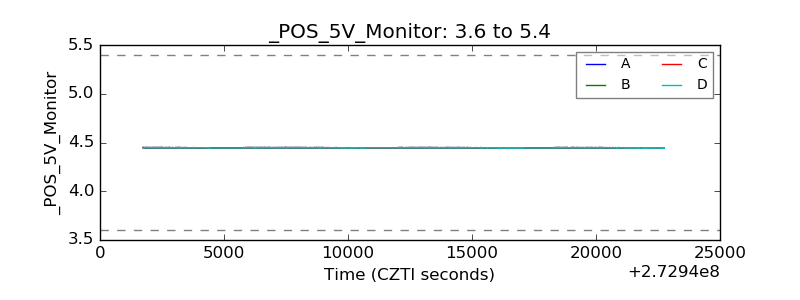 |
| _ROLL_ROT |  |
| _Roll_DEC |  |
| _Roll_RA |  |
| Veto Counter |  |