| Param | Original file | Final file |
|---|---|---|
| Filename | modeM0/AS1C03_015T04_9000002328_15734cztM0_level2.evt | modeM0/AS1C03_015T04_9000002328_15734cztM0_level2_quad_clean.evt |
| Size (bytes) | 456,932,160 | 129,913,920 |
| Size | 435.8 MB | 123.9 MB |
| Events in quadrant A | 3,060,228 | 880,073 |
| Events in quadrant B | 3,158,739 | 908,293 |
| Events in quadrant C | 3,128,363 | 863,410 |
| Events in quadrant D | 4,049,136 | 829,760 |
| Mode SS | |||
|---|---|---|---|
| Quadrant | BADHDUFLAG | Total packets | Discarded packets |
| A | 0 | 132 | 0 |
| B | 0 | 132 | 0 |
| C | 0 | 132 | 0 |
| D | 0 | 132 | 0 |
| Mode M0 | |||
|---|---|---|---|
| Quadrant | BADHDUFLAG | Total packets | Discarded packets |
| A | 0 | 13413 | 3 |
| B | 0 | 13585 | 2 |
| C | 0 | 13602 | 2 |
| D | 0 | 16627 | 2 |
| Mode M9 | |||
|---|---|---|---|
| Quadrant | BADHDUFLAG | Total packets | Discarded packets |
| A | 0 | 15 | 0 |
| B | 0 | 15 | 0 |
| C | 0 | 15 | 0 |
| D | 0 | 16 | 0 |
| Quadrant | Total seconds | Saturated seconds | Saturation percentage |
|---|---|---|---|
| A | 6500 | 21 | 0.323077% |
| B | 6500 | 26 | 0.400000% |
| C | 6500 | 58 | 0.892308% |
| D | 6500 | 264 | 4.061538% |
Noise dominated data is calculated using 1-second bins in cleaned event files. If a bin has >2000 counts, and if more than 50% of those come from <1% of pixels, then it is considered to be noise-dominated and hence unusable.
| Quadrant | # 1 sec bins | Bins with >0 counts | Bins with >2000 counts | High rate bins dominated by noise | Noise dominated (total time) | Noise dominated (detector-on time) | Marked lightcurve |
|---|---|---|---|---|---|---|---|
| A | 7806 | 6502 | 6 | 6 | 0.08% | 0.09% | 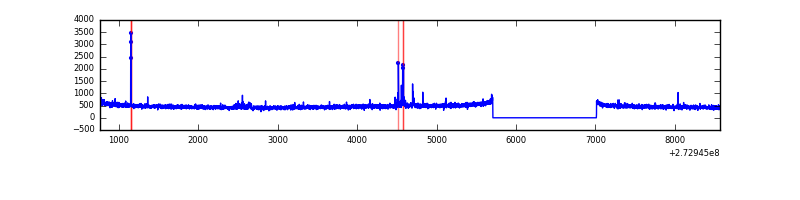 |
| B | 7806 | 6502 | 0 | 0 | 0.00% | 0.00% | 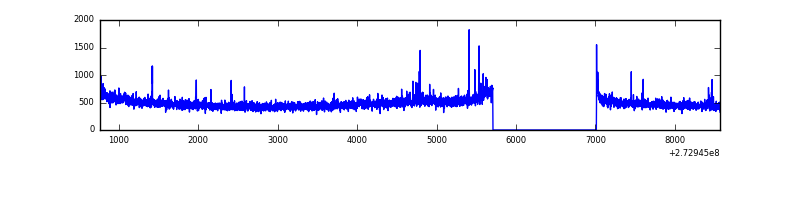 |
| C | 7806 | 6502 | 0 | 0 | 0.00% | 0.00% | 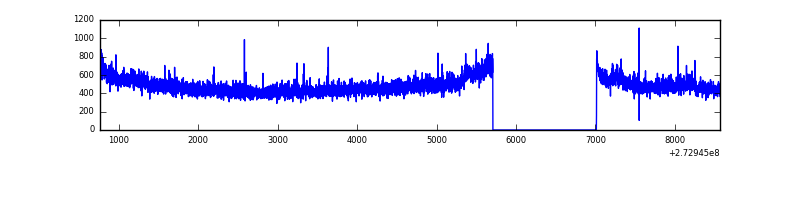 |
| D | 7806 | 6502 | 196 | 196 | 2.51% | 3.01% | 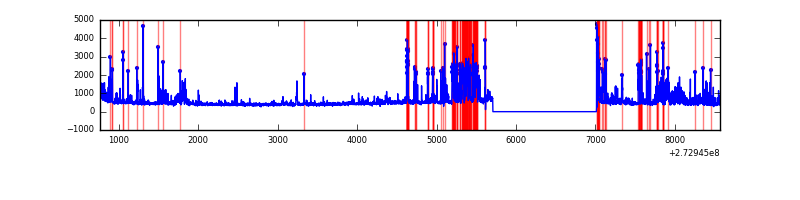 |
Top three noisy pixels from each quadrant. If the there are fewer than three noisy pixels in the level2.evt file, extra rows are filled as -1
| Pixel properties | Quadrant properties | ||||||
|---|---|---|---|---|---|---|---|
| Quadrant | DetID | PixID | Counts | Sigma | Mean | Median | Sigma |
| A | 13 | 248 | 40379 | 256.58 | 776 | 760 | 154.4 |
| A | 15 | 239 | 17097 | 105.8 | 776 | 760 | 154.4 |
| A | 15 | 157 | 14336 | 87.92 | 776 | 760 | 154.4 |
| B | 5 | 65 | 22211 | 147.5 | 784 | 765 | 145.4 |
| B | 3 | 209 | 18736 | 123.6 | 784 | 765 | 145.4 |
| B | 0 | 219 | 16625 | 109.08 | 784 | 765 | 145.4 |
| C | 14 | 238 | 123230 | 713.11 | 745 | 750 | 171.8 |
| C | 3 | 233 | 82568 | 476.36 | 745 | 750 | 171.8 |
| C | 8 | 222 | 6733 | 34.83 | 745 | 750 | 171.8 |
| D | 1 | 52 | 1108899 | 5890.69 | 732 | 714 | 188.1 |
| D | 8 | 173 | 55000 | 288.56 | 732 | 714 | 188.1 |
| D | 2 | 234 | 27079 | 140.15 | 732 | 714 | 188.1 |
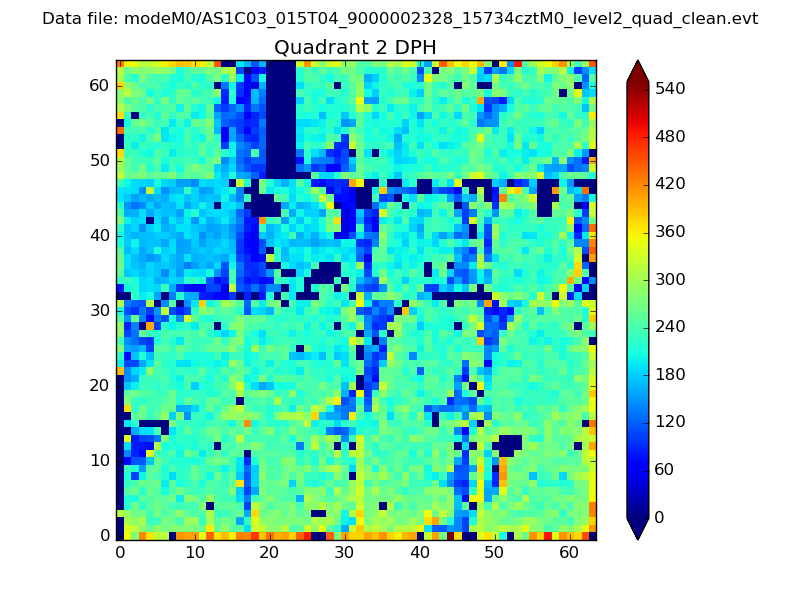
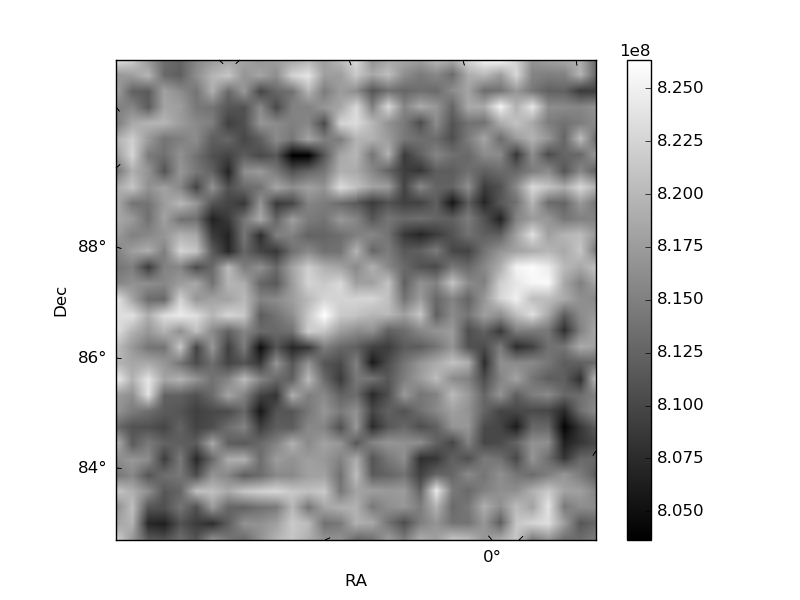
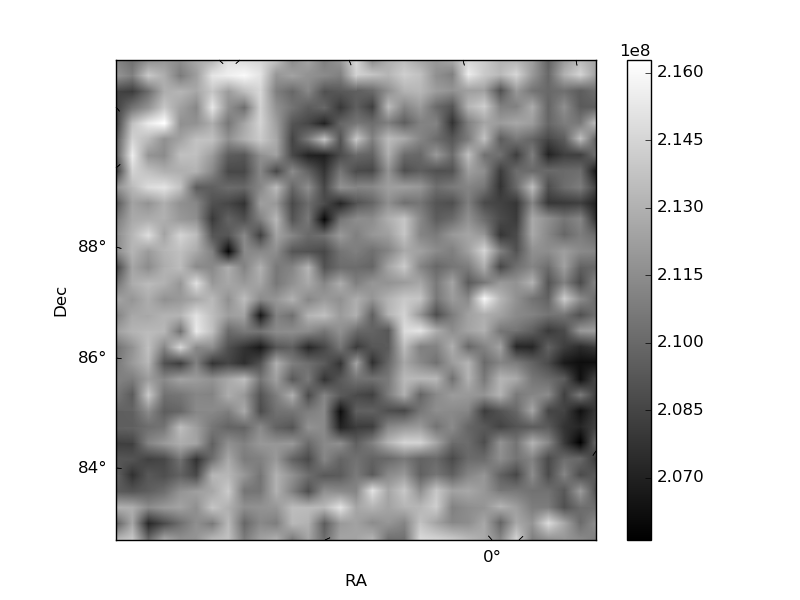
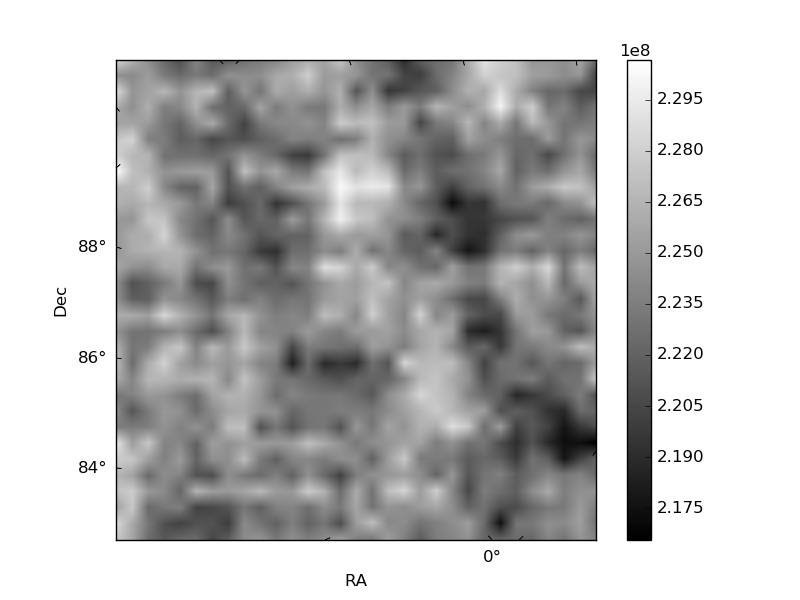
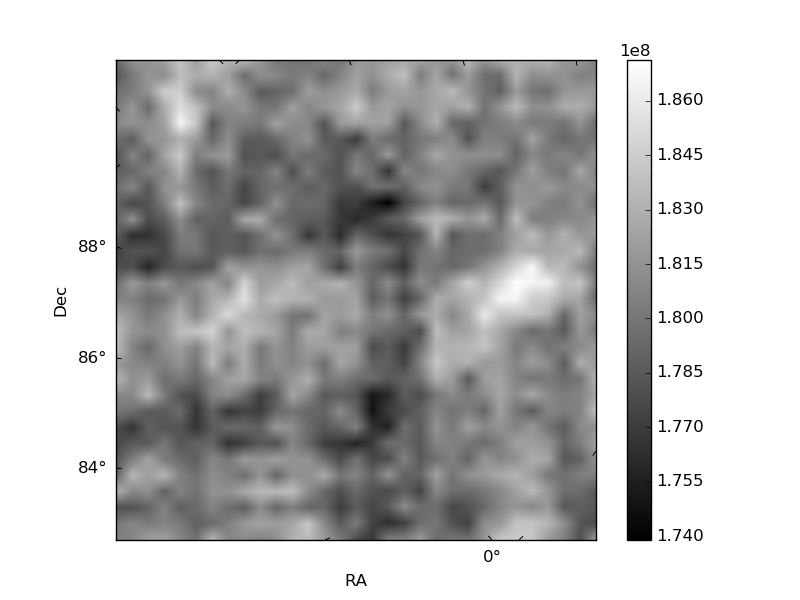
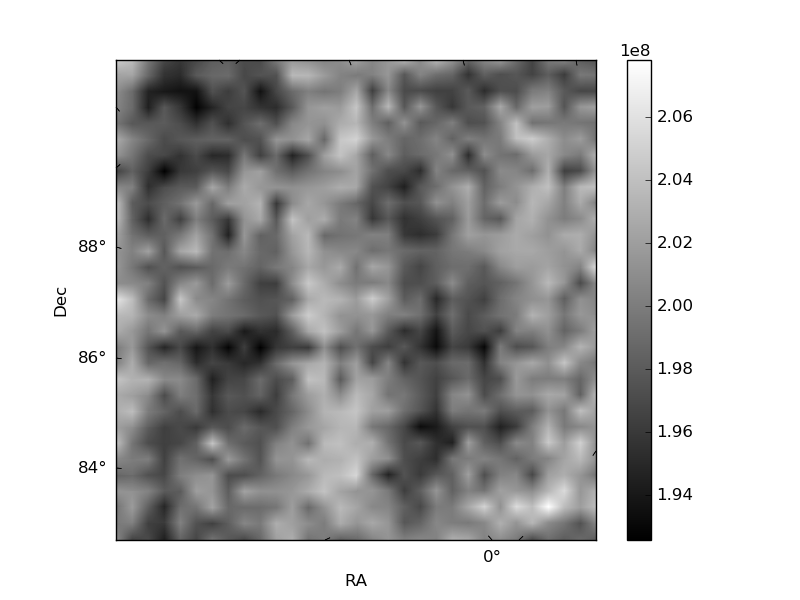
Histogram calculated using DETX and DETY for each event in the final _common_clean file
| Quadrant A | 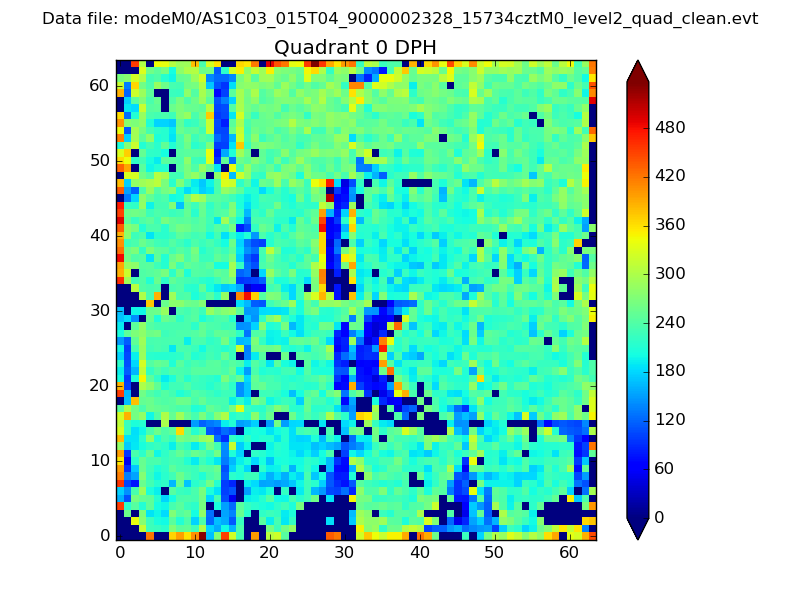 |
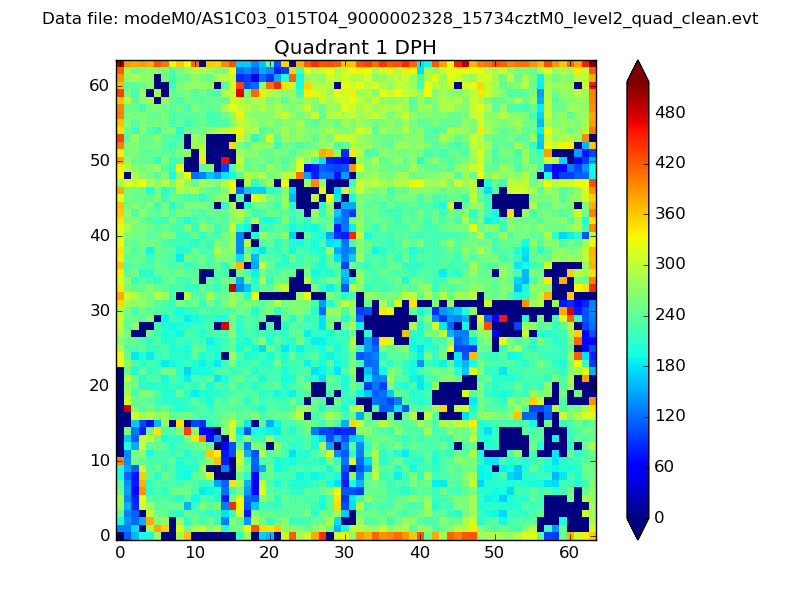 |
Quadrant B |
|---|---|---|---|
| Quadrant D | 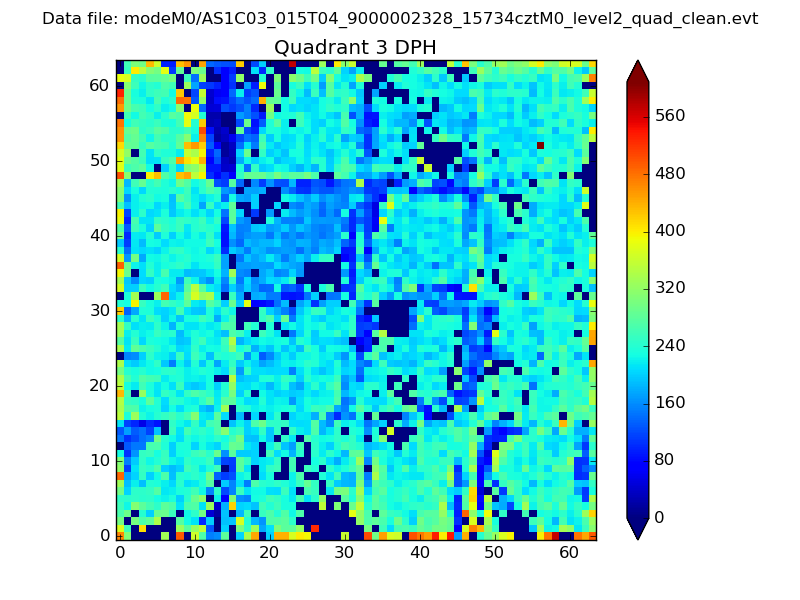 |
 |
Quadrant C |
| Plot type | Count rate plots | Images |
|---|---|---|
| Comparison with Poisson distribution Blue bars denote a histogram of data divided into 1 sec bins. Red curve is a Poisson curve with rate = median count rate of data. |
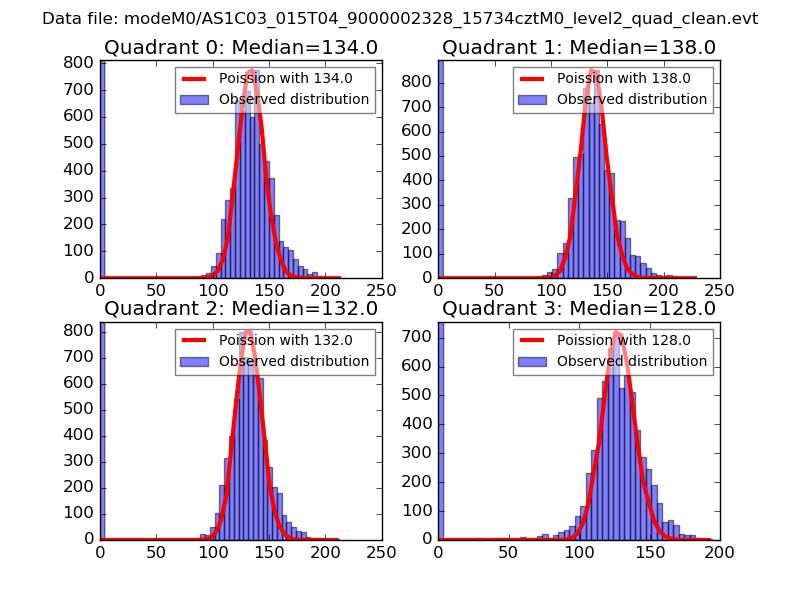 |
 |
| Quadrant-wise count rates Data is divided into 100 sec bins |
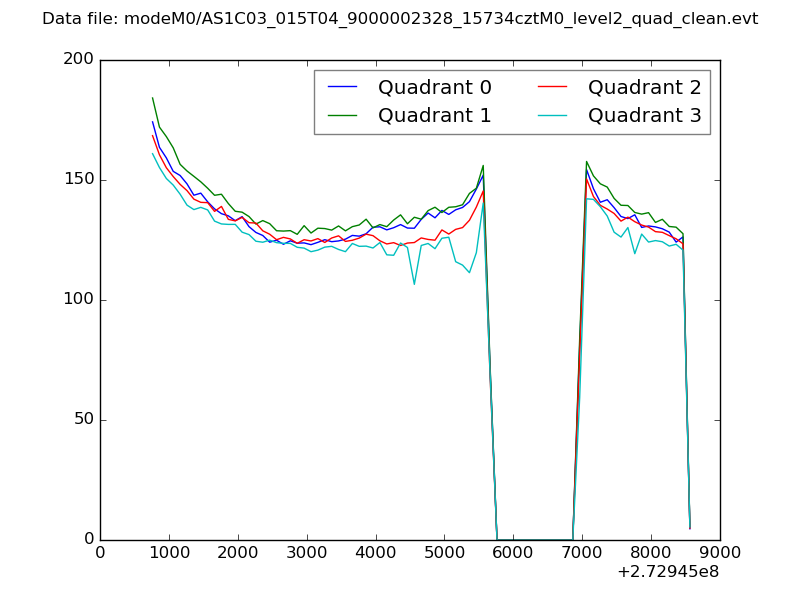 |
|
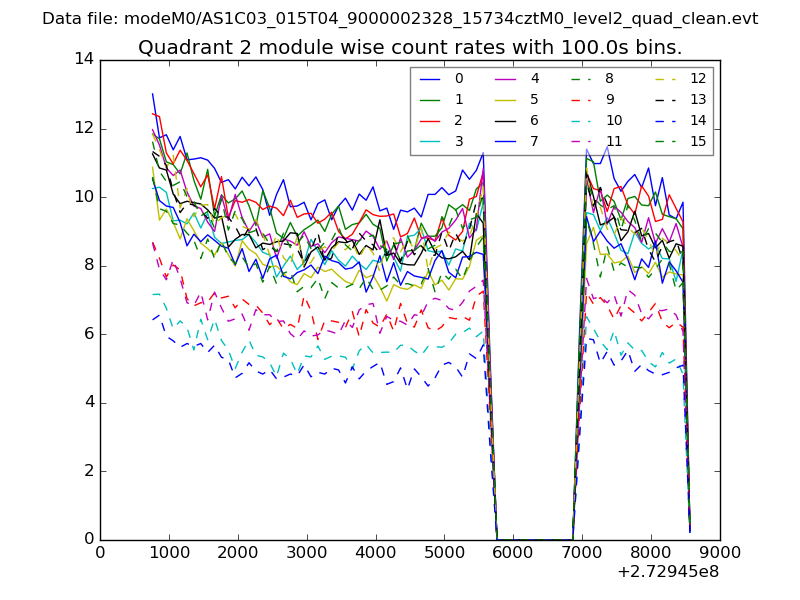
| Module-wise count rates for Quadrant A Data is divided into 100 sec bins |
 |
 |
| Module-wise count rates for Quadrant B Data is divided into 100 sec bins |
 |
 |
| Module-wise count rates for Quadrant C Data is divided into 100 sec bins |
 |
 |
| Module-wise count rates for Quadrant D Data is divided into 100 sec bins |
 |
 |
| Parameter | Plot |
|---|---|
| CZT HV Monitor | 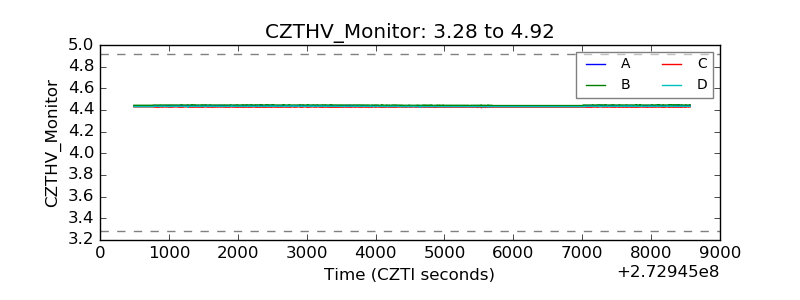 |
| D_VDD | 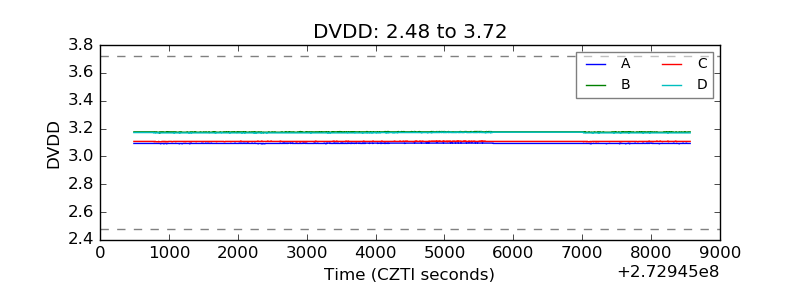 |
| Temperature 1 | 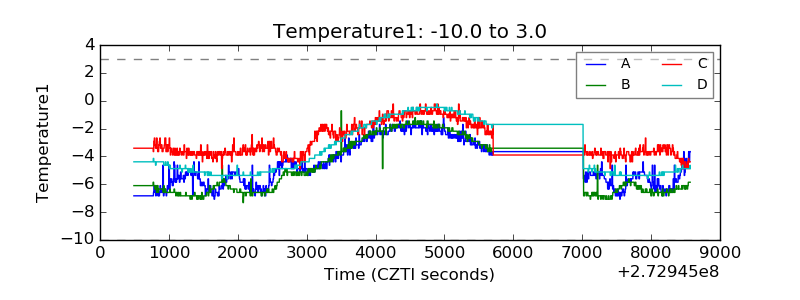 |
| Veto HV Monitor | 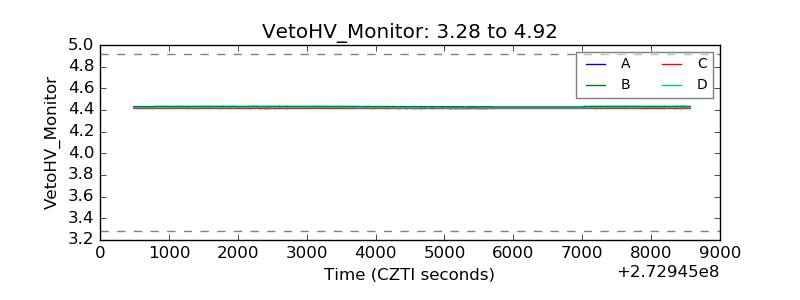 |
| Veto LLD |  |
| Alpha Counter | 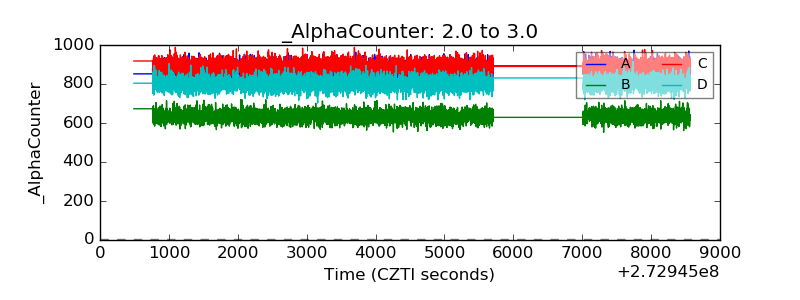 |
| _CPM_Rate | 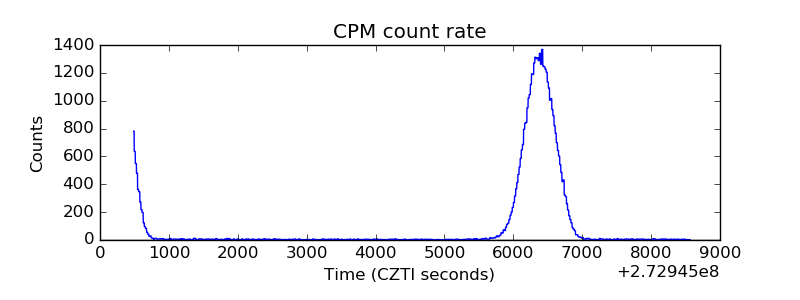 |
| CZT Counter | 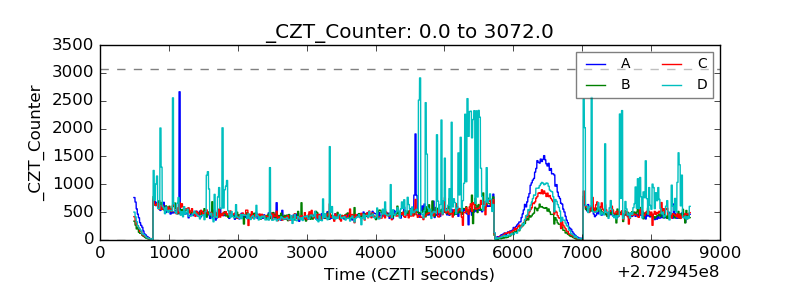 |
| +2.5 Volts monitor |  |
| +5 Volts monitor |  |
| _ROLL_ROT |  |
| _Roll_DEC | 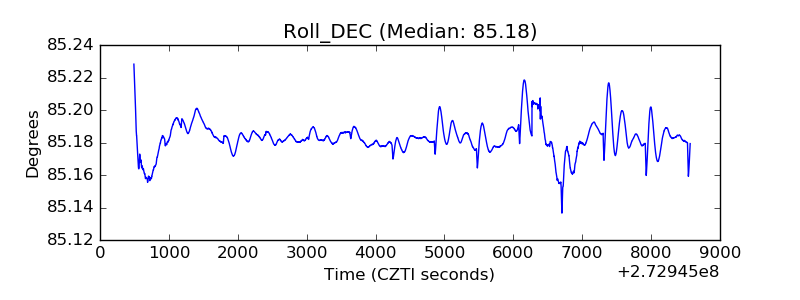 |
| _Roll_RA | 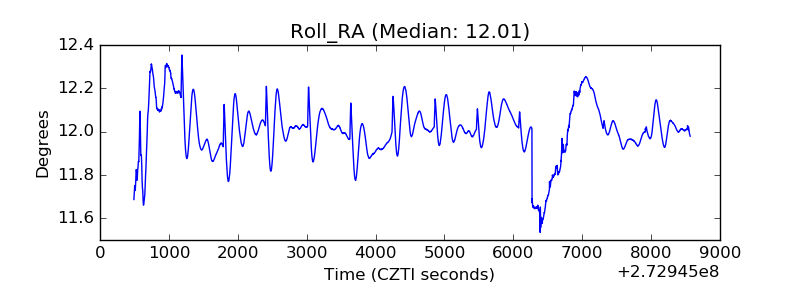 |
| Veto Counter |  |