| Param | Original file | Final file |
|---|---|---|
| Filename | modeM0/AS1C03_015T04_9000002328_15735cztM0_level2.evt | modeM0/AS1C03_015T04_9000002328_15735cztM0_level2_quad_clean.evt |
| Size (bytes) | 413,182,080 | 115,032,960 |
| Size | 394.0 MB | 109.7 MB |
| Events in quadrant A | 2,742,322 | 774,409 |
| Events in quadrant B | 2,864,756 | 796,069 |
| Events in quadrant C | 3,115,893 | 755,827 |
| Events in quadrant D | 3,380,277 | 736,790 |
| Mode SS | |||
|---|---|---|---|
| Quadrant | BADHDUFLAG | Total packets | Discarded packets |
| A | 0 | 122 | 0 |
| B | 0 | 122 | 0 |
| C | 0 | 122 | 0 |
| D | 0 | 122 | 0 |
| Mode M0 | |||
|---|---|---|---|
| Quadrant | BADHDUFLAG | Total packets | Discarded packets |
| A | 0 | 12304 | 2 |
| B | 0 | 12535 | 1 |
| C | 0 | 12897 | 1 |
| D | 0 | 14390 | 1 |
| Mode M9 | |||
|---|---|---|---|
| Quadrant | BADHDUFLAG | Total packets | Discarded packets |
| A | 0 | 11 | 0 |
| B | 0 | 11 | 0 |
| C | 0 | 11 | 0 |
| D | 0 | 11 | 0 |
| Quadrant | Total seconds | Saturated seconds | Saturation percentage |
|---|---|---|---|
| A | 6029 | 14 | 0.232211% |
| B | 6029 | 41 | 0.680046% |
| C | 6029 | 57 | 0.945430% |
| D | 6029 | 137 | 2.272350% |
Noise dominated data is calculated using 1-second bins in cleaned event files. If a bin has >2000 counts, and if more than 50% of those come from <1% of pixels, then it is considered to be noise-dominated and hence unusable.
| Quadrant | # 1 sec bins | Bins with >0 counts | Bins with >2000 counts | High rate bins dominated by noise | Noise dominated (total time) | Noise dominated (detector-on time) | Marked lightcurve |
|---|---|---|---|---|---|---|---|
| A | 7130 | 6031 | 1 | 1 | 0.01% | 0.02% | 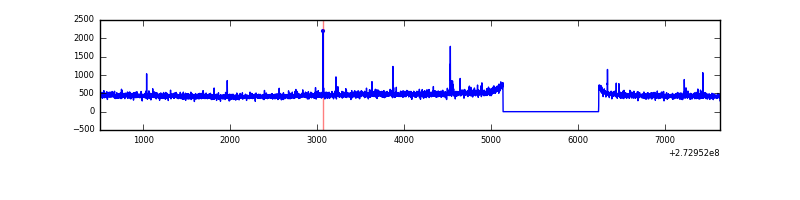 |
| B | 7130 | 6031 | 4 | 4 | 0.06% | 0.07% | 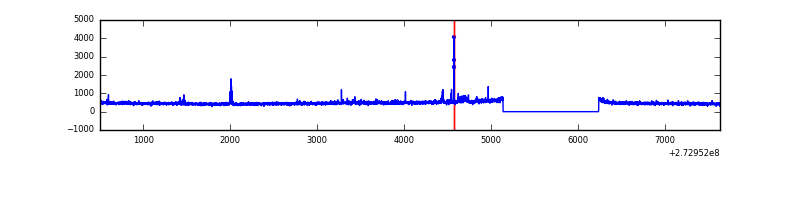 |
| C | 7130 | 6031 | 0 | 0 | 0.00% | 0.00% |  |
| D | 7130 | 6031 | 101 | 101 | 1.42% | 1.67% |  |
Top three noisy pixels from each quadrant. If the there are fewer than three noisy pixels in the level2.evt file, extra rows are filled as -1
| Pixel properties | Quadrant properties | ||||||
|---|---|---|---|---|---|---|---|
| Quadrant | DetID | PixID | Counts | Sigma | Mean | Median | Sigma |
| A | 15 | 239 | 19056 | 128.25 | 704 | 687 | 143.2 |
| A | 9 | 143 | 10446 | 68.14 | 704 | 687 | 143.2 |
| A | 0 | 226 | 6363 | 39.63 | 704 | 687 | 143.2 |
| B | 4 | 216 | 36413 | 269.42 | 706 | 688 | 132.6 |
| B | 5 | 65 | 16358 | 118.17 | 706 | 688 | 132.6 |
| B | 12 | 111 | 15267 | 109.95 | 706 | 688 | 132.6 |
| C | 3 | 233 | 373435 | 2401.19 | 671 | 674 | 155.2 |
| C | 14 | 238 | 105157 | 673.04 | 671 | 674 | 155.2 |
| C | 8 | 222 | 6649 | 38.49 | 671 | 674 | 155.2 |
| D | 1 | 52 | 776208 | 4539.62 | 668 | 651 | 170.8 |
| D | 2 | 234 | 25712 | 146.69 | 668 | 651 | 170.8 |
| D | 15 | 145 | 19609 | 110.97 | 668 | 651 | 170.8 |
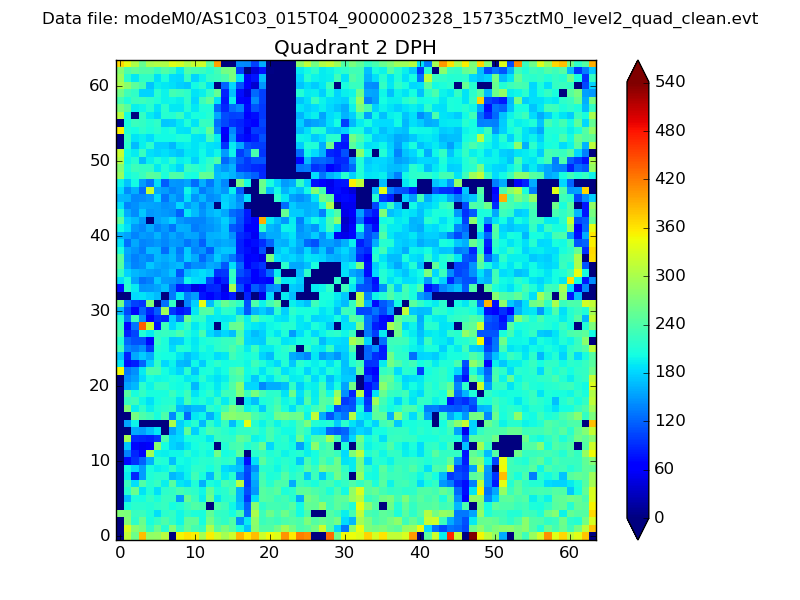
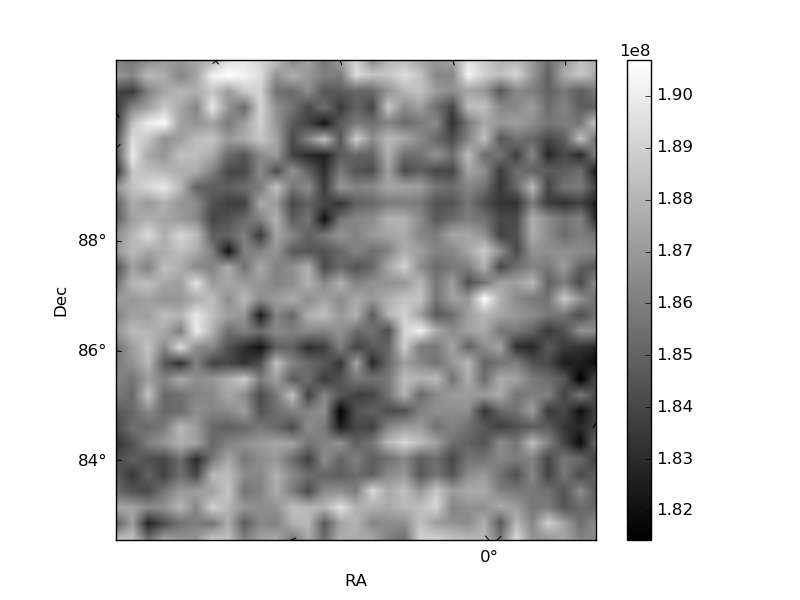
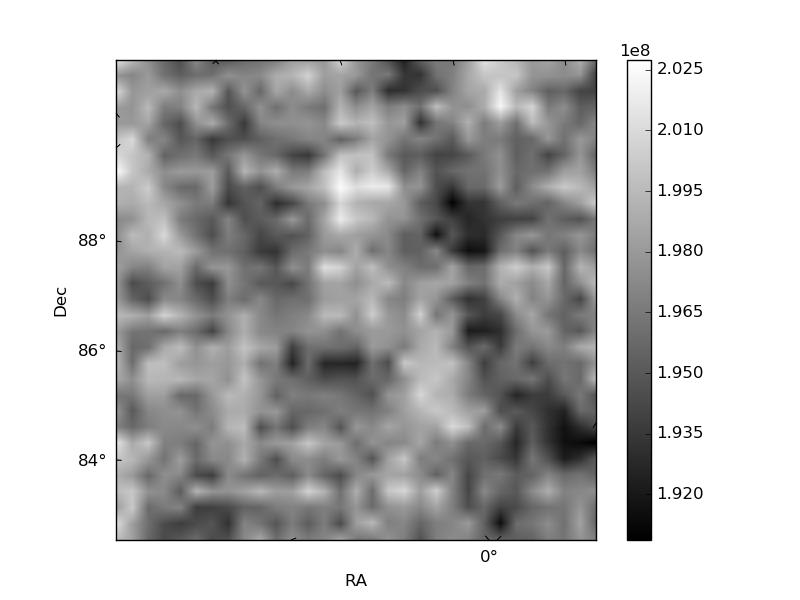
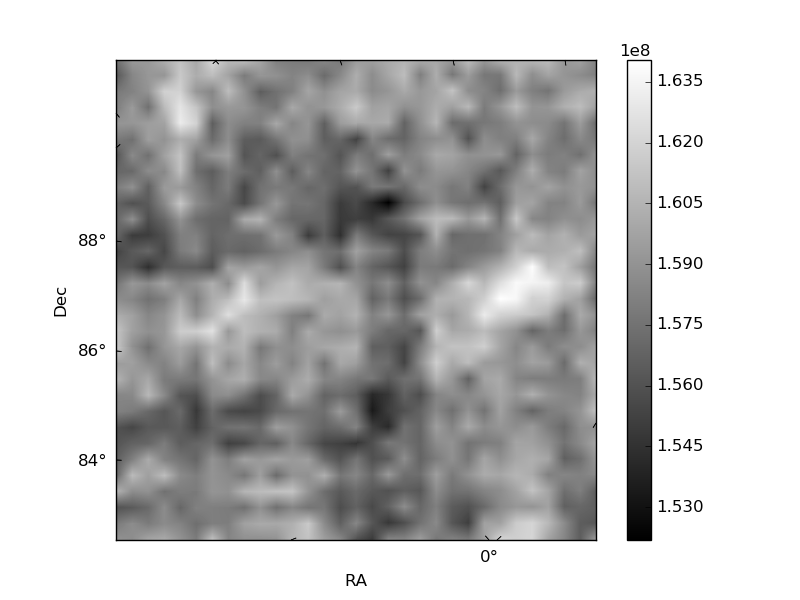
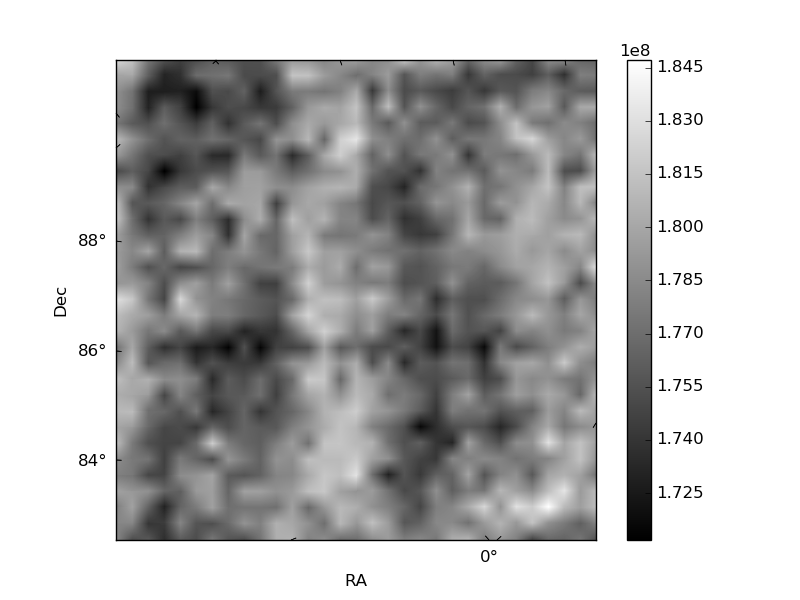
Histogram calculated using DETX and DETY for each event in the final _common_clean file
| Quadrant A | 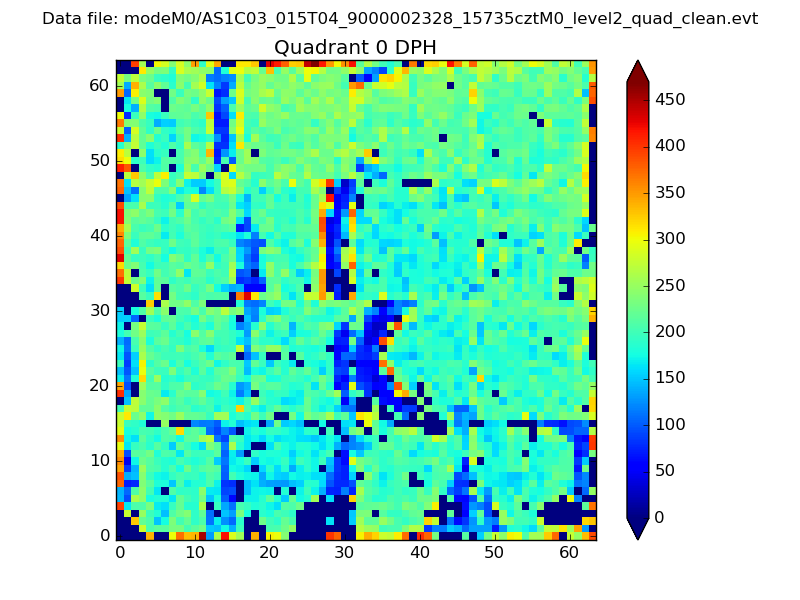 |
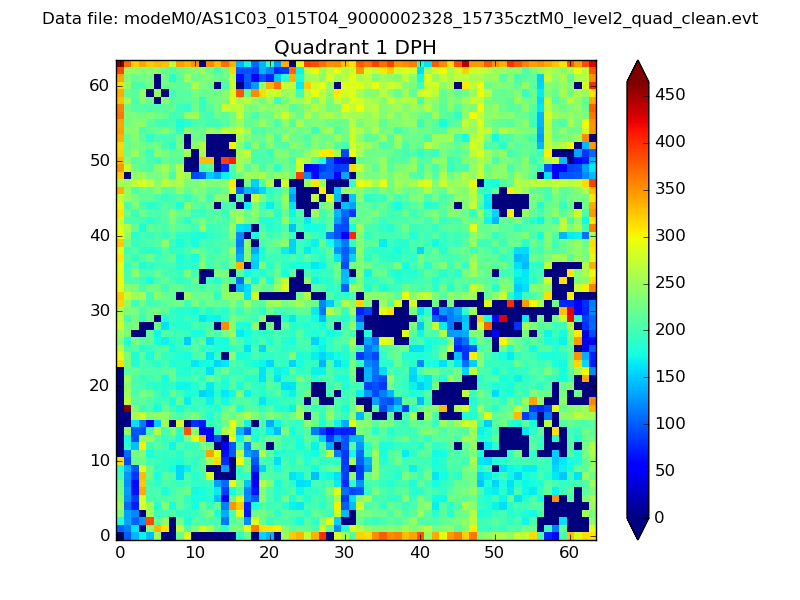 |
Quadrant B |
|---|---|---|---|
| Quadrant D | 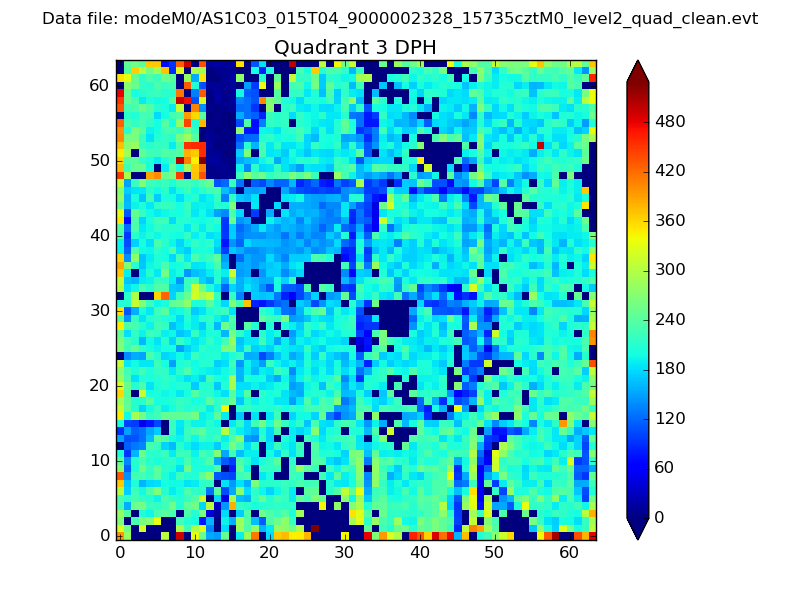 |
 |
Quadrant C |
| Plot type | Count rate plots | Images |
|---|---|---|
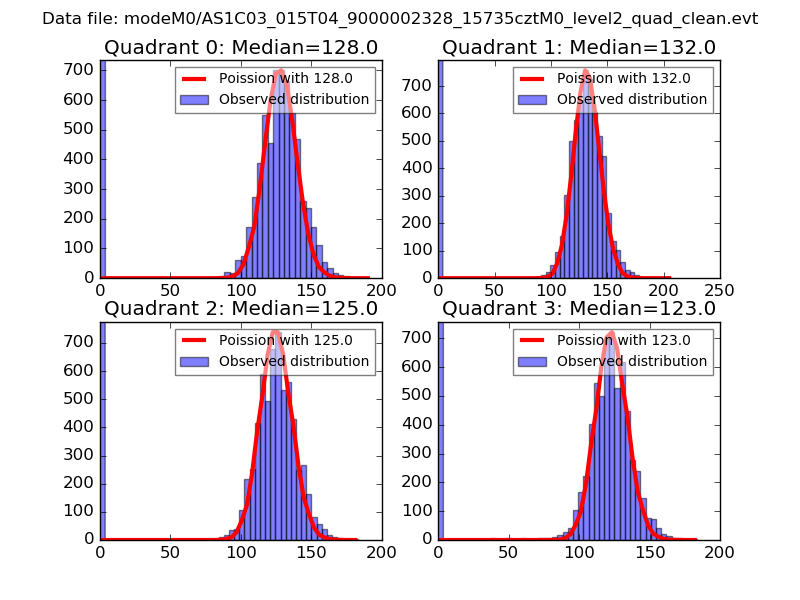
| Comparison with Poisson distribution Blue bars denote a histogram of data divided into 1 sec bins. Red curve is a Poisson curve with rate = median count rate of data. |
 |
 |
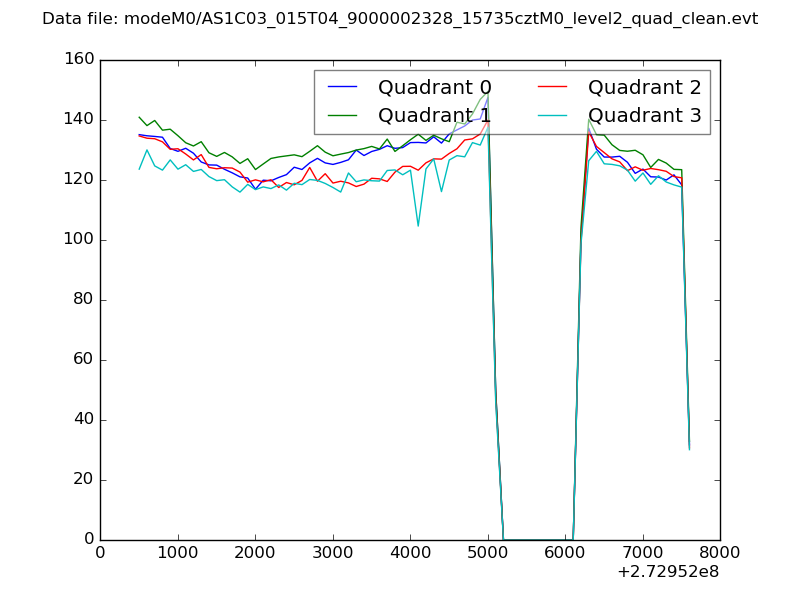
| Quadrant-wise count rates Data is divided into 100 sec bins |
 |
|
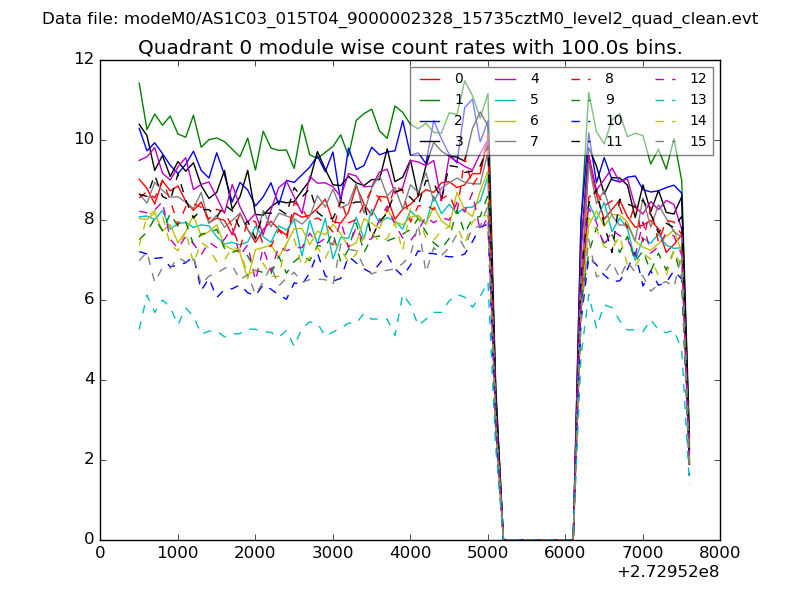
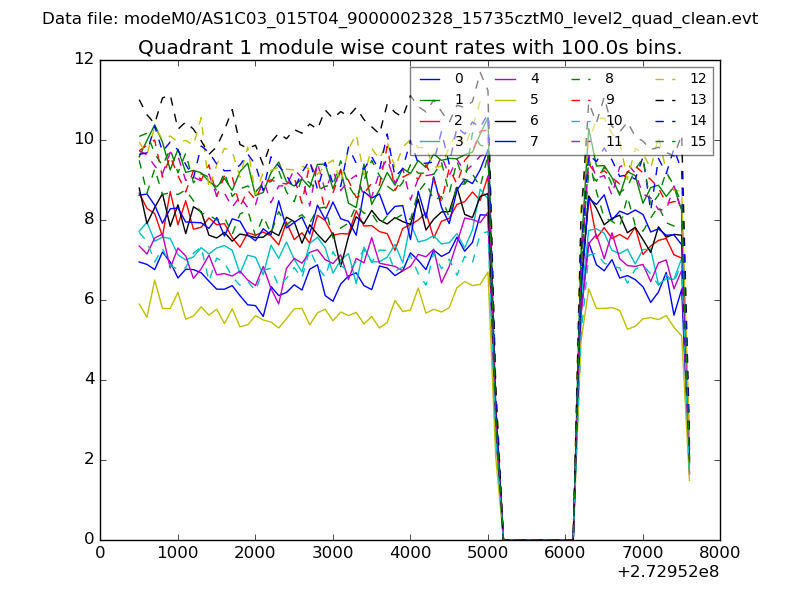
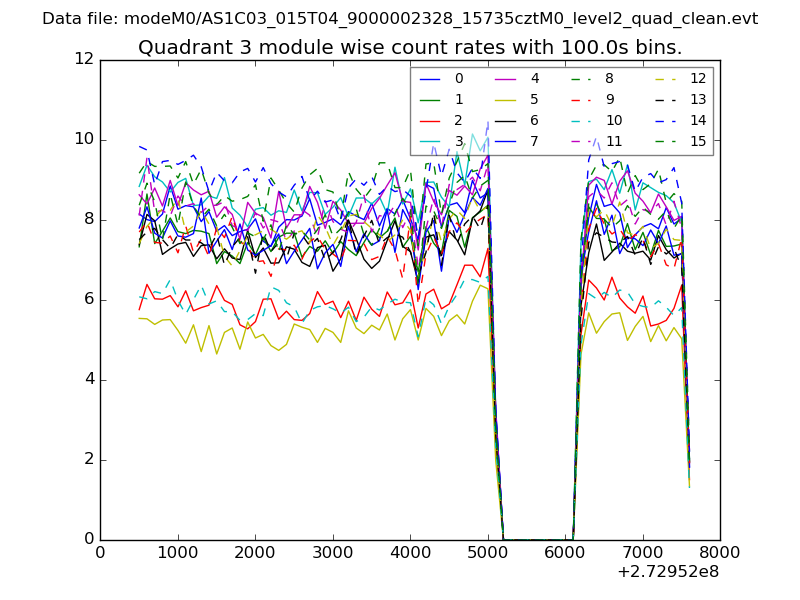
| Module-wise count rates for Quadrant A Data is divided into 100 sec bins |
 |
 |
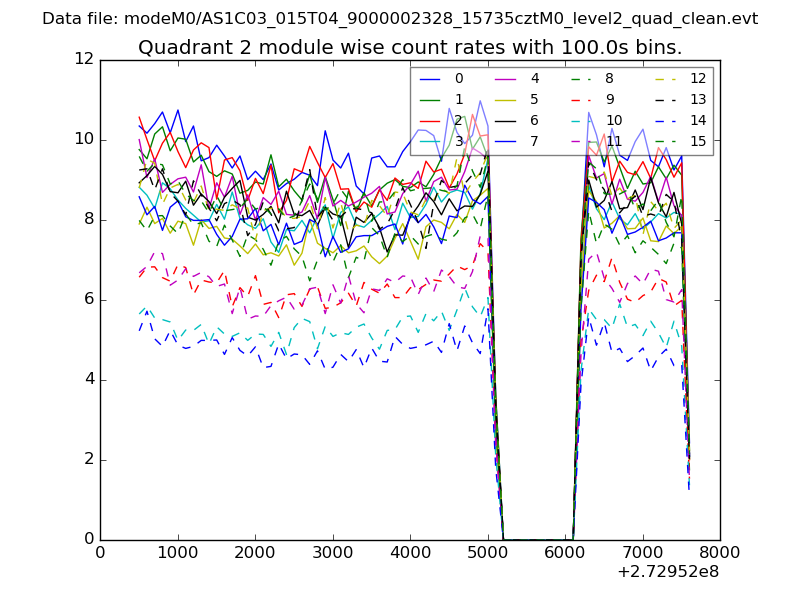
| Module-wise count rates for Quadrant B Data is divided into 100 sec bins |
 |
 |
| Module-wise count rates for Quadrant C Data is divided into 100 sec bins |
 |
 |
| Module-wise count rates for Quadrant D Data is divided into 100 sec bins |
 |
 |
| Parameter | Plot |
|---|---|
| CZT HV Monitor | 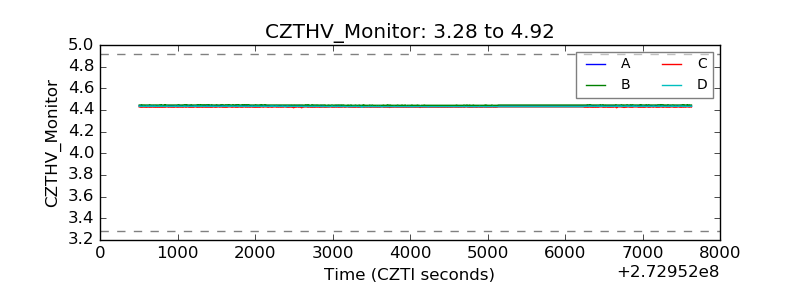 |
| D_VDD | 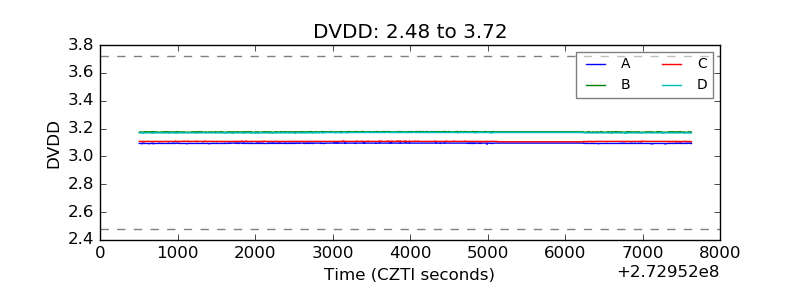 |
| Temperature 1 | 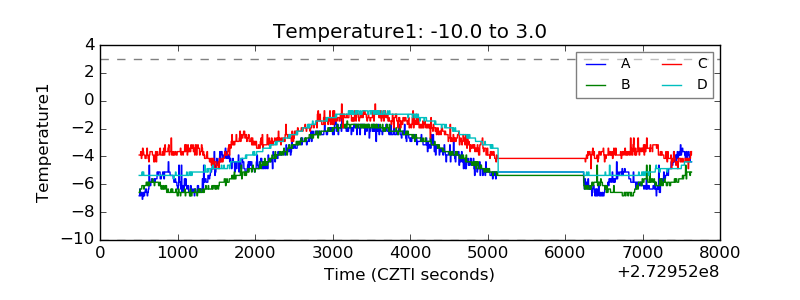 |
| Veto HV Monitor | 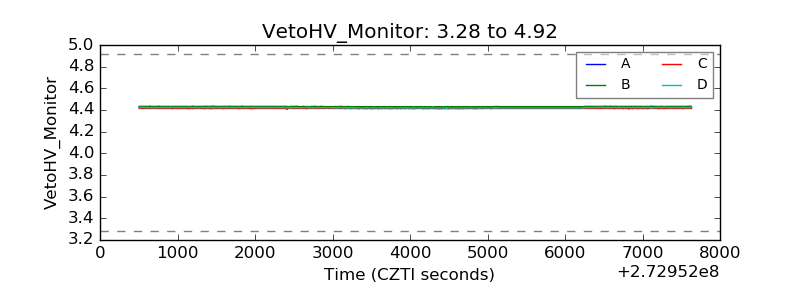 |
| Veto LLD | 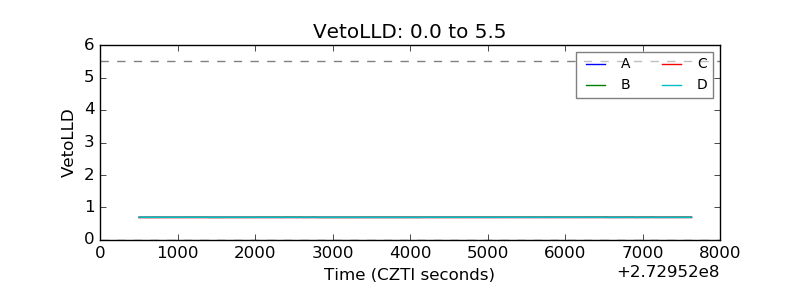 |
| Alpha Counter | 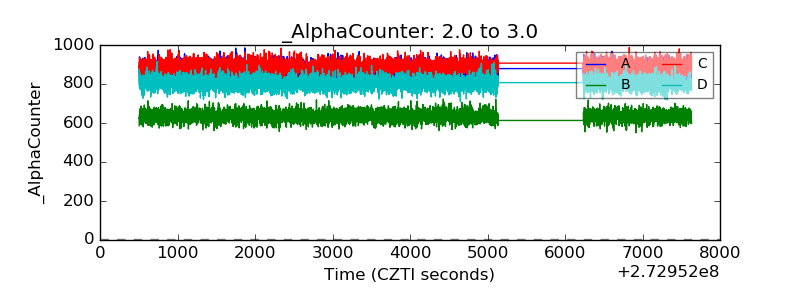 |
| _CPM_Rate | 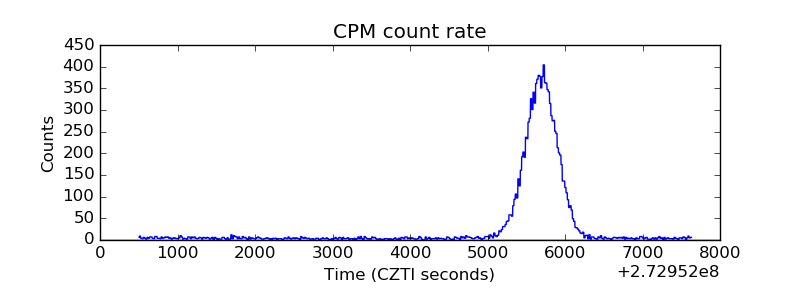 |
| CZT Counter | 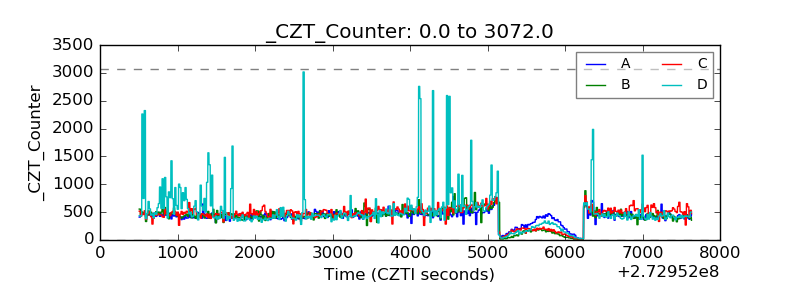 |
| +2.5 Volts monitor |  |
| +5 Volts monitor | 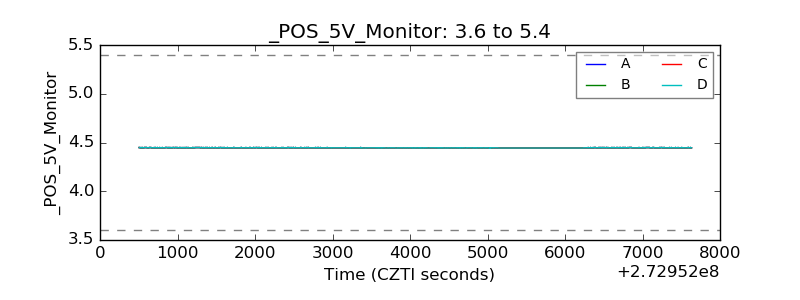 |
| _ROLL_ROT | 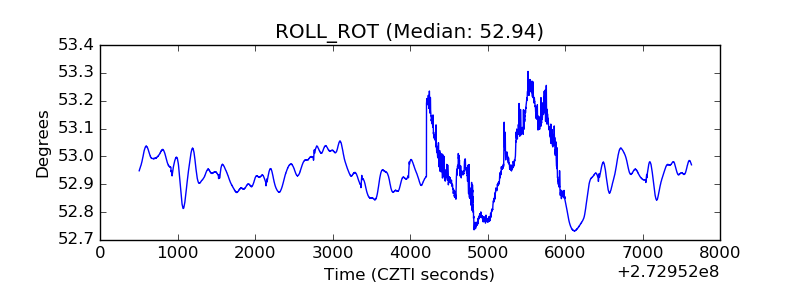 |
| _Roll_DEC | 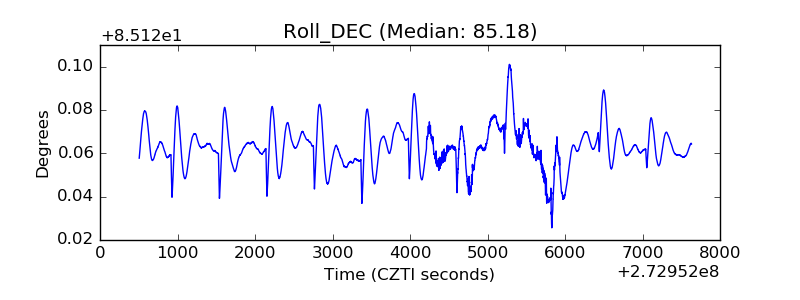 |
| _Roll_RA | 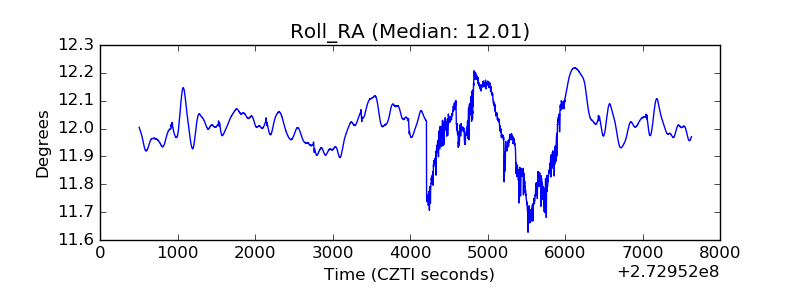 |
| Veto Counter |  |