| Param | Original file | Final file |
|---|---|---|
| Filename | modeM0/AS1C03_015T04_9000002328_15737cztM0_level2.evt | modeM0/AS1C03_015T04_9000002328_15737cztM0_level2_quad_clean.evt |
| Size (bytes) | 248,342,400 | 67,538,880 |
| Size | 236.8 MB | 64.4 MB |
| Events in quadrant A | 1,615,169 | 454,079 |
| Events in quadrant B | 1,683,016 | 463,590 |
| Events in quadrant C | 2,135,241 | 435,096 |
| Events in quadrant D | 1,834,048 | 430,558 |
| Mode SS | |||
|---|---|---|---|
| Quadrant | BADHDUFLAG | Total packets | Discarded packets |
| A | 0 | 74 | 0 |
| B | 0 | 74 | 0 |
| C | 0 | 74 | 0 |
| D | 0 | 74 | 0 |
| Mode M0 | |||
|---|---|---|---|
| Quadrant | BADHDUFLAG | Total packets | Discarded packets |
| A | 0 | 7446 | 0 |
| B | 0 | 7552 | 0 |
| C | 0 | 8884 | 0 |
| D | 0 | 7903 | 0 |
| Quadrant | Total seconds | Saturated seconds | Saturation percentage |
|---|---|---|---|
| A | 3704 | 1 | 0.026998% |
| B | 3704 | 7 | 0.188985% |
| C | 3704 | 22 | 0.593952% |
| D | 3704 | 15 | 0.404968% |
Noise dominated data is calculated using 1-second bins in cleaned event files. If a bin has >2000 counts, and if more than 50% of those come from <1% of pixels, then it is considered to be noise-dominated and hence unusable.
| Quadrant | # 1 sec bins | Bins with >0 counts | Bins with >2000 counts | High rate bins dominated by noise | Noise dominated (total time) | Noise dominated (detector-on time) | Marked lightcurve |
|---|---|---|---|---|---|---|---|
| A | 3705 | 3705 | 0 | 0 | 0.00% | 0.00% | 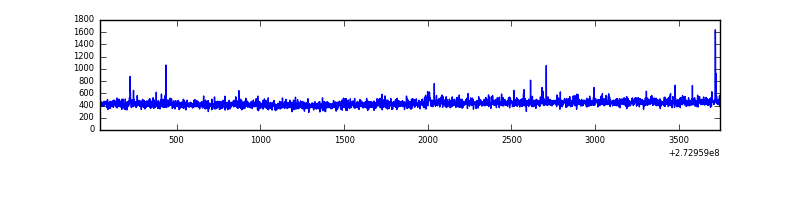 |
| B | 3705 | 3705 | 0 | 0 | 0.00% | 0.00% | 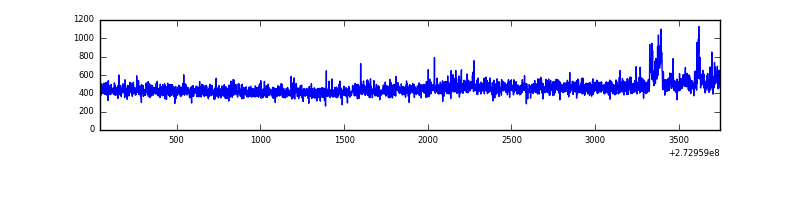 |
| C | 3705 | 3705 | 0 | 0 | 0.00% | 0.00% | 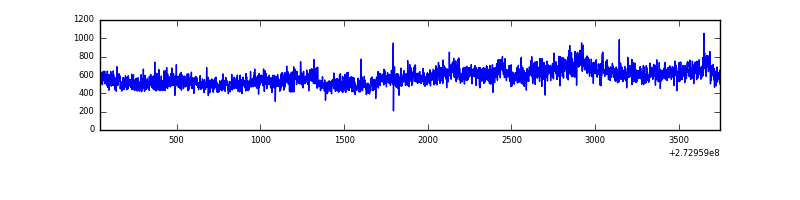 |
| D | 3705 | 3705 | 12 | 12 | 0.32% | 0.32% | 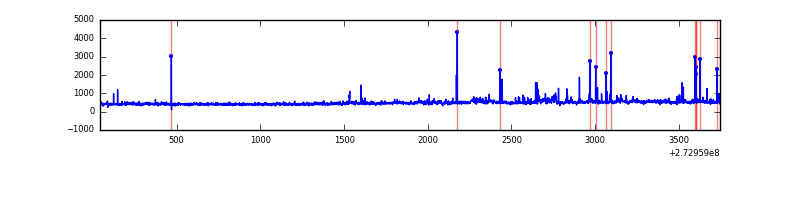 |
Top three noisy pixels from each quadrant. If the there are fewer than three noisy pixels in the level2.evt file, extra rows are filled as -1
| Pixel properties | Quadrant properties | ||||||
|---|---|---|---|---|---|---|---|
| Quadrant | DetID | PixID | Counts | Sigma | Mean | Median | Sigma |
| A | 9 | 143 | 13460 | 154.48 | 414 | 405 | 84.5 |
| A | 13 | 248 | 5307 | 58.01 | 414 | 405 | 84.5 |
| A | 0 | 226 | 3741 | 39.47 | 414 | 405 | 84.5 |
| B | 4 | 216 | 37691 | 465.7 | 414 | 403 | 80.1 |
| B | 5 | 65 | 12407 | 149.92 | 414 | 403 | 80.1 |
| B | 12 | 111 | 8654 | 103.05 | 414 | 403 | 80.1 |
| C | 3 | 233 | 514461 | 5619.32 | 393 | 394 | 91.5 |
| C | 14 | 238 | 62462 | 678.47 | 393 | 394 | 91.5 |
| C | 7 | 247 | 17586 | 187.93 | 393 | 394 | 91.5 |
| D | 1 | 52 | 153741 | 1568.46 | 401 | 388 | 97.8 |
| D | 12 | 6 | 87073 | 886.59 | 401 | 388 | 97.8 |
| D | 12 | 221 | 28500 | 287.52 | 401 | 388 | 97.8 |
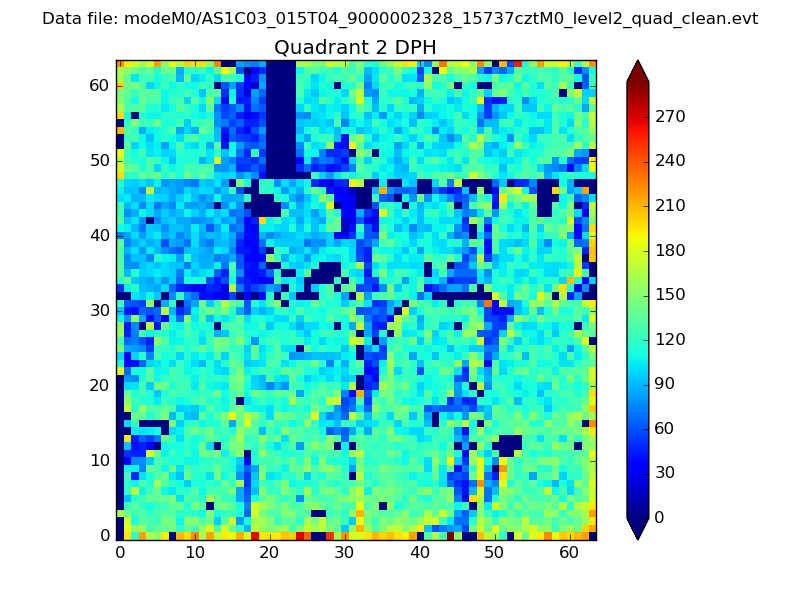
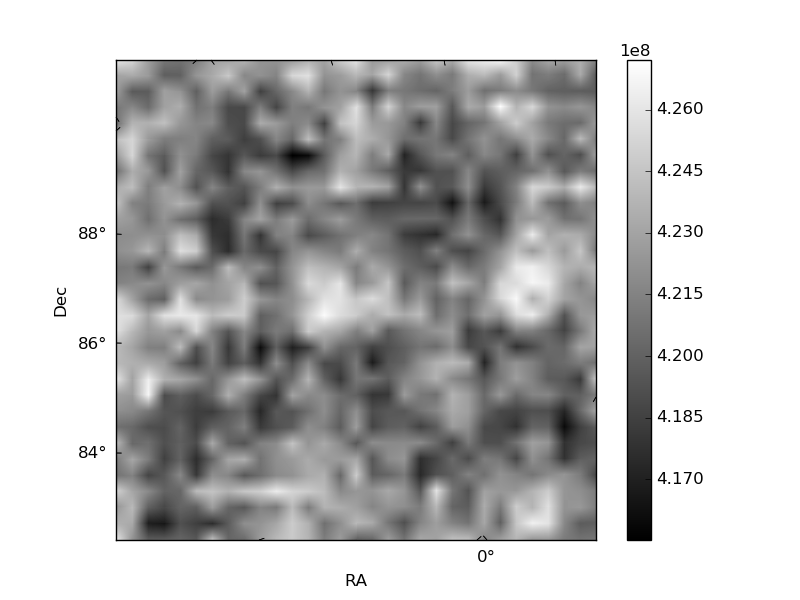
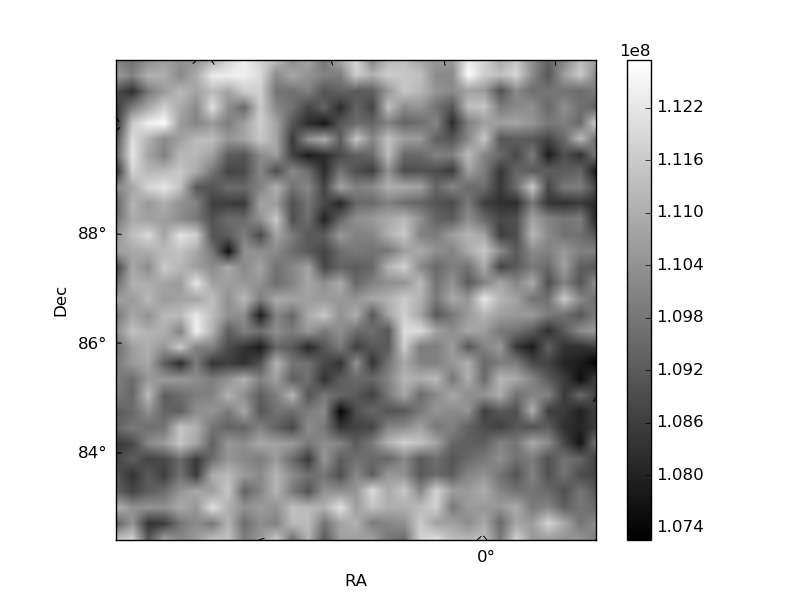
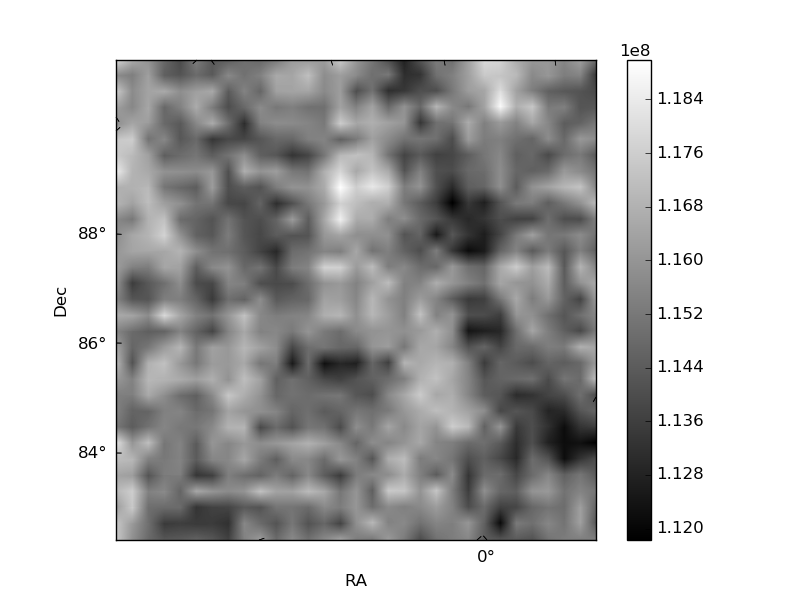
Histogram calculated using DETX and DETY for each event in the final _common_clean file
| Quadrant A | 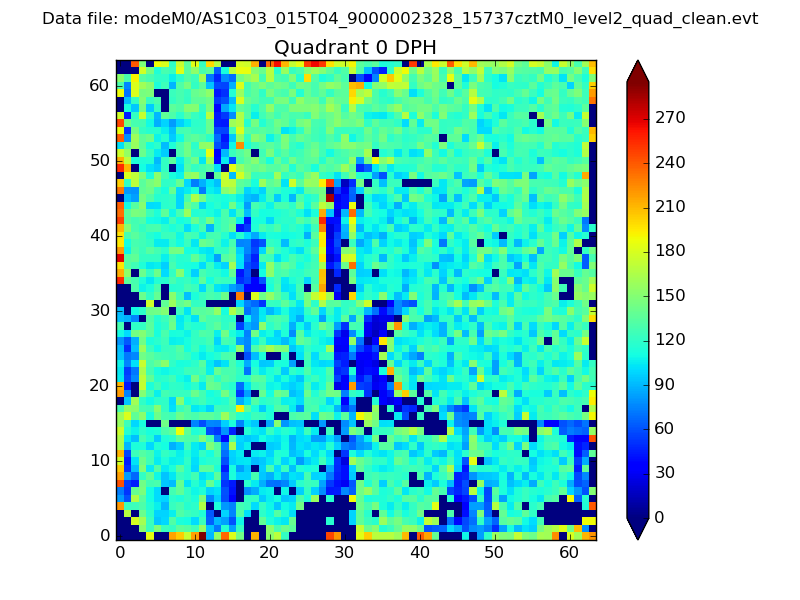 |
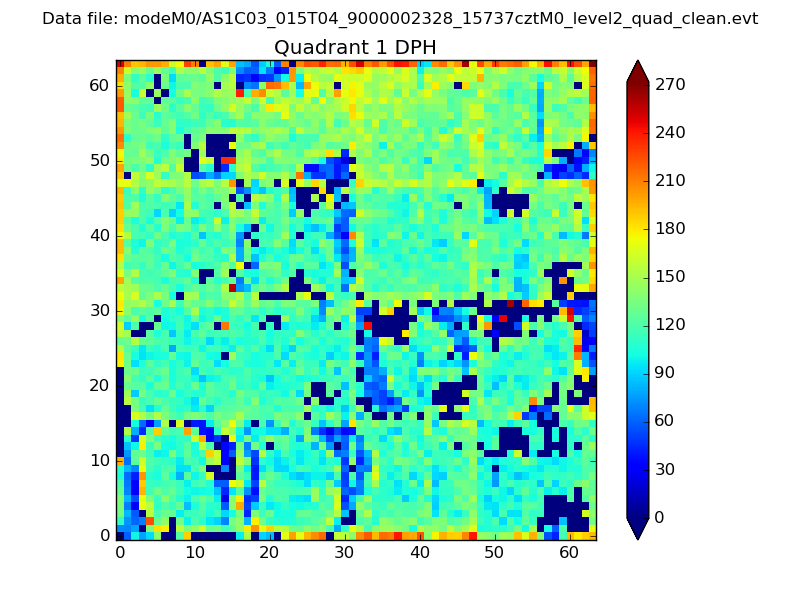 |
Quadrant B |
|---|---|---|---|
| Quadrant D | 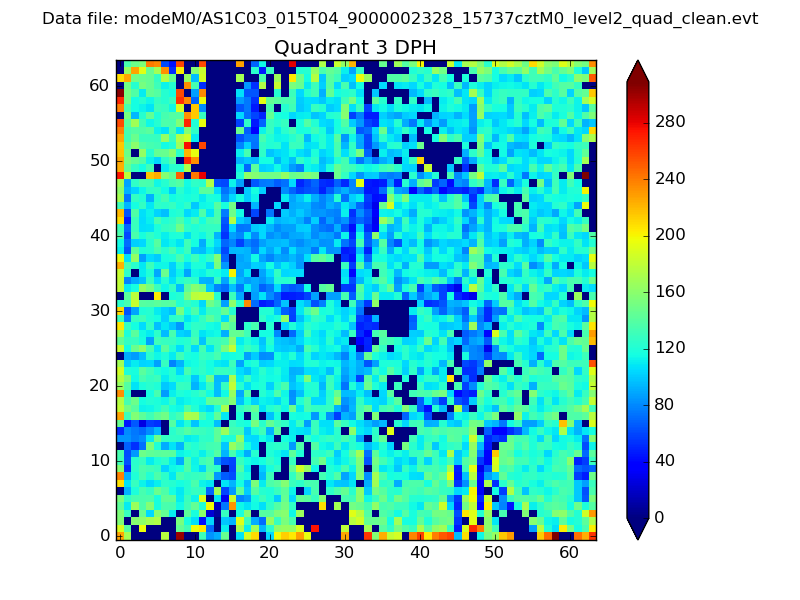 |
 |
Quadrant C |
| Plot type | Count rate plots | Images |
|---|---|---|
| Comparison with Poisson distribution Blue bars denote a histogram of data divided into 1 sec bins. Red curve is a Poisson curve with rate = median count rate of data. |
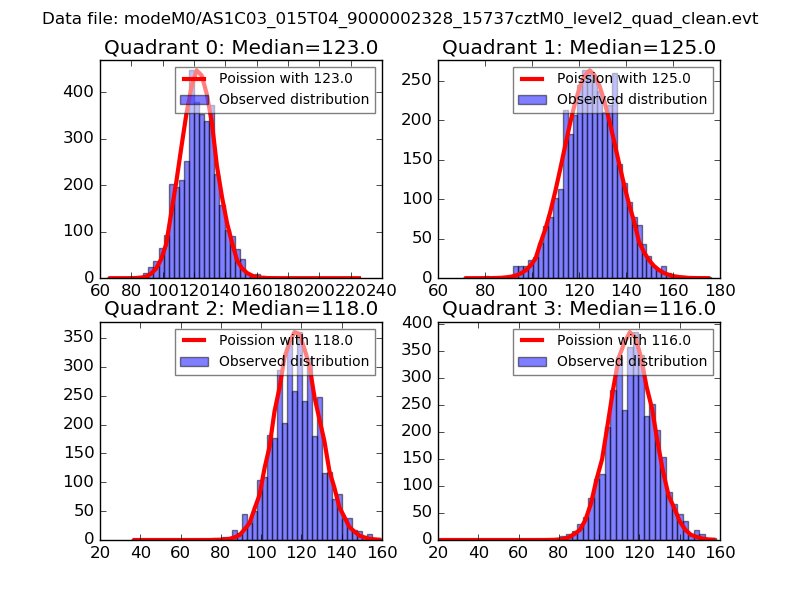 |
 |
| Quadrant-wise count rates Data is divided into 100 sec bins |
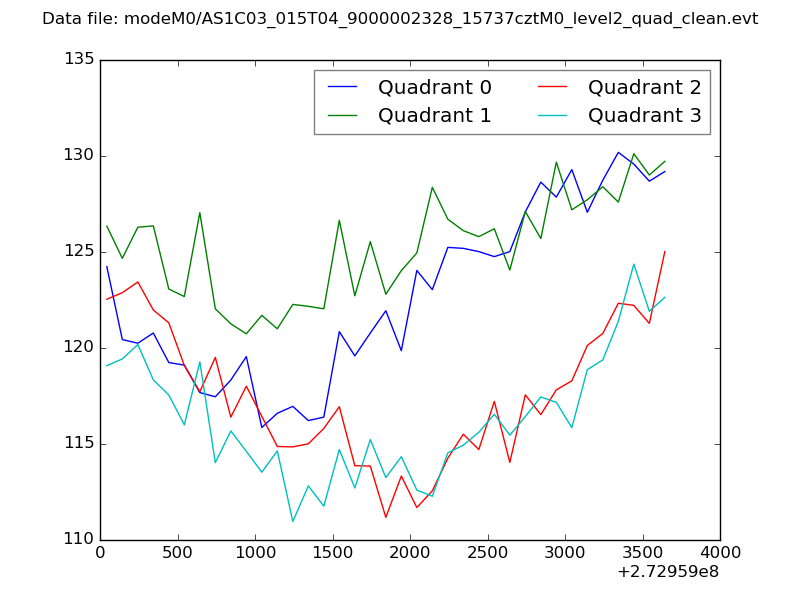 |
|
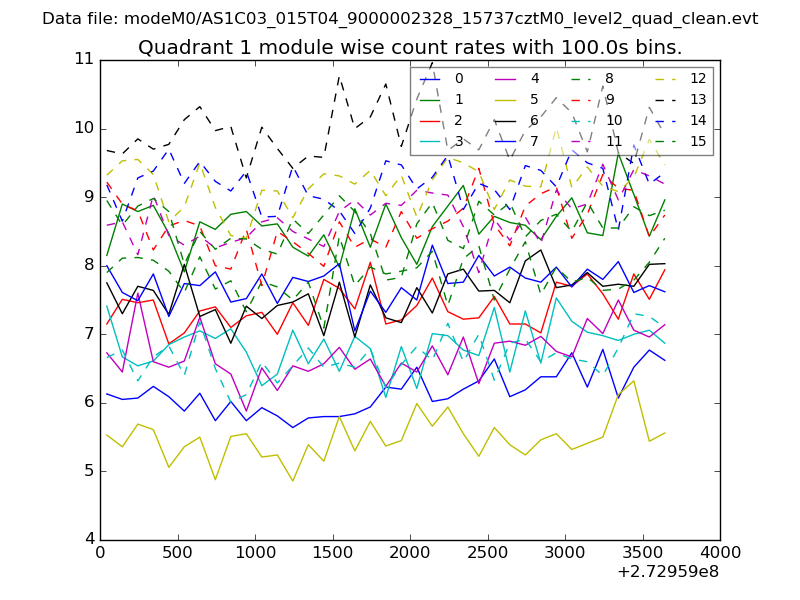
| Module-wise count rates for Quadrant A Data is divided into 100 sec bins |
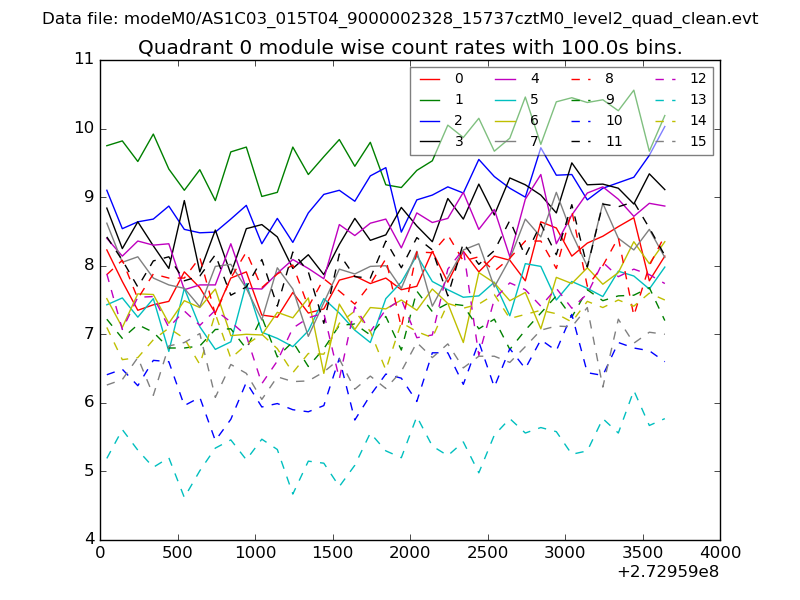 |
 |
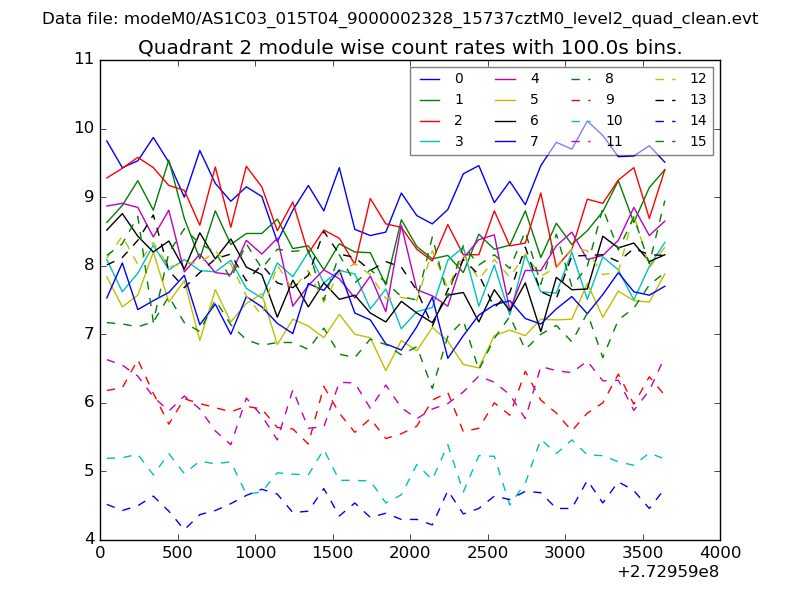
| Module-wise count rates for Quadrant B Data is divided into 100 sec bins |
 |
 |
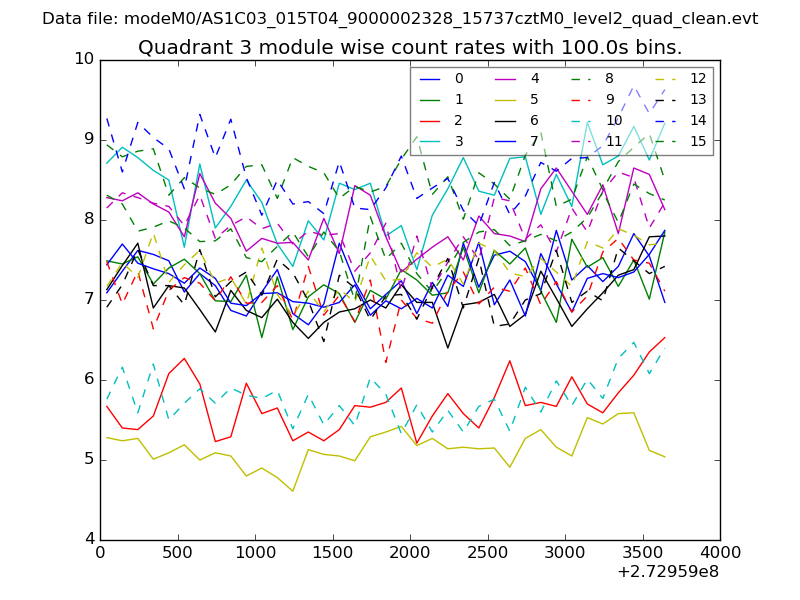
| Module-wise count rates for Quadrant C Data is divided into 100 sec bins |
 |
 |
| Module-wise count rates for Quadrant D Data is divided into 100 sec bins |
 |
 |
| Parameter | Plot |
|---|---|
| CZT HV Monitor | 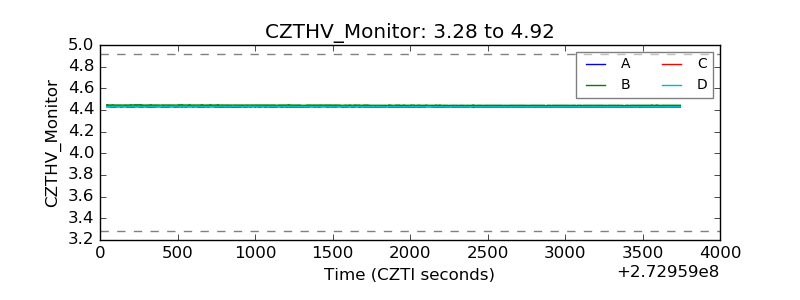 |
| D_VDD | 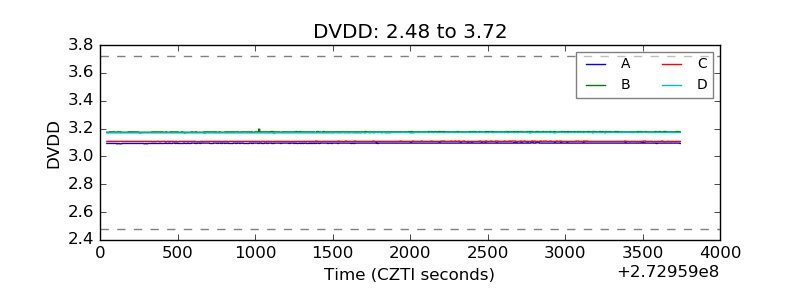 |
| Temperature 1 | 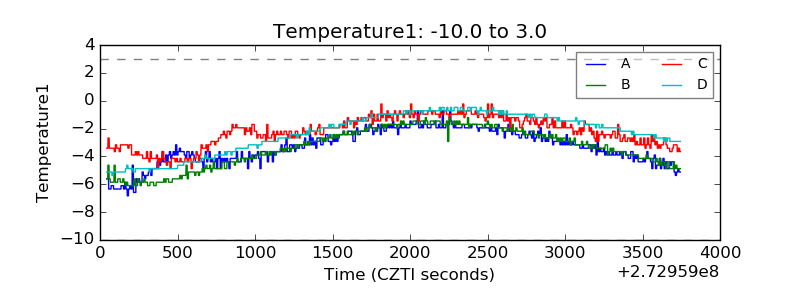 |
| Veto HV Monitor | 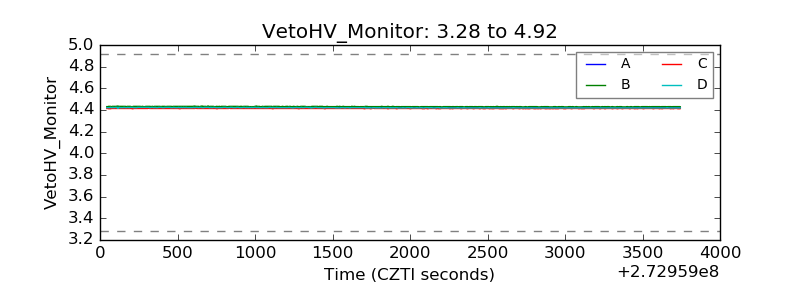 |
| Veto LLD | 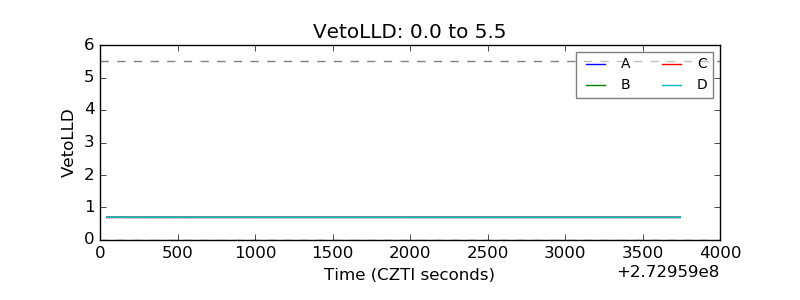 |
| Alpha Counter | 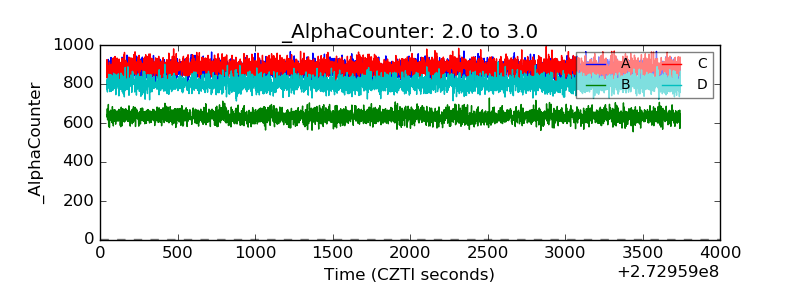 |
| _CPM_Rate | 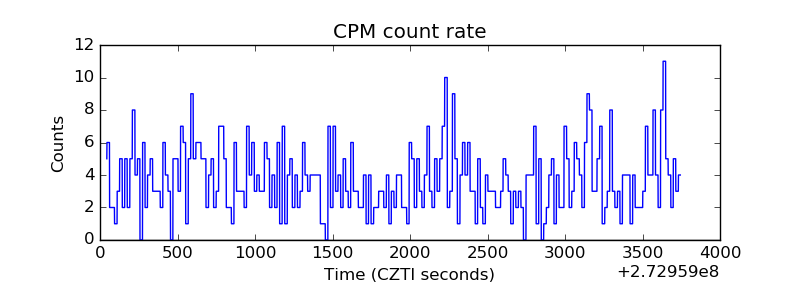 |
| CZT Counter | 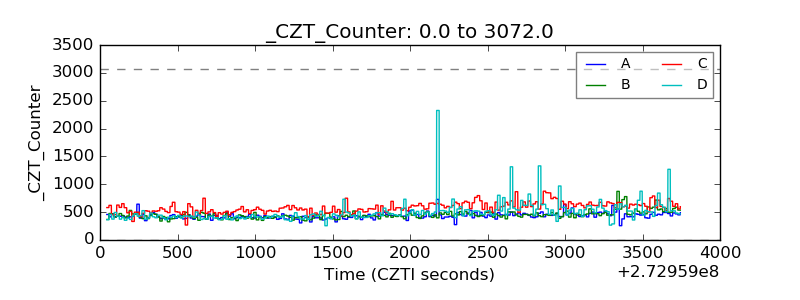 |
| +2.5 Volts monitor |  |
| +5 Volts monitor |  |
| _ROLL_ROT | 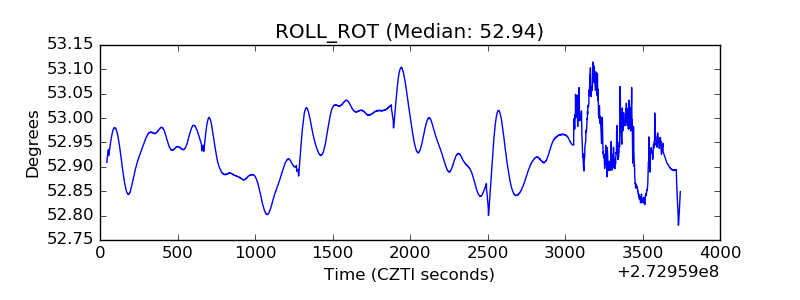 |
| _Roll_DEC | 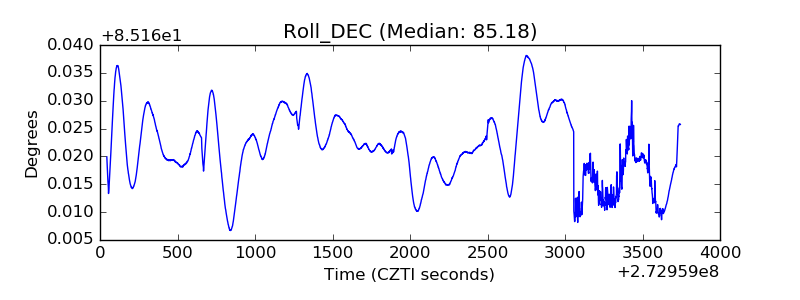 |
| _Roll_RA | 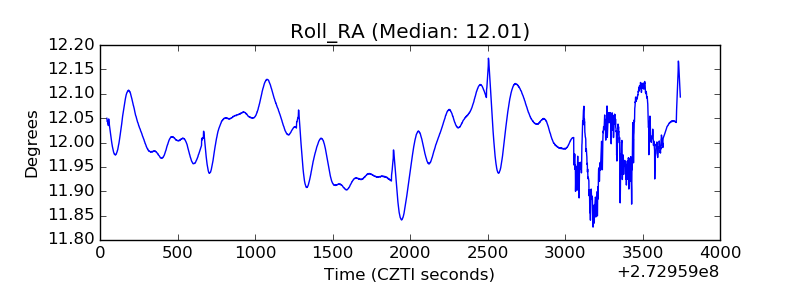 |
| Veto Counter | 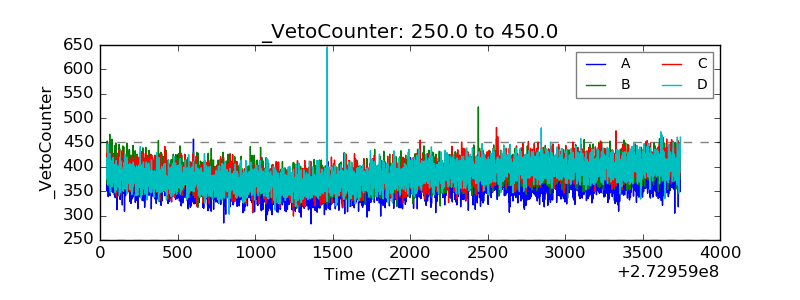 |