| Param | Original file | Final file |
|---|---|---|
| Filename | modeM0/AS1T02_095T01_9000002330cztM0_level2.fits | modeM0/AS1T02_095T01_9000002330cztM0_level2_quad_clean.evt |
| Size (bytes) | 431,818,560 | 475,413,120 |
| Size | 411.8 MB | 453.4 MB |
| Events in quadrant A | 2,386,582 | 2,610,451 |
| Events in quadrant B | 2,543,870 | 2,972,718 |
| Events in quadrant C | 2,612,866 | 2,893,225 |
| Events in quadrant D | 2,243,014 | 2,636,295 |
| Mode SS | |||
|---|---|---|---|
| Quadrant | BADHDUFLAG | Total packets | Discarded packets |
| A | 0 | 972 | 0 |
| B | 0 | 972 | 0 |
| C | 0 | 972 | 0 |
| D | 0 | 972 | 0 |
| Mode M0 | |||
|---|---|---|---|
| Quadrant | BADHDUFLAG | Total packets | Discarded packets |
| A | 0 | 161295 | 0 |
| B | 0 | 112247 | 0 |
| C | 0 | 100781 | 0 |
| D | 0 | 119974 | 0 |
| Mode M9 | |||
|---|---|---|---|
| Quadrant | BADHDUFLAG | Total packets | Discarded packets |
| A | 0 | 55 | 0 |
| B | 0 | 55 | 0 |
| C | 0 | 55 | 0 |
| D | 0 | 55 | 0 |
| Quadrant | Total seconds | Saturated seconds | Saturation percentage |
|---|---|---|---|
| A | 47877 | 9039 | 18.879629% |
| B | 47877 | 1457 | 3.043215% |
| C | 47877 | 1118 | 2.335150% |
| D | 47877 | 2260 | 4.720429% |
Noise dominated data is calculated using 1-second bins in cleaned event files. If a bin has >2000 counts, and if more than 50% of those come from <1% of pixels, then it is considered to be noise-dominated and hence unusable.
| Quadrant | # 1 sec bins | Bins with >0 counts | Bins with >2000 counts | High rate bins dominated by noise | Noise dominated (total time) | Noise dominated (detector-on time) | Marked lightcurve |
|---|---|---|---|---|---|---|---|
| A | 53297 | 47759 | 0 | 0 | 0.00% | 0.00% |  |
| B | 53297 | 47876 | 0 | 0 | 0.00% | 0.00% |  |
| C | 53297 | 47875 | 0 | 0 | 0.00% | 0.00% |  |
| D | 53297 | 47815 | 0 | 0 | 0.00% | 0.00% |  |
Top three noisy pixels from each quadrant. If the there are fewer than three noisy pixels in the level2.evt file, extra rows are filled as -1
| Pixel properties | Quadrant properties | ||||||
|---|---|---|---|---|---|---|---|
| Quadrant | DetID | PixID | Counts | Sigma | Mean | Median | Sigma |
| A | 14 | 188 | 2441 | 11.98 | 619 | 578 | 155.5 |
| A | 0 | 29 | 2403 | 11.73 | 619 | 578 | 155.5 |
| A | 14 | 204 | 2124 | 9.94 | 619 | 578 | 155.5 |
| B | 2 | 9 | 2029 | 10.24 | 673 | 638 | 135.8 |
| B | 3 | 17 | 1724 | 8.0 | 673 | 638 | 135.8 |
| B | 2 | 8 | 1716 | 7.94 | 673 | 638 | 135.8 |
| C | 12 | 241 | 1896 | 6.98 | 689 | 637 | 180.4 |
| C | 12 | 250 | 1892 | 6.96 | 689 | 637 | 180.4 |
| C | 3 | 158 | 1807 | 6.48 | 689 | 637 | 180.4 |
| D | 3 | 14 | 1677 | 6.4 | 639 | 582 | 171.0 |
| D | 6 | 231 | 1623 | 6.09 | 639 | 582 | 171.0 |
| D | 3 | 31 | 1604 | 5.98 | 639 | 582 | 171.0 |
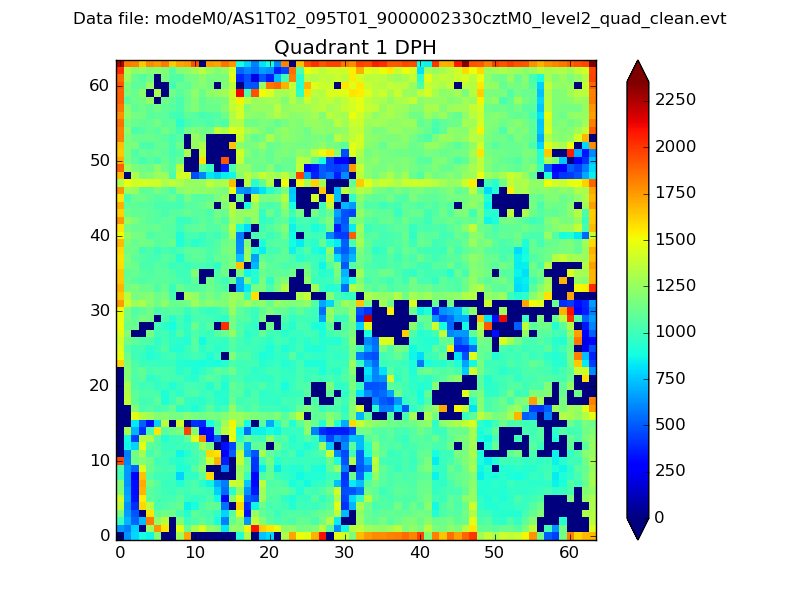
Histogram calculated using DETX and DETY for each event in the final _common_clean file
| Quadrant A |  |
 |
Quadrant B |
|---|---|---|---|
| Quadrant D | 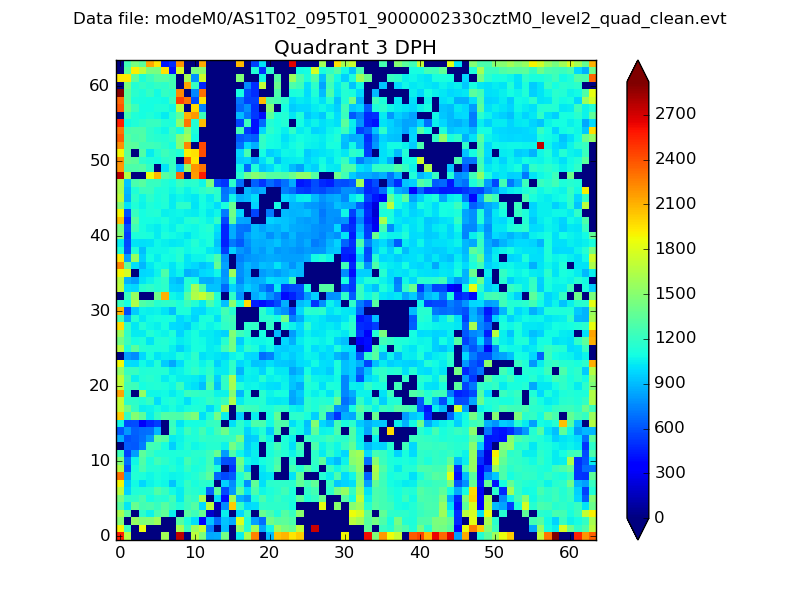 |
 |
Quadrant C |
| Plot type | Count rate plots | Images |
|---|---|---|
| Comparison with Poisson distribution Blue bars denote a histogram of data divided into 1 sec bins. Red curve is a Poisson curve with rate = median count rate of data. |
 |
 |
| Quadrant-wise count rates Data is divided into 100 sec bins |
 |
|
| Module-wise count rates for Quadrant A Data is divided into 100 sec bins |
 |
 |
| Module-wise count rates for Quadrant B Data is divided into 100 sec bins |
 |
 |
| Module-wise count rates for Quadrant C Data is divided into 100 sec bins |
 |
 |
| Module-wise count rates for Quadrant D Data is divided into 100 sec bins |
 |
 |
| Parameter | Plot |
|---|---|
| CZT HV Monitor |  |
| D_VDD |  |
| Temperature 1 |  |
| Veto HV Monitor |  |
| Veto LLD |  |
| Alpha Counter |  |
| _CPM_Rate |  |
| CZT Counter |  |
| +2.5 Volts monitor |  |
| +5 Volts monitor |  |
| _ROLL_ROT |  |
| _Roll_DEC |  |
| _Roll_RA |  |
| Veto Counter |  |