| Param | Original file | Final file |
|---|---|---|
| Filename | modeM0/AS1T02_095T01_9000002330_15736cztM0_level2.evt | modeM0/AS1T02_095T01_9000002330_15736cztM0_level2_quad_clean.evt |
| Size (bytes) | 150,649,920 | 30,291,840 |
| Size | 143.7 MB | 28.9 MB |
| Events in quadrant A | 915,376 | 197,363 |
| Events in quadrant B | 994,782 | 202,611 |
| Events in quadrant C | 1,022,052 | 197,516 |
| Events in quadrant D | 1,500,424 | 182,625 |
| Mode SS | |||
|---|---|---|---|
| Quadrant | BADHDUFLAG | Total packets | Discarded packets |
| A | 0 | 40 | 0 |
| B | 0 | 40 | 0 |
| C | 0 | 40 | 0 |
| D | 0 | 40 | 0 |
| Mode M0 | |||
|---|---|---|---|
| Quadrant | BADHDUFLAG | Total packets | Discarded packets |
| A | 0 | 3991 | 2 |
| B | 0 | 4156 | 3 |
| C | 0 | 4236 | 1 |
| D | 0 | 5768 | 1 |
| Mode M9 | |||
|---|---|---|---|
| Quadrant | BADHDUFLAG | Total packets | Discarded packets |
| A | 0 | 7 | 0 |
| B | 0 | 7 | 0 |
| C | 0 | 7 | 0 |
| D | 0 | 7 | 0 |
| Quadrant | Total seconds | Saturated seconds | Saturation percentage |
|---|---|---|---|
| A | 1869 | 82 | 4.387373% |
| B | 1868 | 104 | 5.567452% |
| C | 1869 | 88 | 4.708400% |
| D | 1869 | 251 | 13.429642% |
Noise dominated data is calculated using 1-second bins in cleaned event files. If a bin has >2000 counts, and if more than 50% of those come from <1% of pixels, then it is considered to be noise-dominated and hence unusable.
| Quadrant | # 1 sec bins | Bins with >0 counts | Bins with >2000 counts | High rate bins dominated by noise | Noise dominated (total time) | Noise dominated (detector-on time) | Marked lightcurve |
|---|---|---|---|---|---|---|---|
| A | 2565 | 1871 | 0 | 0 | 0.00% | 0.00% | 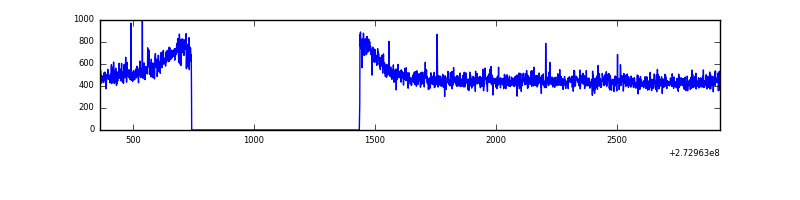 |
| B | 2565 | 1871 | 0 | 0 | 0.00% | 0.00% | 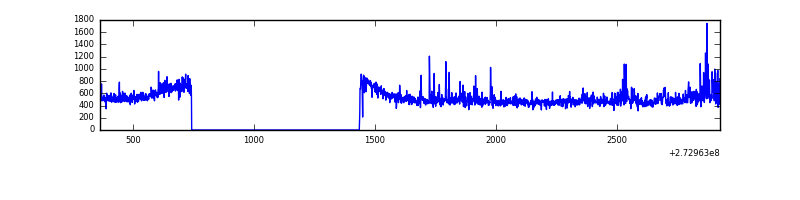 |
| C | 2565 | 1871 | 0 | 0 | 0.00% | 0.00% | 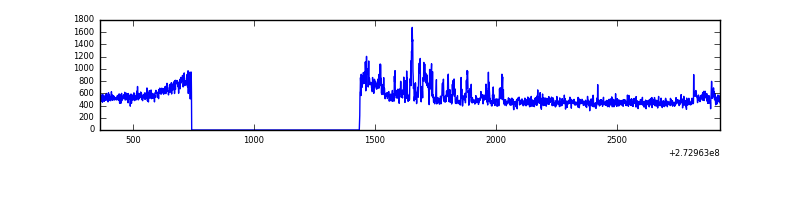 |
| D | 2565 | 1871 | 137 | 137 | 5.34% | 7.32% | 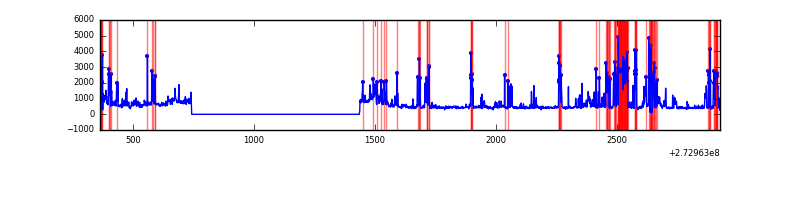 |
Top three noisy pixels from each quadrant. If the there are fewer than three noisy pixels in the level2.evt file, extra rows are filled as -1
| Pixel properties | Quadrant properties | ||||||
|---|---|---|---|---|---|---|---|
| Quadrant | DetID | PixID | Counts | Sigma | Mean | Median | Sigma |
| A | 9 | 143 | 7567 | 146.94 | 235 | 229 | 49.9 |
| A | 13 | 210 | 2484 | 45.16 | 235 | 229 | 49.9 |
| A | 0 | 226 | 2107 | 37.61 | 235 | 229 | 49.9 |
| B | 4 | 251 | 43556 | 898.87 | 234 | 228 | 48.2 |
| B | 0 | 85 | 25970 | 534.04 | 234 | 228 | 48.2 |
| B | 12 | 111 | 5660 | 112.69 | 234 | 228 | 48.2 |
| C | 15 | 127 | 79944 | 1480.62 | 223 | 223 | 53.8 |
| C | 14 | 238 | 34027 | 627.82 | 223 | 223 | 53.8 |
| C | 3 | 233 | 31111 | 573.67 | 223 | 223 | 53.8 |
| D | 1 | 52 | 655136 | 12120.19 | 216 | 208 | 54.0 |
| D | 12 | 6 | 9918 | 179.69 | 216 | 208 | 54.0 |
| D | 12 | 110 | 7571 | 136.26 | 216 | 208 | 54.0 |
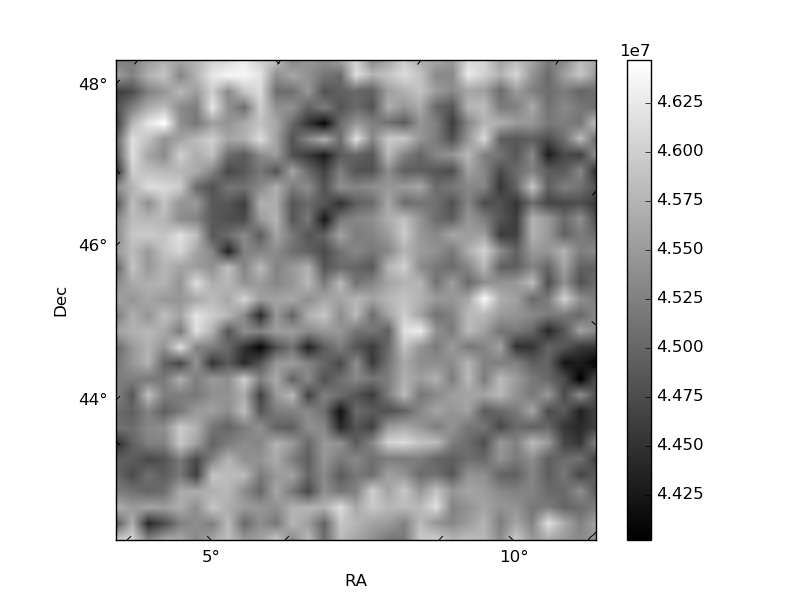
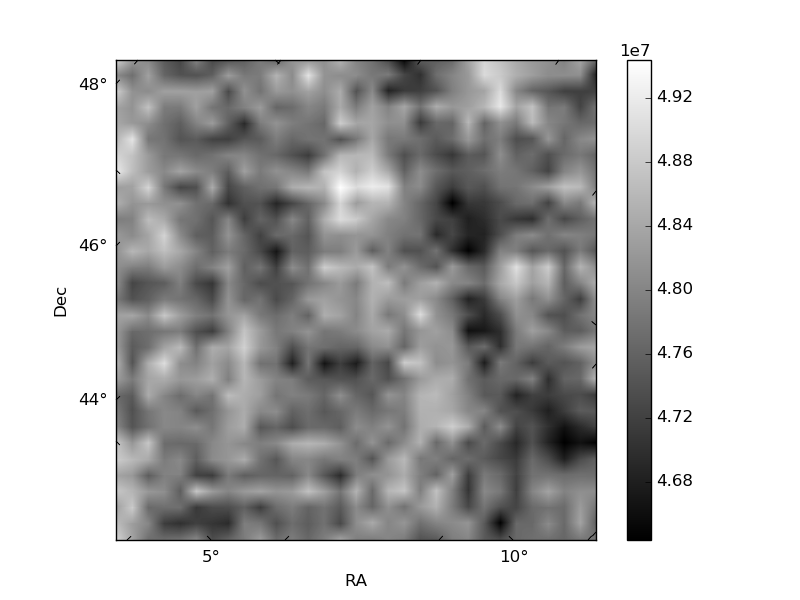
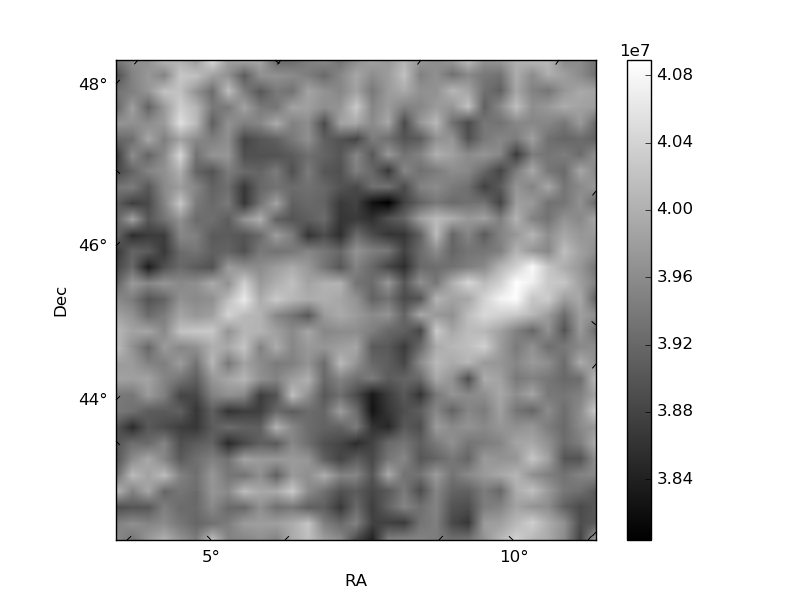
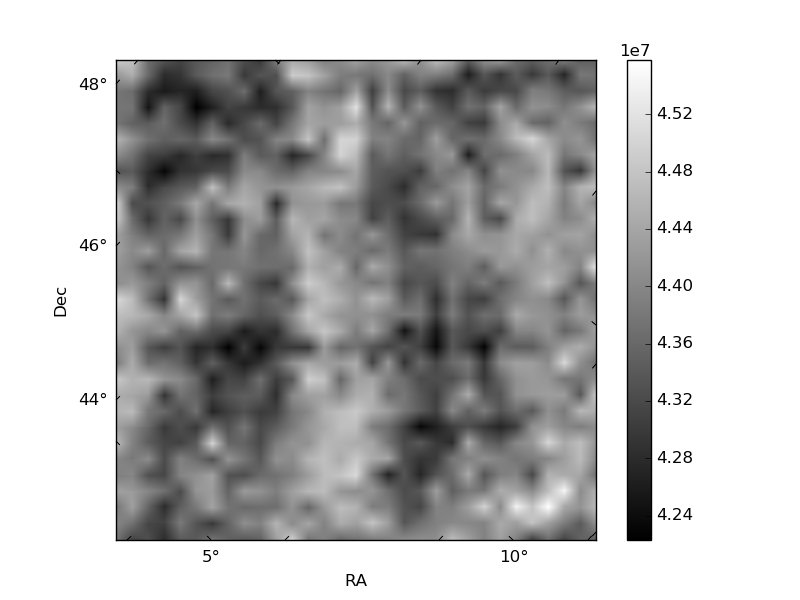
Histogram calculated using DETX and DETY for each event in the final _common_clean file
| Quadrant A | 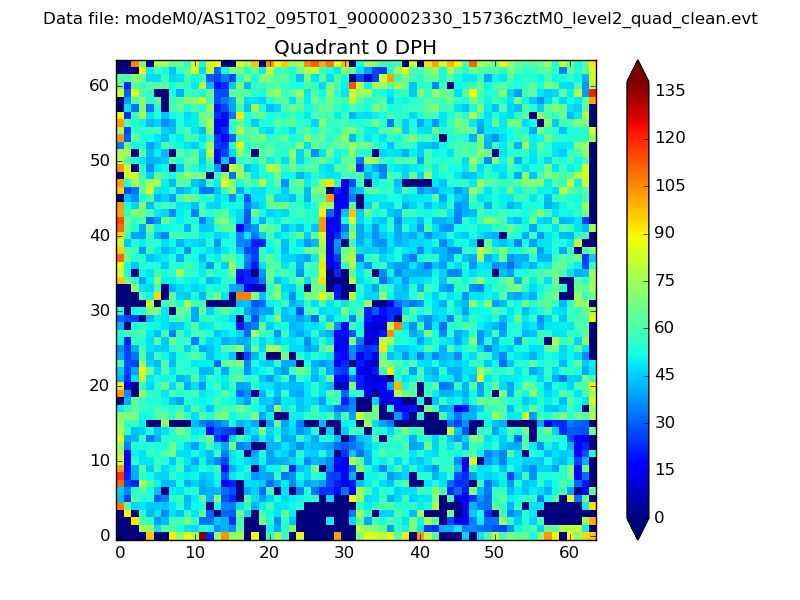 |
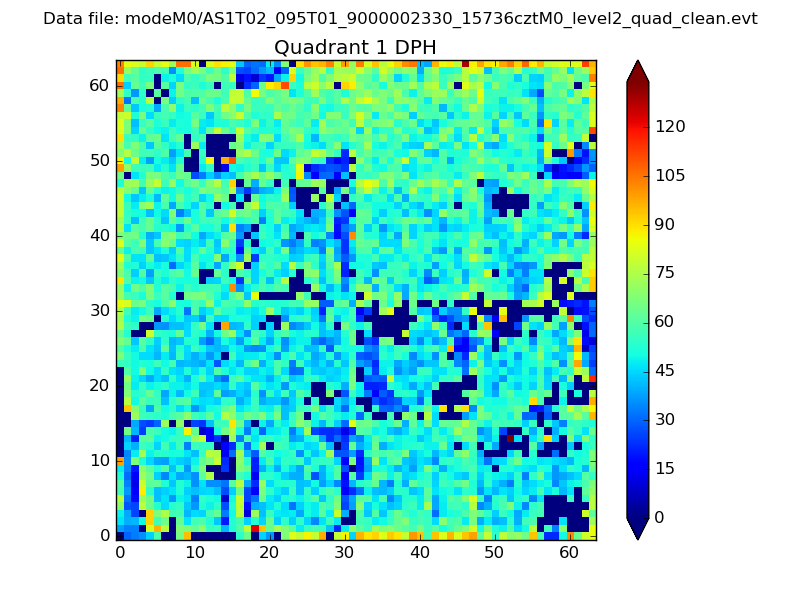 |
Quadrant B |
|---|---|---|---|
| Quadrant D | 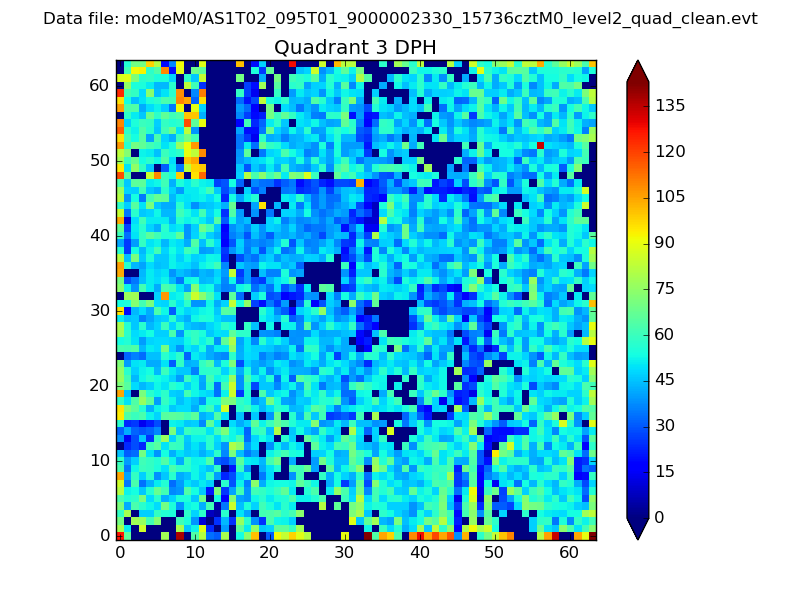 |
 |
Quadrant C |
| Plot type | Count rate plots | Images |
|---|---|---|
| Comparison with Poisson distribution Blue bars denote a histogram of data divided into 1 sec bins. Red curve is a Poisson curve with rate = median count rate of data. |
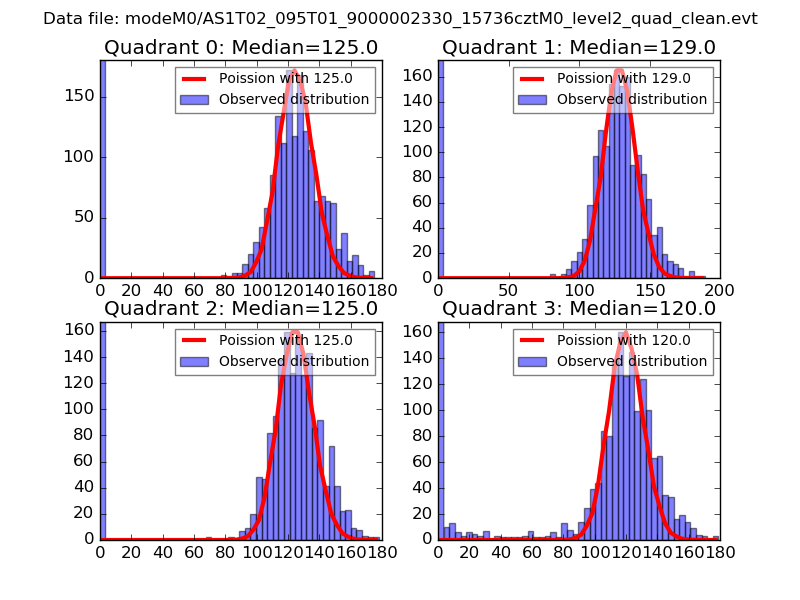 |
 |
| Quadrant-wise count rates Data is divided into 100 sec bins |
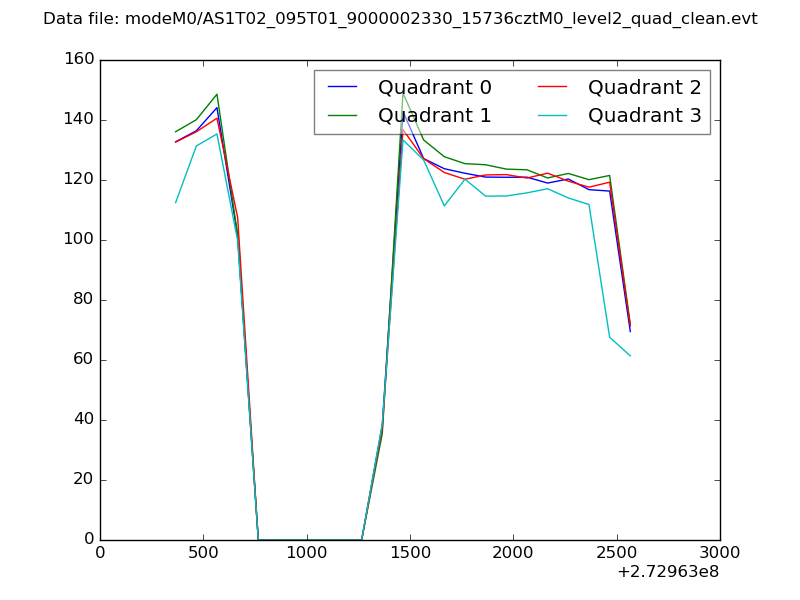 |
|
| Module-wise count rates for Quadrant A Data is divided into 100 sec bins |
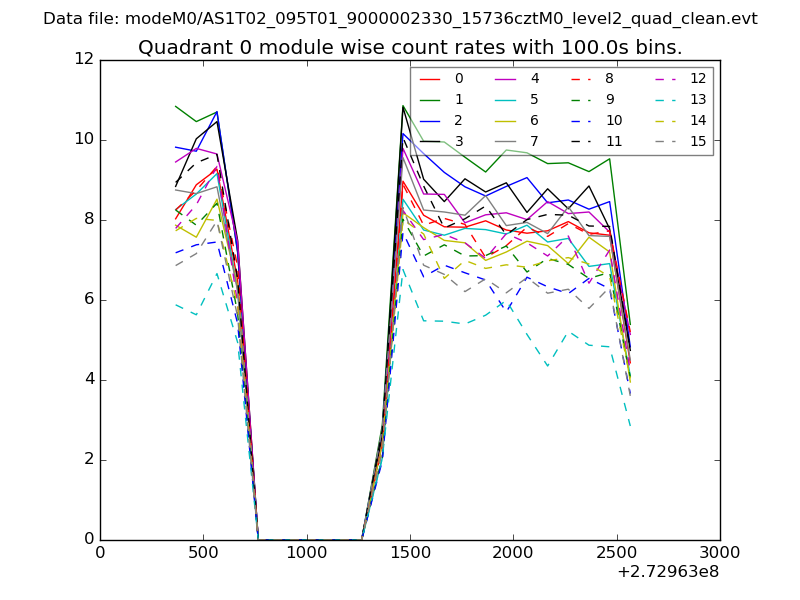 |
 |
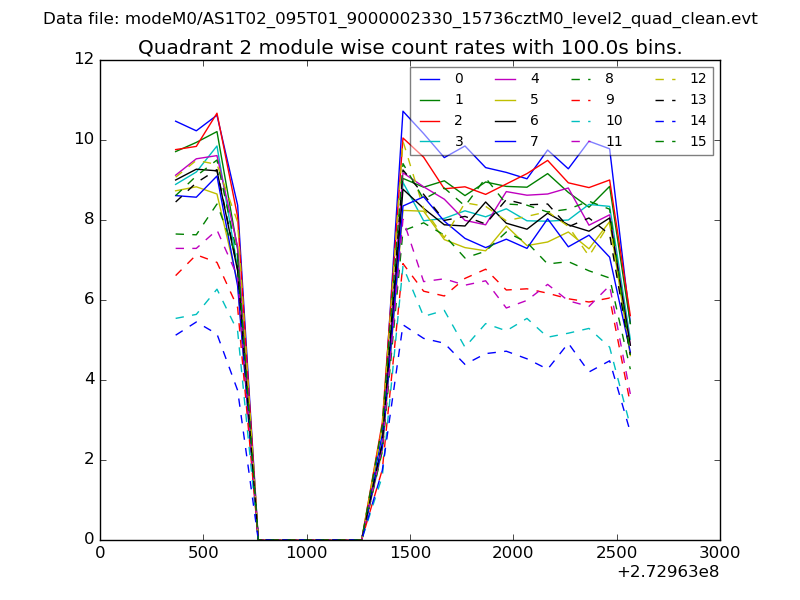
| Module-wise count rates for Quadrant B Data is divided into 100 sec bins |
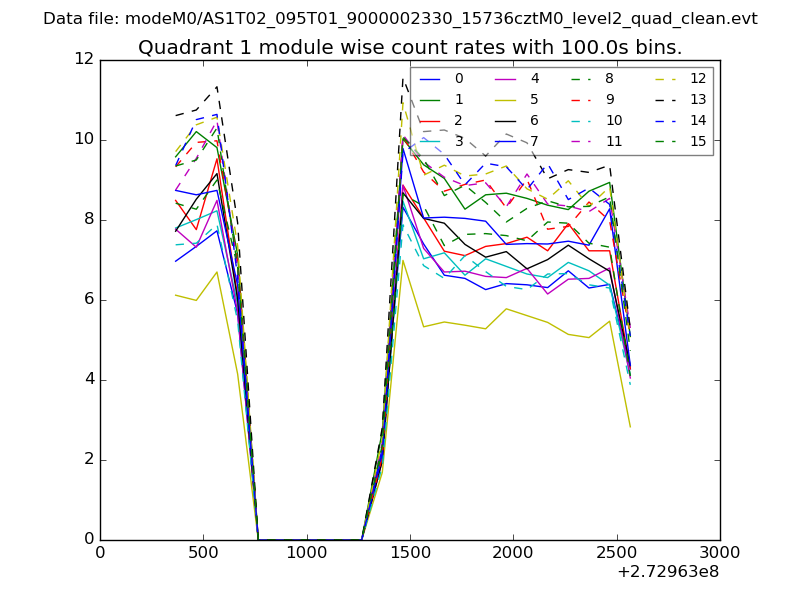 |
 |
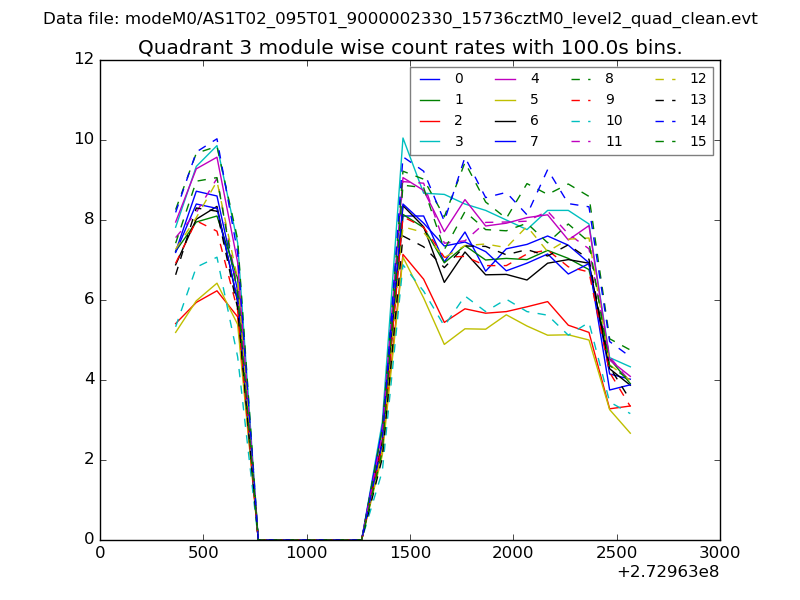
| Module-wise count rates for Quadrant C Data is divided into 100 sec bins |
 |
 |
| Module-wise count rates for Quadrant D Data is divided into 100 sec bins |
 |
 |
| Parameter | Plot |
|---|---|
| CZT HV Monitor | 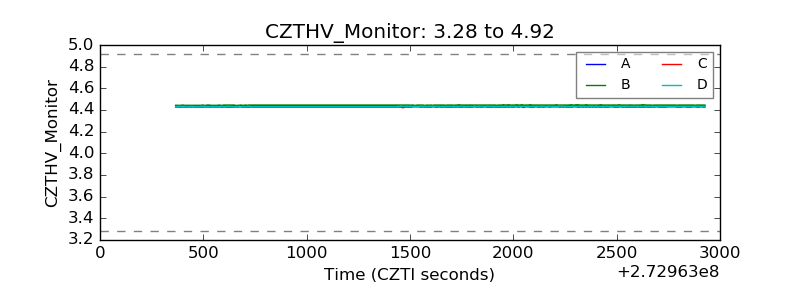 |
| D_VDD | 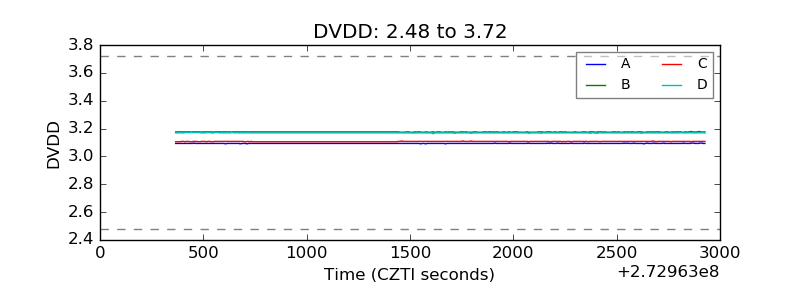 |
| Temperature 1 | 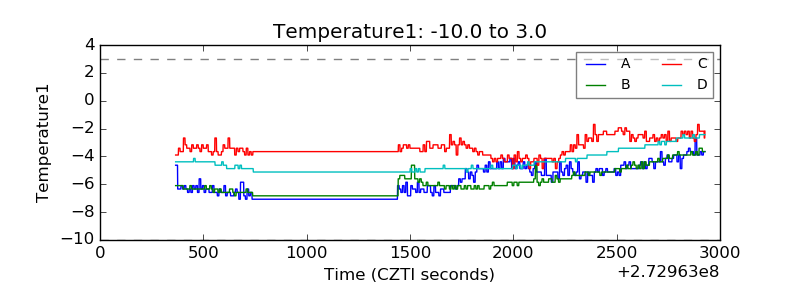 |
| Veto HV Monitor | 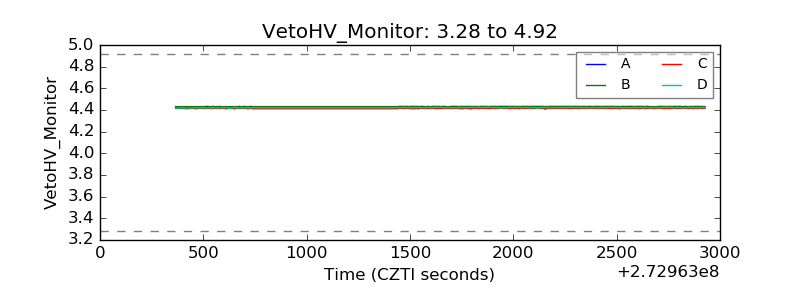 |
| Veto LLD | 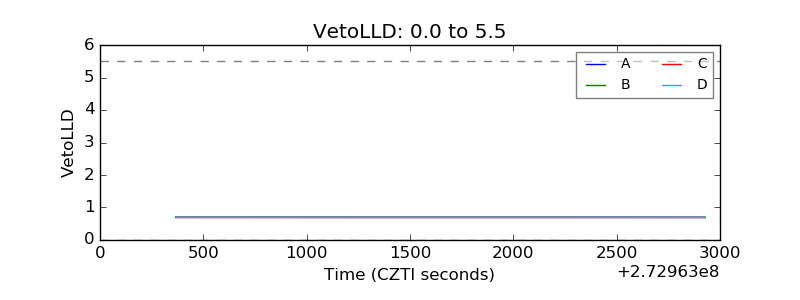 |
| Alpha Counter | 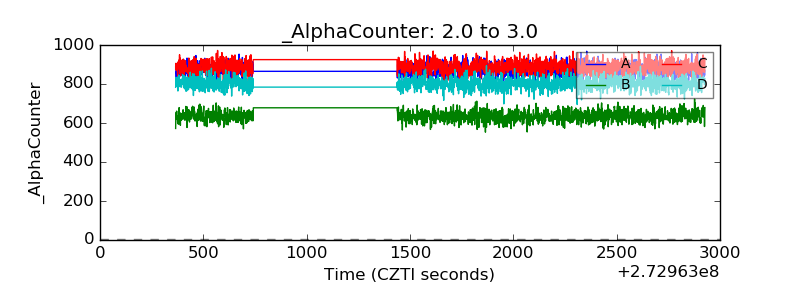 |
| _CPM_Rate | 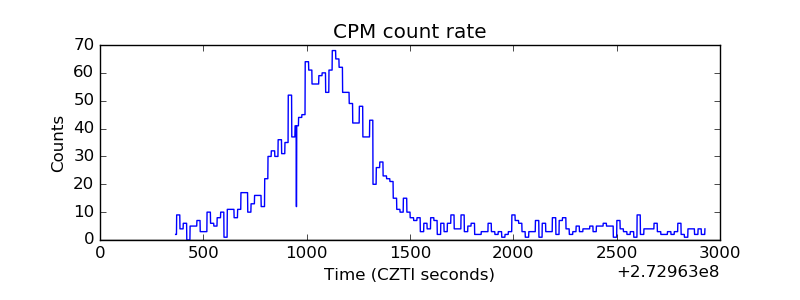 |
| CZT Counter |  |
| +2.5 Volts monitor |  |
| +5 Volts monitor | 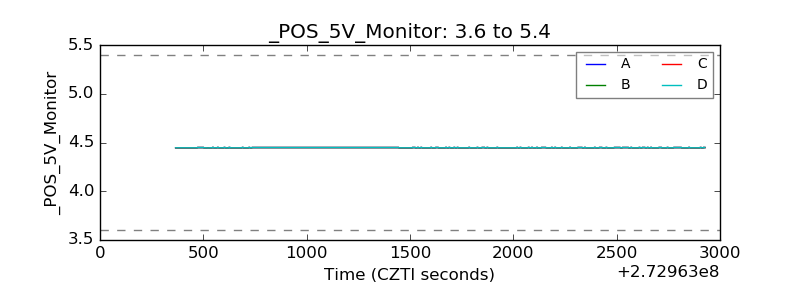 |
| _ROLL_ROT | 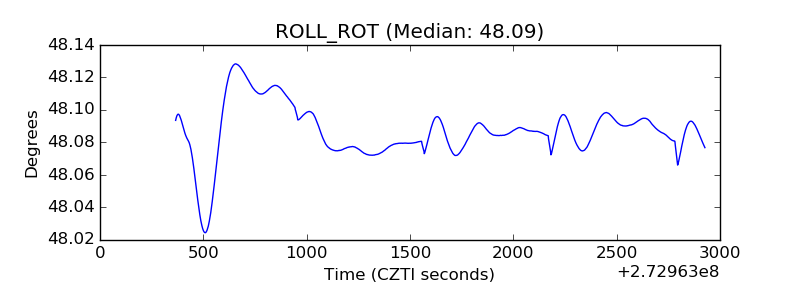 |
| _Roll_DEC | 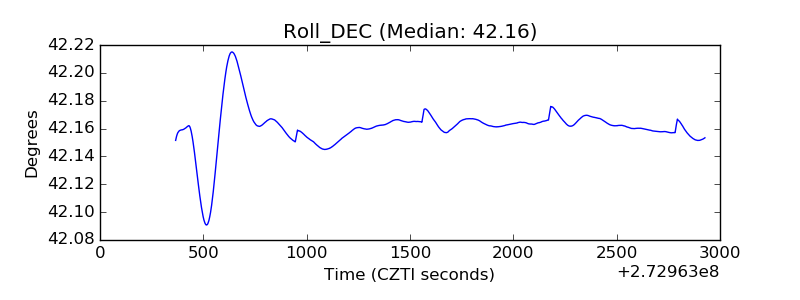 |
| _Roll_RA | 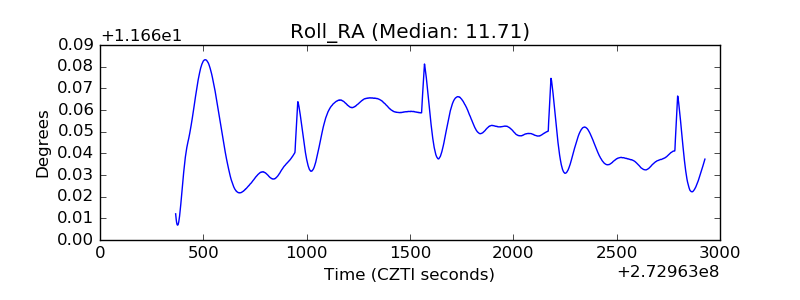 |
| Veto Counter | 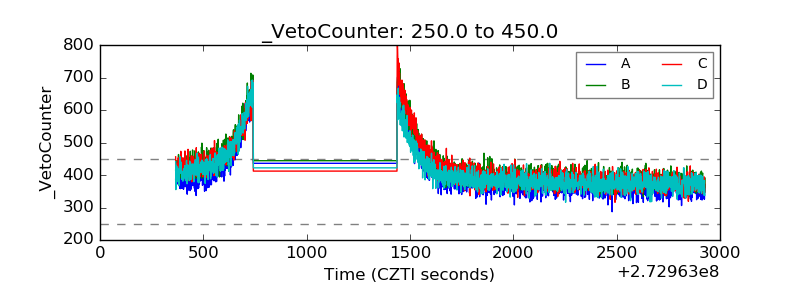 |