| Param | Original file | Final file |
|---|---|---|
| Filename | modeM0/AS1T02_095T01_9000002330_15738cztM0_level2.evt | modeM0/AS1T02_095T01_9000002330_15738cztM0_level2_quad_clean.evt |
| Size (bytes) | 709,004,160 | 89,513,280 |
| Size | 676.2 MB | 85.4 MB |
| Events in quadrant A | 7,095,131 | 516,822 |
| Events in quadrant B | 3,930,337 | 572,730 |
| Events in quadrant C | 3,760,278 | 556,722 |
| Events in quadrant D | 6,153,949 | 517,464 |
| Mode SS | |||
|---|---|---|---|
| Quadrant | BADHDUFLAG | Total packets | Discarded packets |
| A | 0 | 158 | 0 |
| B | 0 | 158 | 0 |
| C | 0 | 158 | 0 |
| D | 0 | 158 | 0 |
| Mode M0 | |||
|---|---|---|---|
| Quadrant | BADHDUFLAG | Total packets | Discarded packets |
| A | 0 | 26469 | 4 |
| B | 0 | 16665 | 3 |
| C | 0 | 16320 | 3 |
| D | 0 | 23625 | 3 |
| Quadrant | Total seconds | Saturated seconds | Saturation percentage |
|---|---|---|---|
| A | 7853 | 1596 | 20.323443% |
| B | 7853 | 306 | 3.896600% |
| C | 7853 | 290 | 3.692856% |
| D | 7853 | 846 | 10.772953% |
Noise dominated data is calculated using 1-second bins in cleaned event files. If a bin has >2000 counts, and if more than 50% of those come from <1% of pixels, then it is considered to be noise-dominated and hence unusable.
| Quadrant | # 1 sec bins | Bins with >0 counts | Bins with >2000 counts | High rate bins dominated by noise | Noise dominated (total time) | Noise dominated (detector-on time) | Marked lightcurve |
|---|---|---|---|---|---|---|---|
| A | 7889 | 7856 | 1245 | 1245 | 15.78% | 15.85% | 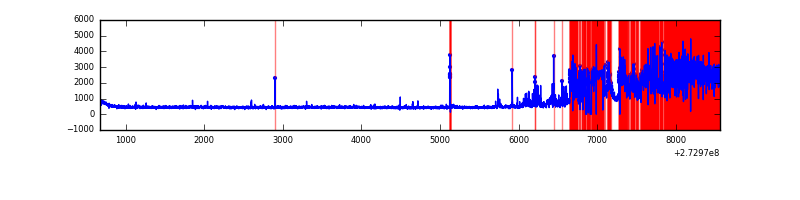 |
| B | 7889 | 7856 | 7 | 7 | 0.09% | 0.09% | 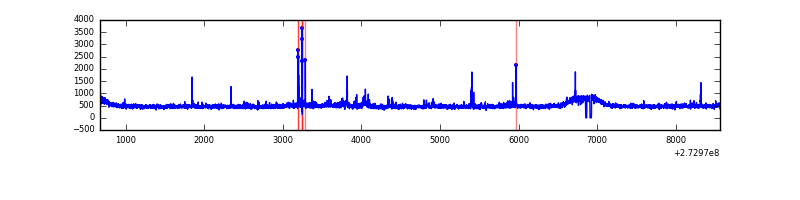 |
| C | 7889 | 7856 | 0 | 0 | 0.00% | 0.00% | 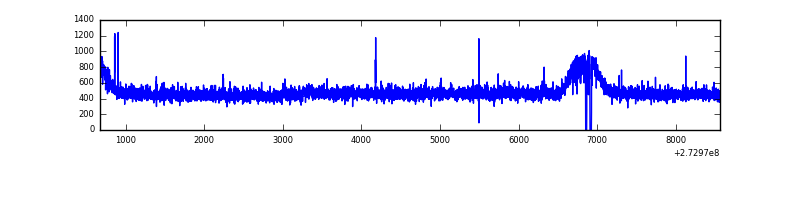 |
| D | 7889 | 7855 | 591 | 591 | 7.49% | 7.52% | 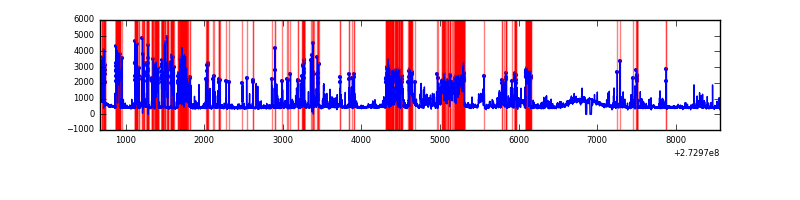 |
Top three noisy pixels from each quadrant. If the there are fewer than three noisy pixels in the level2.evt file, extra rows are filled as -1
| Pixel properties | Quadrant properties | ||||||
|---|---|---|---|---|---|---|---|
| Quadrant | DetID | PixID | Counts | Sigma | Mean | Median | Sigma |
| A | 15 | 239 | 3870532 | 22921.54 | 831 | 813 | 168.8 |
| A | 9 | 143 | 16223 | 91.28 | 831 | 813 | 168.8 |
| A | 0 | 226 | 7324 | 38.57 | 831 | 813 | 168.8 |
| B | 4 | 251 | 77017 | 405.99 | 954 | 928 | 187.4 |
| B | 0 | 182 | 28286 | 145.97 | 954 | 928 | 187.4 |
| B | 4 | 173 | 24833 | 127.55 | 954 | 928 | 187.4 |
| C | 14 | 238 | 141612 | 650.49 | 916 | 920 | 216.3 |
| C | 3 | 233 | 26645 | 118.94 | 916 | 920 | 216.3 |
| C | 10 | 22 | 9572 | 40.0 | 916 | 920 | 216.3 |
| D | 1 | 52 | 2651412 | 12047.43 | 902 | 874 | 220.0 |
| D | 12 | 110 | 68552 | 307.62 | 902 | 874 | 220.0 |
| D | 2 | 234 | 31879 | 140.93 | 902 | 874 | 220.0 |
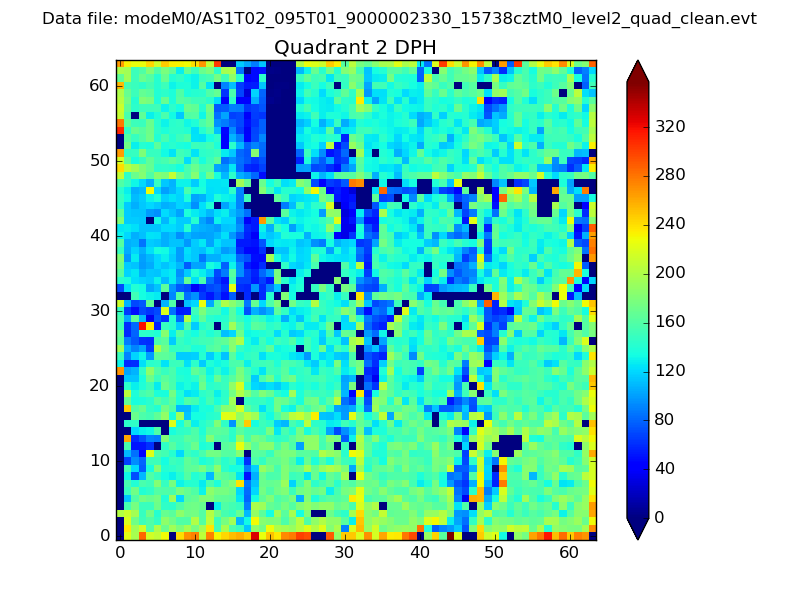
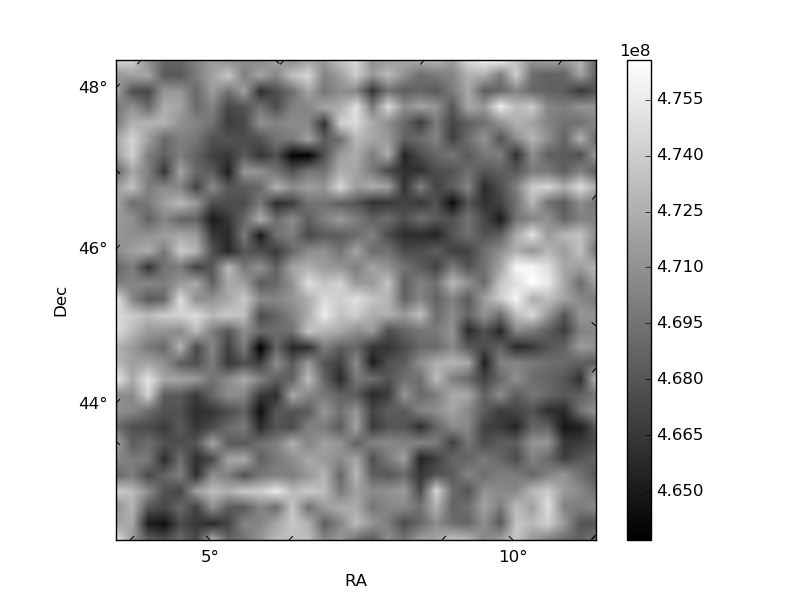
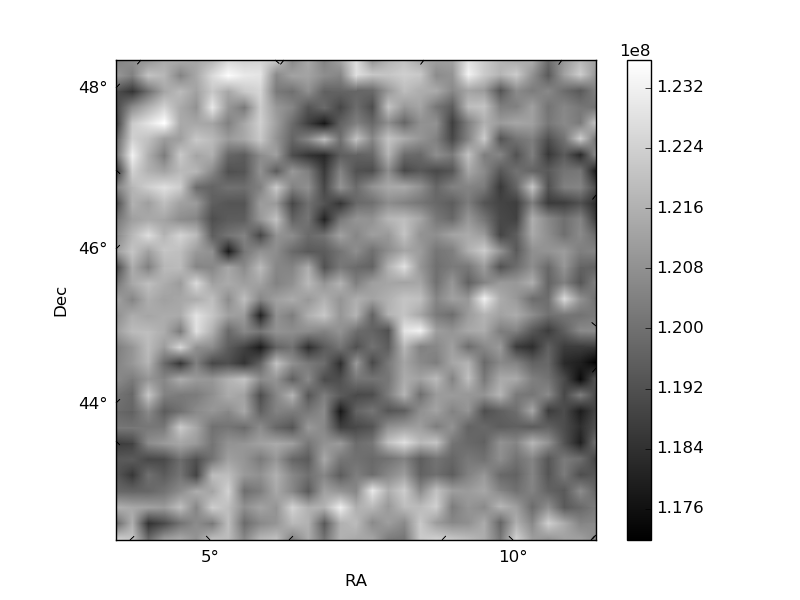
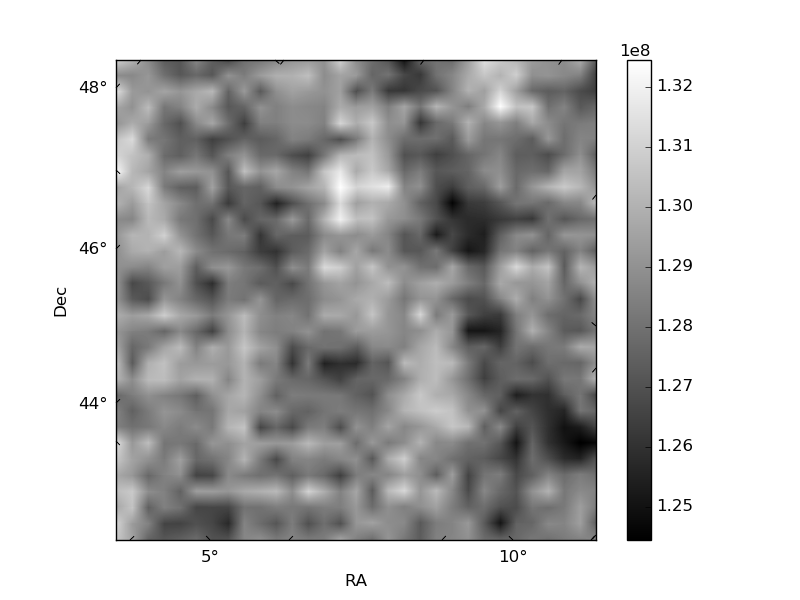
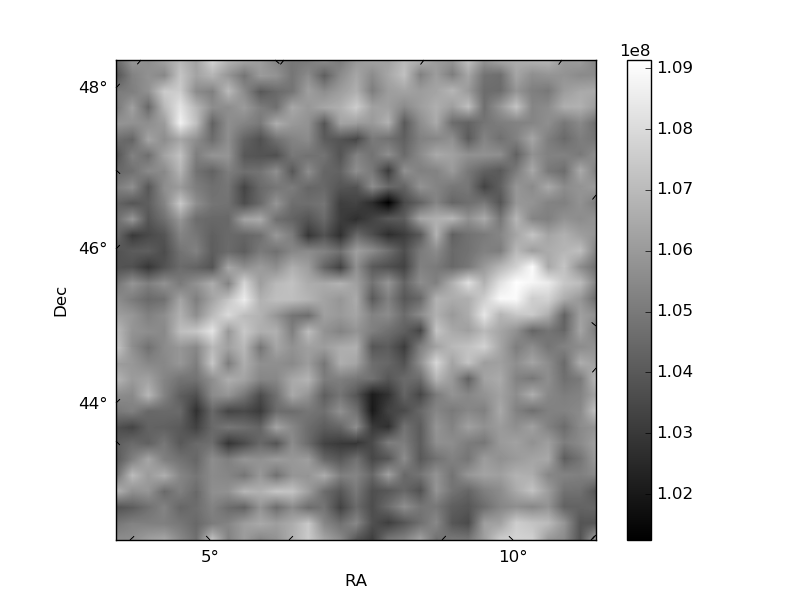
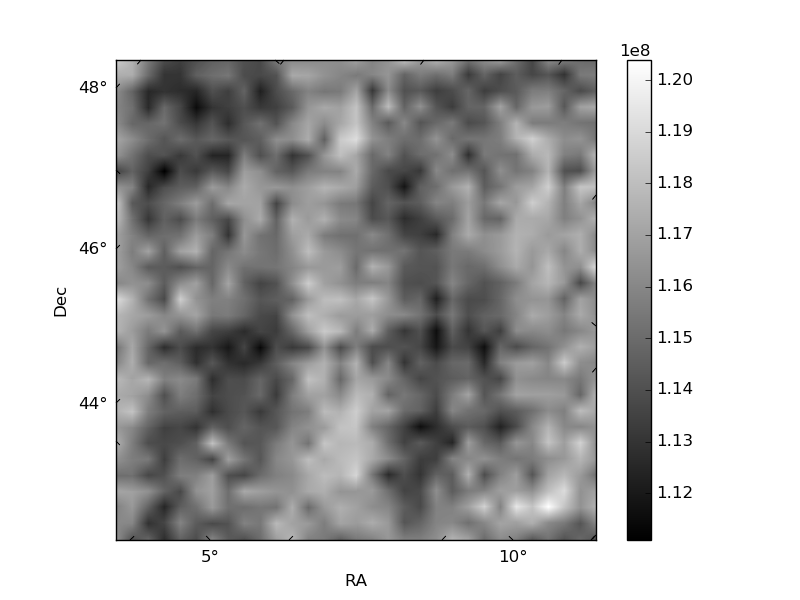
Histogram calculated using DETX and DETY for each event in the final _common_clean file
| Quadrant A | 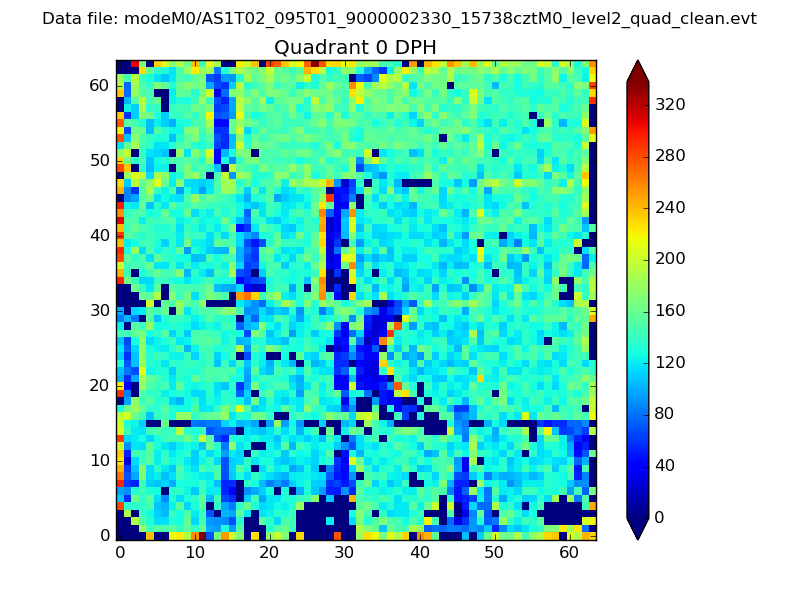 |
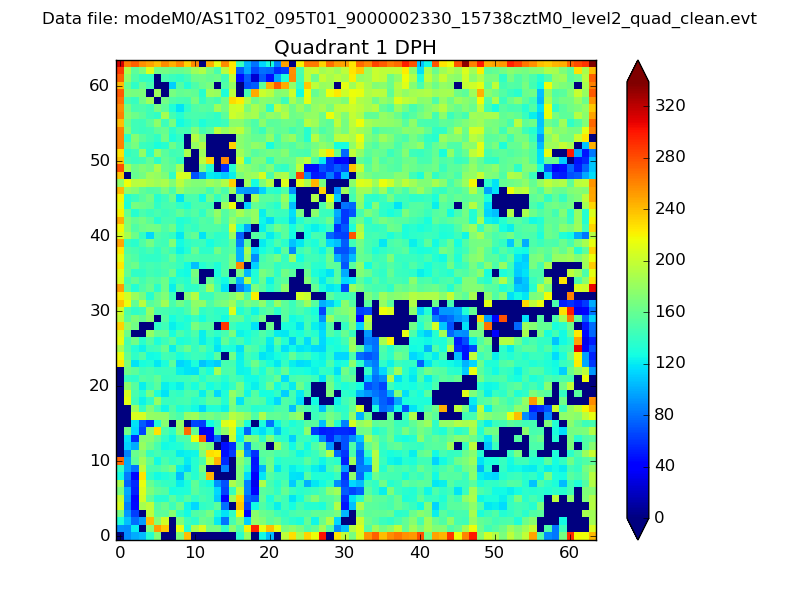 |
Quadrant B |
|---|---|---|---|
| Quadrant D | 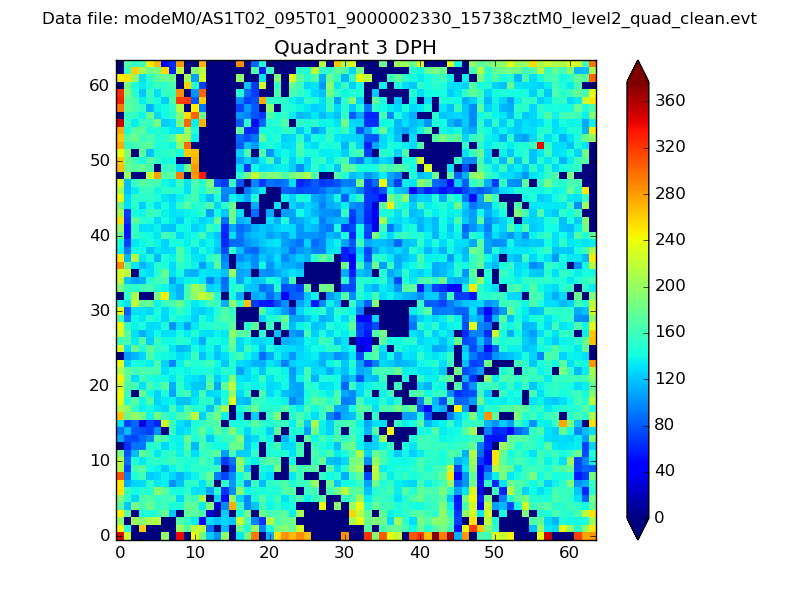 |
 |
Quadrant C |
| Plot type | Count rate plots | Images |
|---|---|---|
| Comparison with Poisson distribution Blue bars denote a histogram of data divided into 1 sec bins. Red curve is a Poisson curve with rate = median count rate of data. |
 |
 |
| Quadrant-wise count rates Data is divided into 100 sec bins |
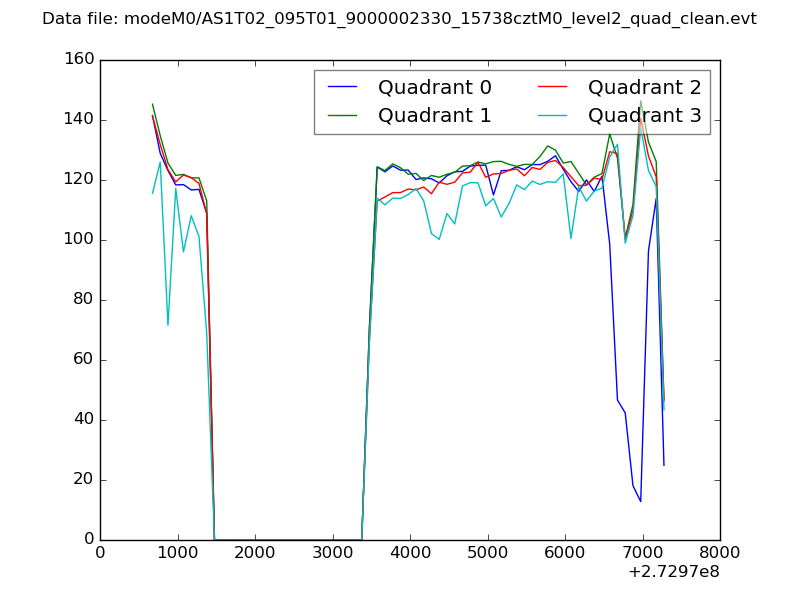 |
|
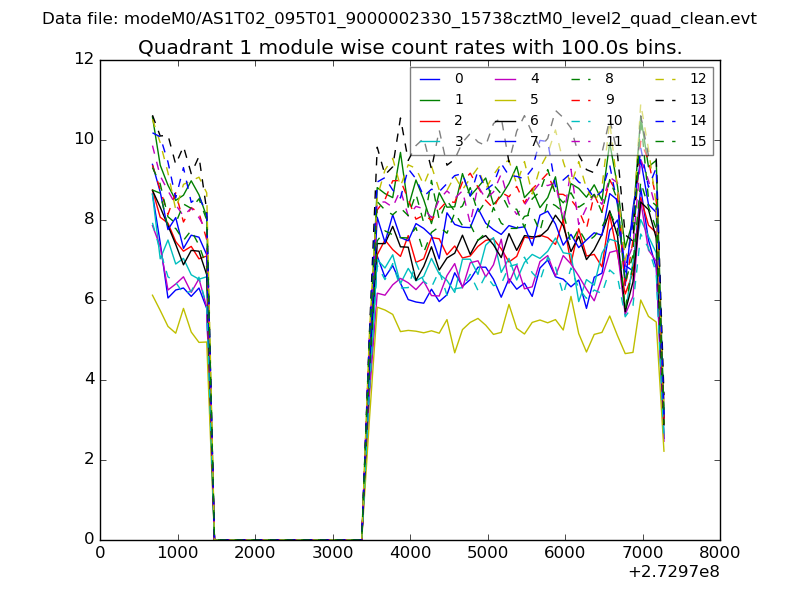
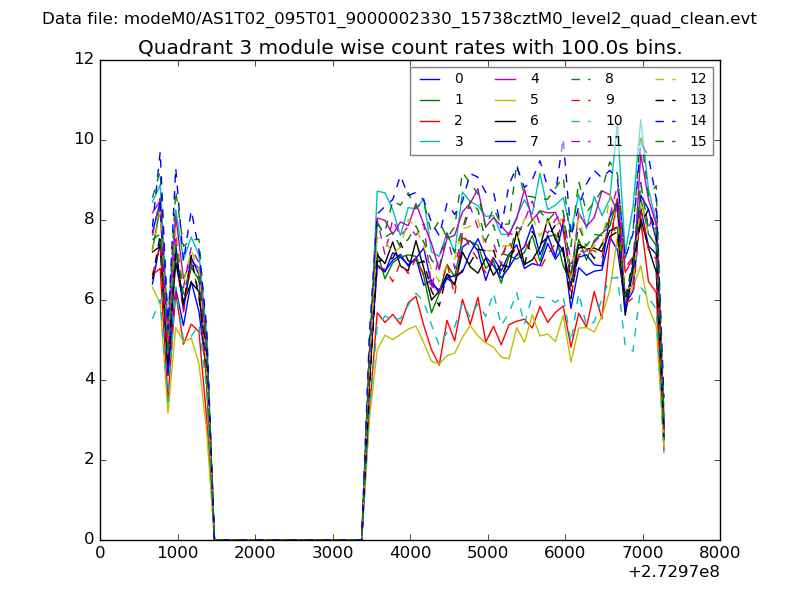
| Module-wise count rates for Quadrant A Data is divided into 100 sec bins |
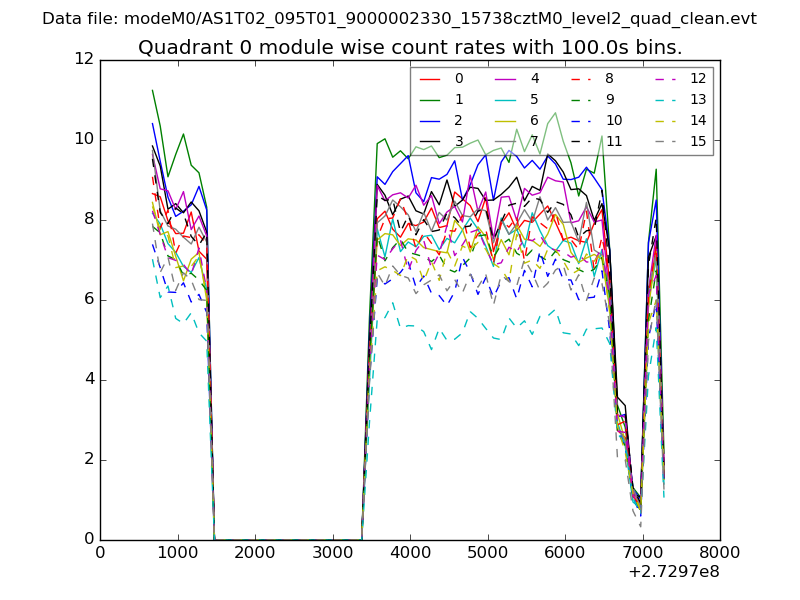 |
 |
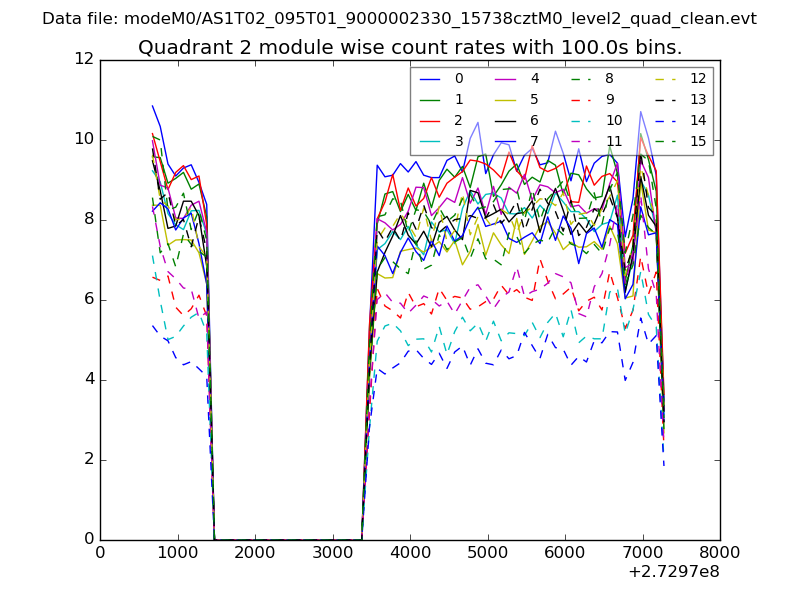
| Module-wise count rates for Quadrant B Data is divided into 100 sec bins |
 |
 |
| Module-wise count rates for Quadrant C Data is divided into 100 sec bins |
 |
 |
| Module-wise count rates for Quadrant D Data is divided into 100 sec bins |
 |
 |
| Parameter | Plot |
|---|---|
| CZT HV Monitor | 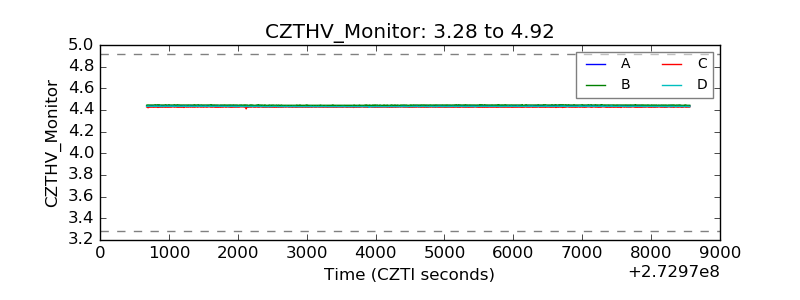 |
| D_VDD | 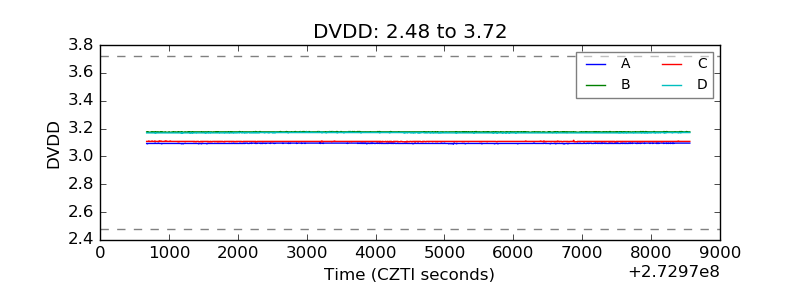 |
| Temperature 1 | 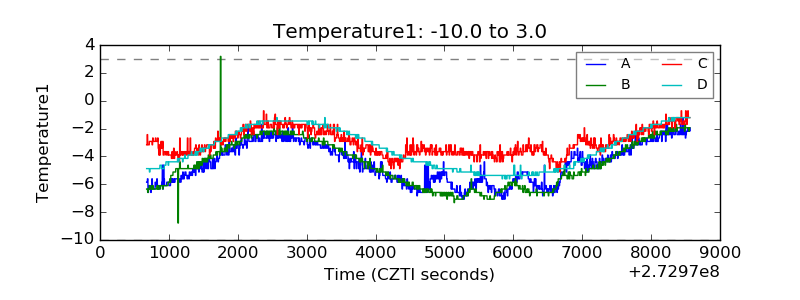 |
| Veto HV Monitor | 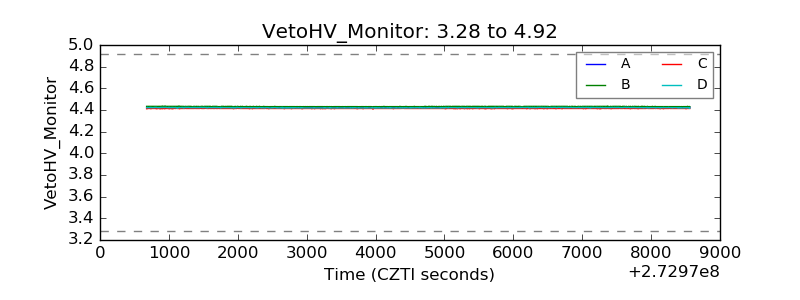 |
| Veto LLD | 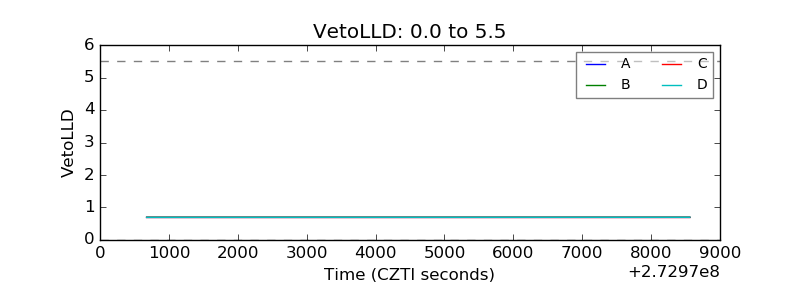 |
| Alpha Counter |  |
| _CPM_Rate | 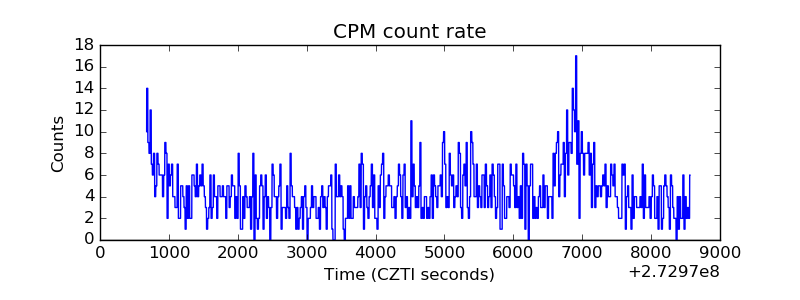 |
| CZT Counter | 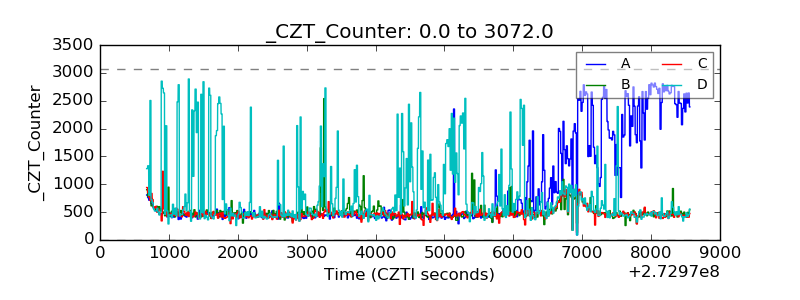 |
| +2.5 Volts monitor |  |
| +5 Volts monitor |  |
| _ROLL_ROT | 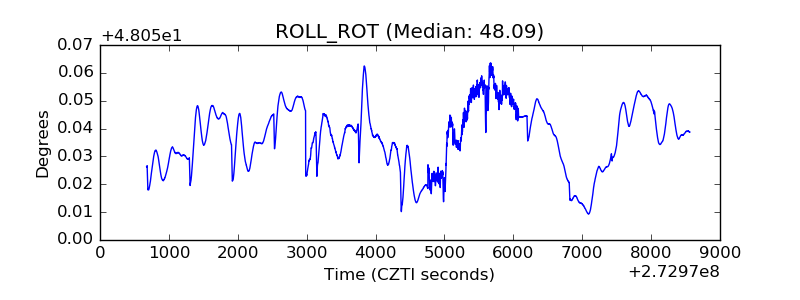 |
| _Roll_DEC | 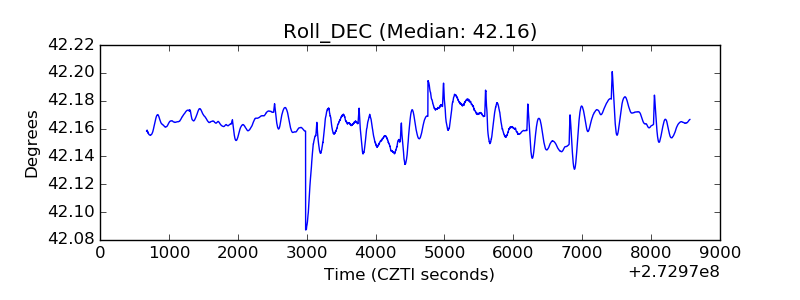 |
| _Roll_RA | 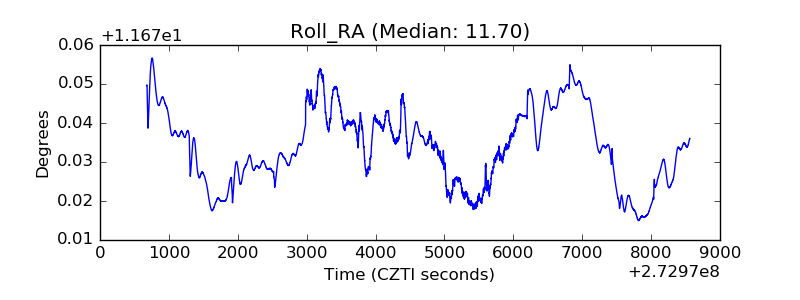 |
| Veto Counter | 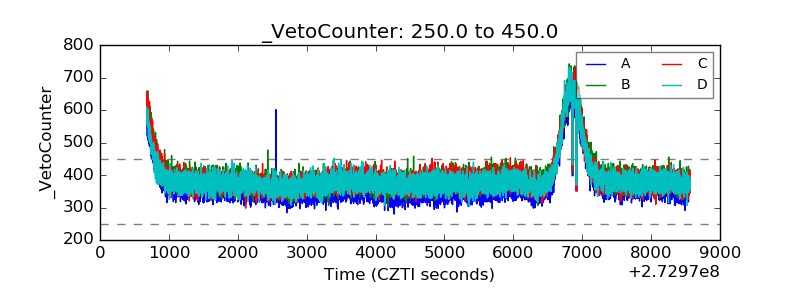 |