| Param | Original file | Final file |
|---|---|---|
| Filename | modeM0/AS1T02_095T01_9000002330_15739cztM0_level2.evt | modeM0/AS1T02_095T01_9000002330_15739cztM0_level2_quad_clean.evt |
| Size (bytes) | 923,477,760 | 83,050,560 |
| Size | 880.7 MB | 79.2 MB |
| Events in quadrant A | 15,509,874 | 377,255 |
| Events in quadrant B | 3,908,265 | 537,556 |
| Events in quadrant C | 3,893,085 | 520,719 |
| Events in quadrant D | 4,120,400 | 527,540 |
| Mode SS | |||
|---|---|---|---|
| Quadrant | BADHDUFLAG | Total packets | Discarded packets |
| A | 0 | 160 | 0 |
| B | 0 | 160 | 0 |
| C | 0 | 160 | 0 |
| D | 0 | 160 | 0 |
| Mode M0 | |||
|---|---|---|---|
| Quadrant | BADHDUFLAG | Total packets | Discarded packets |
| A | 0 | 51680 | 4 |
| B | 0 | 16621 | 3 |
| C | 0 | 16754 | 3 |
| D | 0 | 17691 | 3 |
| Mode M9 | |||
|---|---|---|---|
| Quadrant | BADHDUFLAG | Total packets | Discarded packets |
| A | 0 | 3 | 0 |
| B | 0 | 3 | 0 |
| C | 0 | 3 | 0 |
| D | 0 | 3 | 0 |
| Quadrant | Total seconds | Saturated seconds | Saturation percentage |
|---|---|---|---|
| A | 7919 | 5224 | 65.967925% |
| B | 7919 | 339 | 4.280844% |
| C | 7919 | 369 | 4.659679% |
| D | 7919 | 349 | 4.407122% |
Noise dominated data is calculated using 1-second bins in cleaned event files. If a bin has >2000 counts, and if more than 50% of those come from <1% of pixels, then it is considered to be noise-dominated and hence unusable.
| Quadrant | # 1 sec bins | Bins with >0 counts | Bins with >2000 counts | High rate bins dominated by noise | Noise dominated (total time) | Noise dominated (detector-on time) | Marked lightcurve |
|---|---|---|---|---|---|---|---|
| A | 8220 | 7923 | 4306 | 4306 | 52.38% | 54.35% | 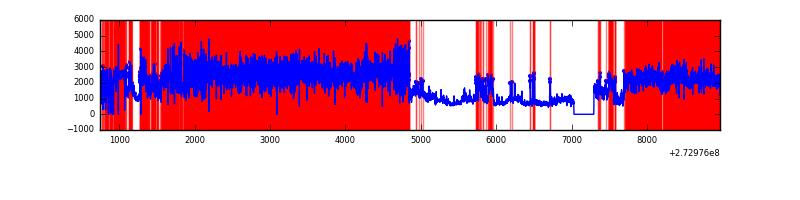 |
| B | 8220 | 7923 | 0 | 0 | 0.00% | 0.00% | 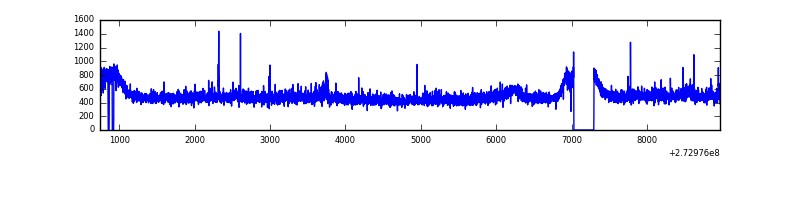 |
| C | 8220 | 7923 | 25 | 25 | 0.30% | 0.32% | 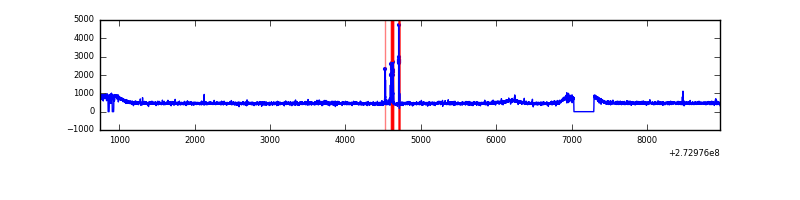 |
| D | 8220 | 7923 | 63 | 63 | 0.77% | 0.80% | 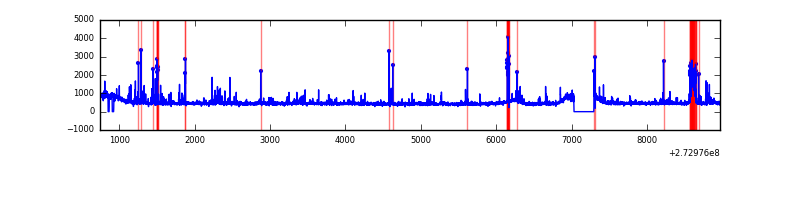 |
Top three noisy pixels from each quadrant. If the there are fewer than three noisy pixels in the level2.evt file, extra rows are filled as -1
| Pixel properties | Quadrant properties | ||||||
|---|---|---|---|---|---|---|---|
| Quadrant | DetID | PixID | Counts | Sigma | Mean | Median | Sigma |
| A | 15 | 239 | 12982754 | 97654.1 | 654 | 638 | 132.9 |
| A | 9 | 143 | 6647 | 45.2 | 654 | 638 | 132.9 |
| A | 13 | 248 | 6248 | 42.2 | 654 | 638 | 132.9 |
| B | 12 | 111 | 22486 | 113.98 | 974 | 950 | 188.9 |
| B | 11 | 111 | 19426 | 97.78 | 974 | 950 | 188.9 |
| B | 4 | 216 | 16285 | 81.16 | 974 | 950 | 188.9 |
| C | 14 | 238 | 140871 | 637.76 | 931 | 934 | 219.4 |
| C | 9 | 54 | 101665 | 459.08 | 931 | 934 | 219.4 |
| C | 3 | 233 | 10503 | 43.61 | 931 | 934 | 219.4 |
| D | 1 | 52 | 404468 | 1733.16 | 954 | 922 | 232.8 |
| D | 2 | 14 | 65428 | 277.04 | 954 | 922 | 232.8 |
| D | 2 | 234 | 34376 | 143.68 | 954 | 922 | 232.8 |
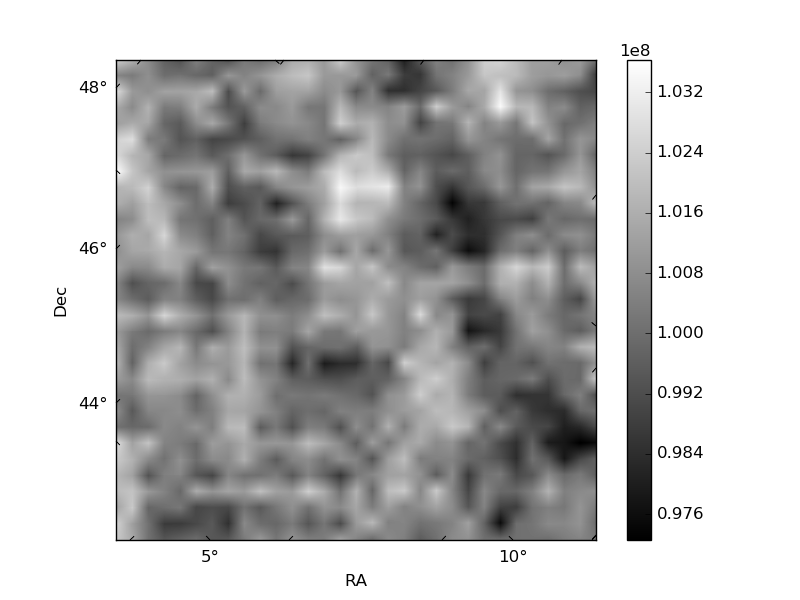
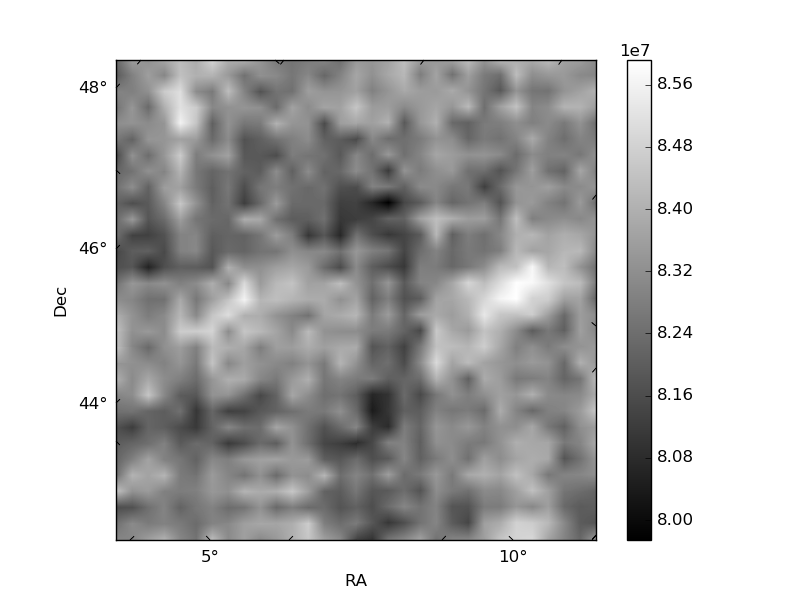
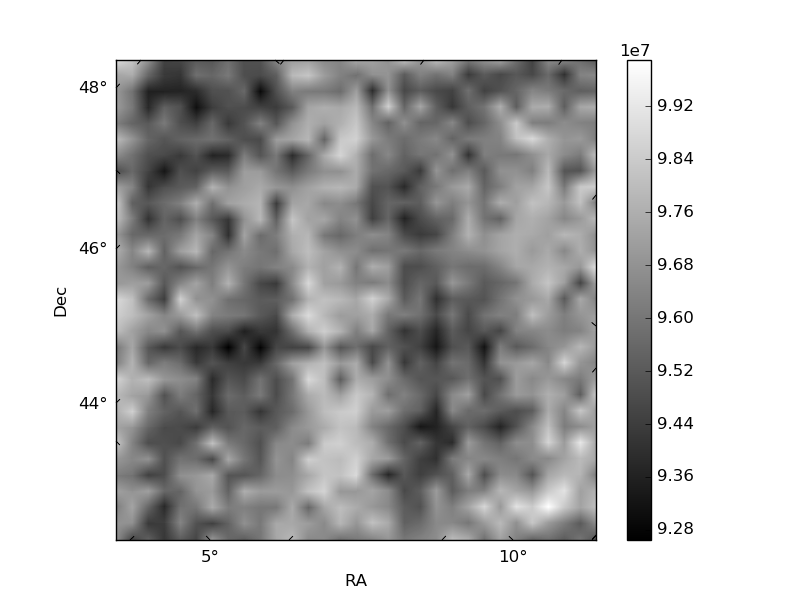
Histogram calculated using DETX and DETY for each event in the final _common_clean file
| Quadrant A | 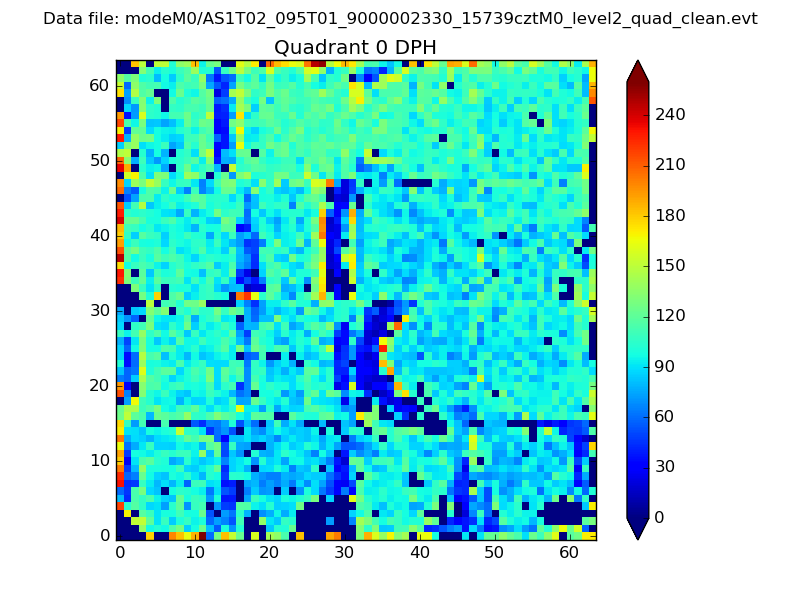 |
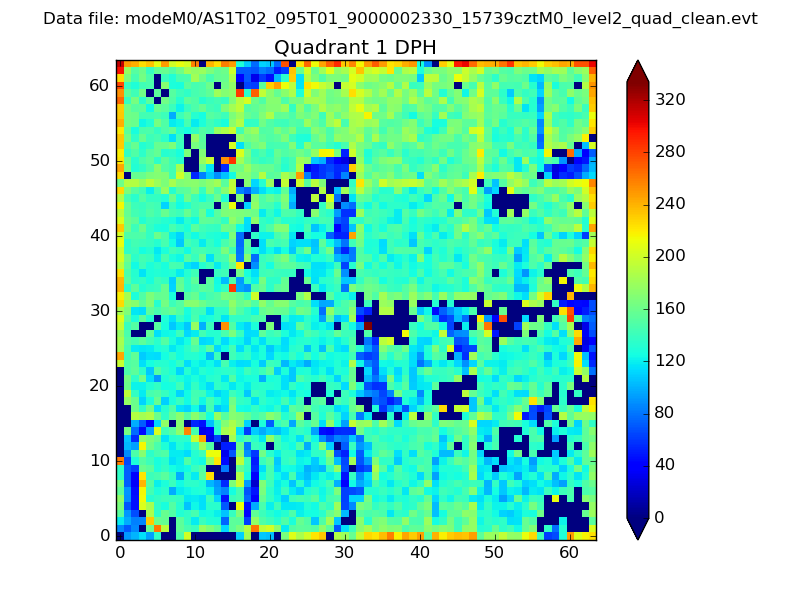 |
Quadrant B |
|---|---|---|---|
| Quadrant D | 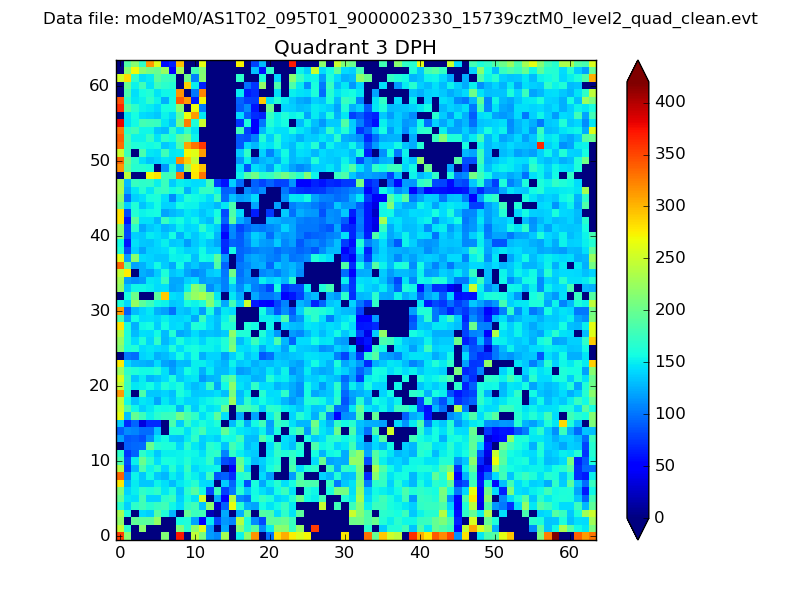 |
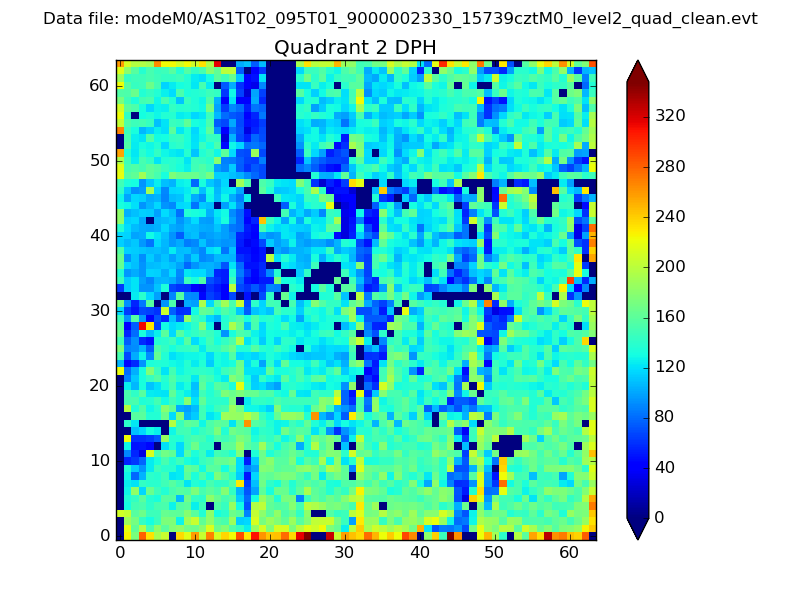 |
Quadrant C |
| Plot type | Count rate plots | Images |
|---|---|---|
| Comparison with Poisson distribution Blue bars denote a histogram of data divided into 1 sec bins. Red curve is a Poisson curve with rate = median count rate of data. |
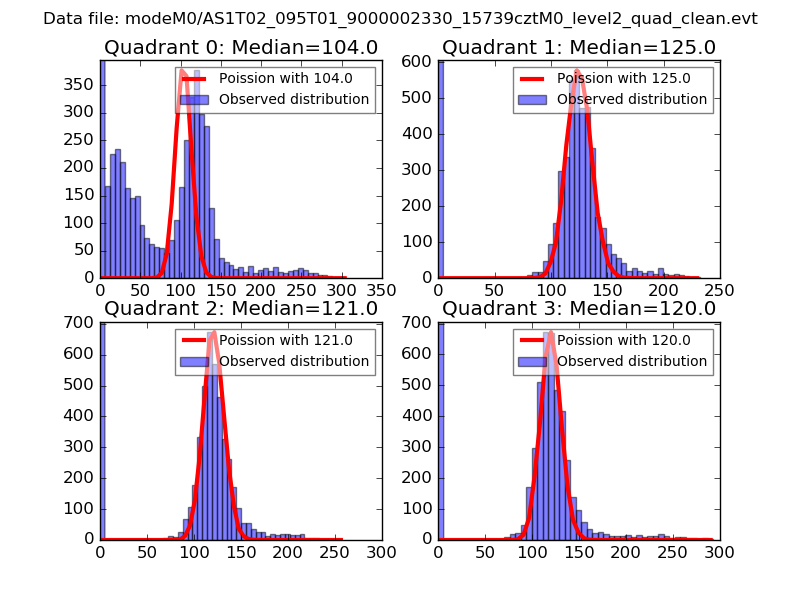 |
 |
| Quadrant-wise count rates Data is divided into 100 sec bins |
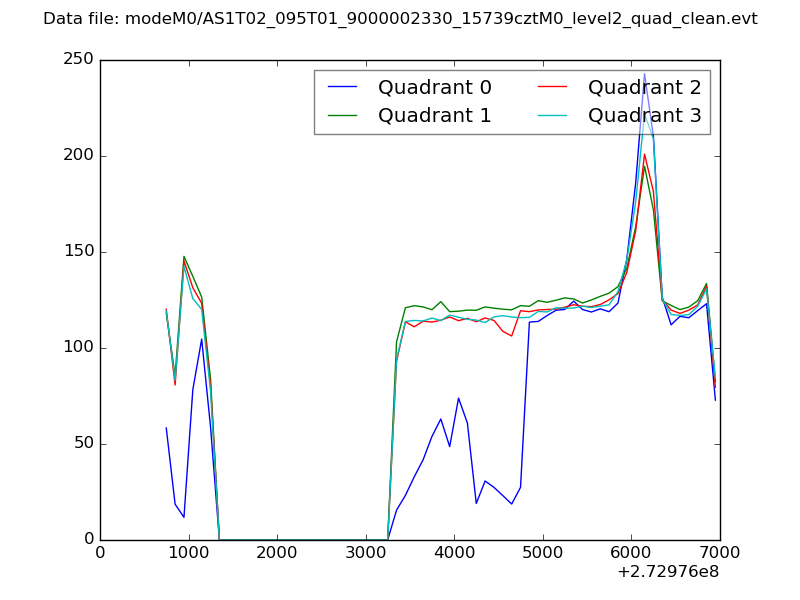 |
|
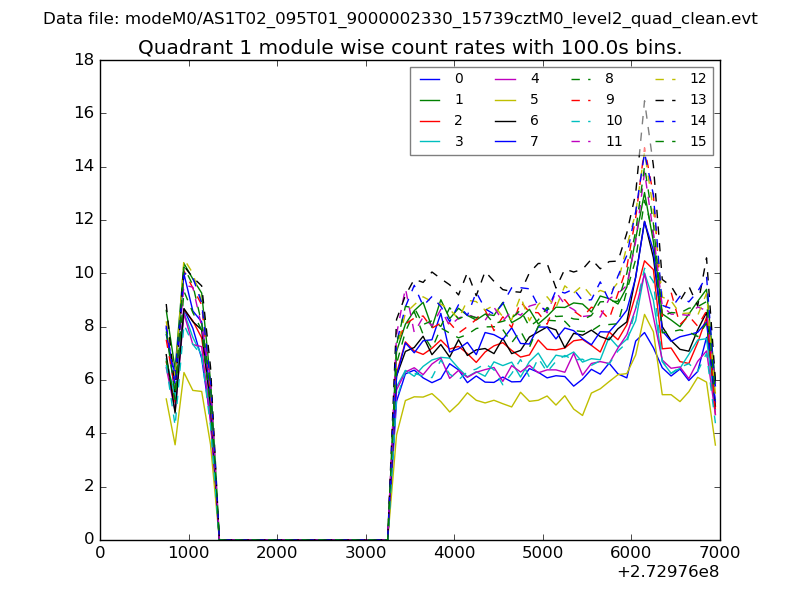
| Module-wise count rates for Quadrant A Data is divided into 100 sec bins |
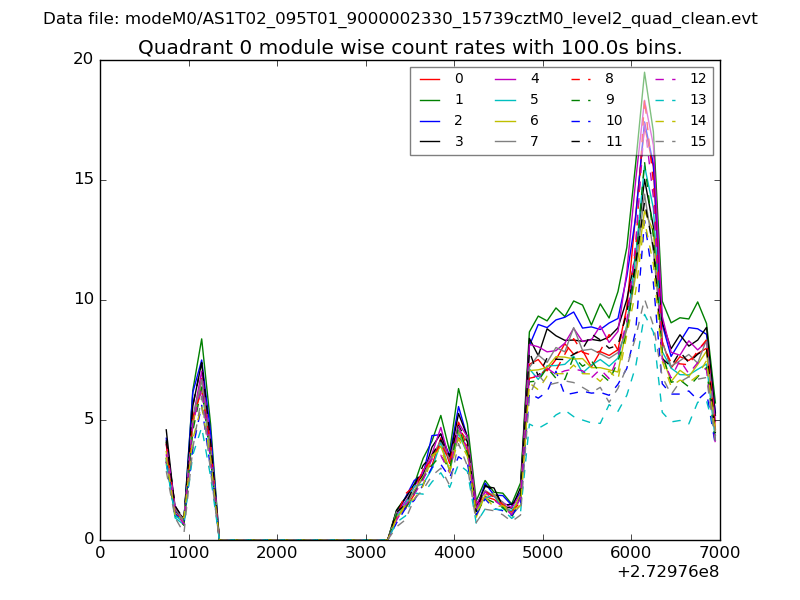 |
 |
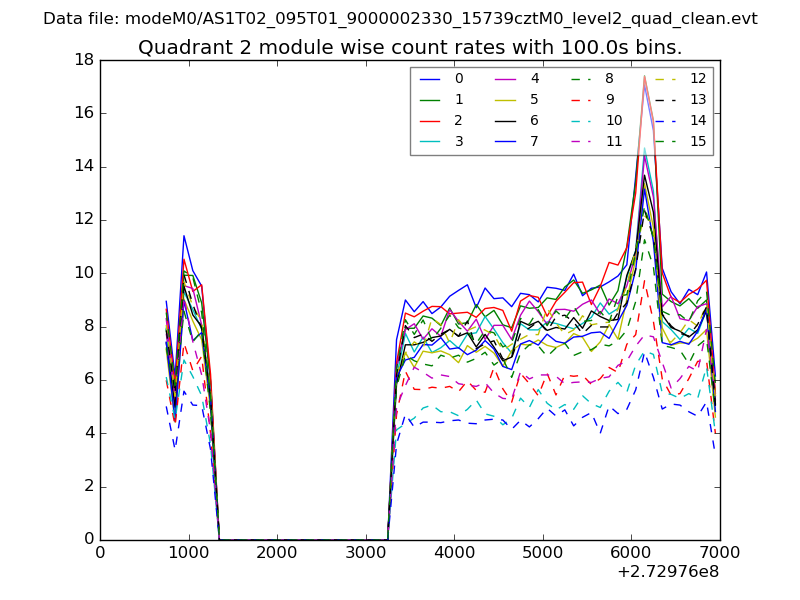
| Module-wise count rates for Quadrant B Data is divided into 100 sec bins |
 |
 |
| Module-wise count rates for Quadrant C Data is divided into 100 sec bins |
 |
 |
| Module-wise count rates for Quadrant D Data is divided into 100 sec bins |
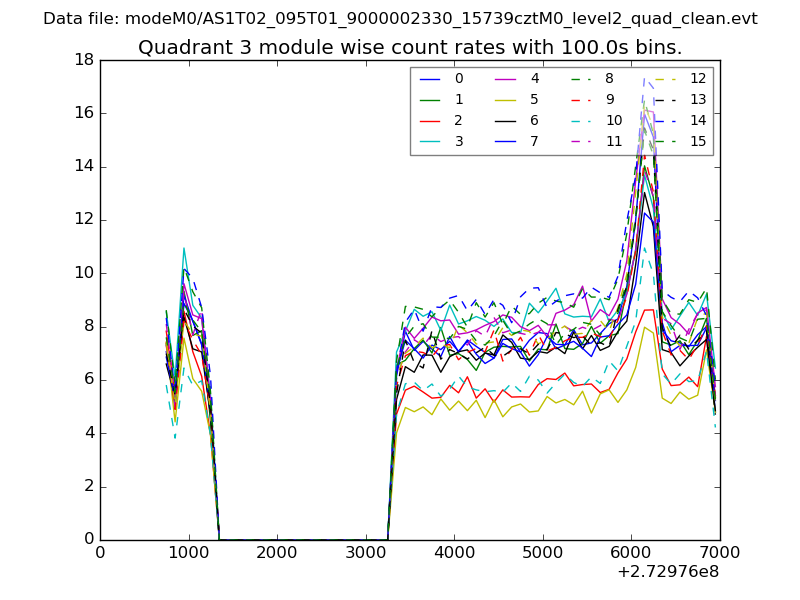 |
 |
| Parameter | Plot |
|---|---|
| CZT HV Monitor | 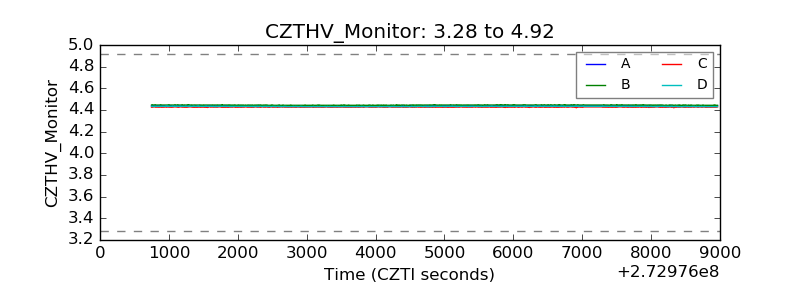 |
| D_VDD | 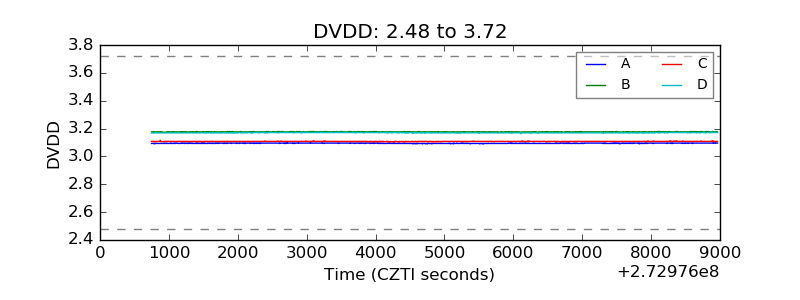 |
| Temperature 1 | 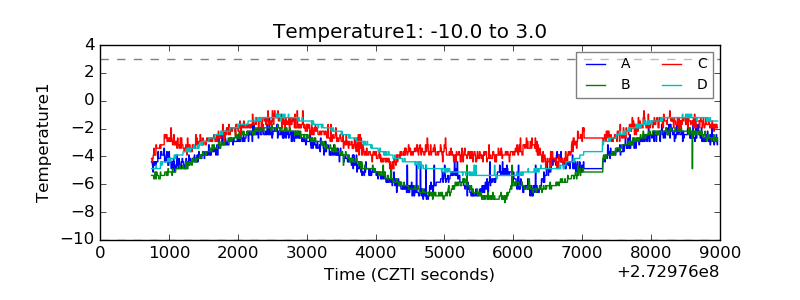 |
| Veto HV Monitor | 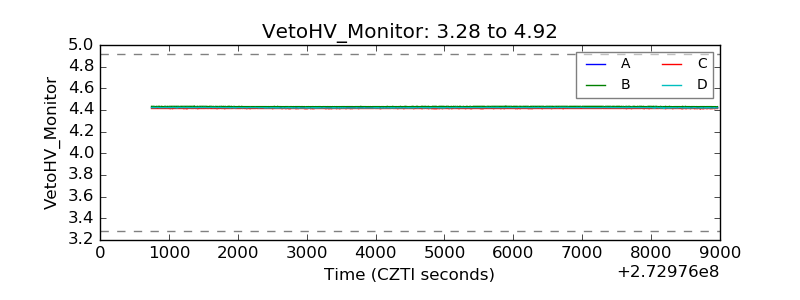 |
| Veto LLD | 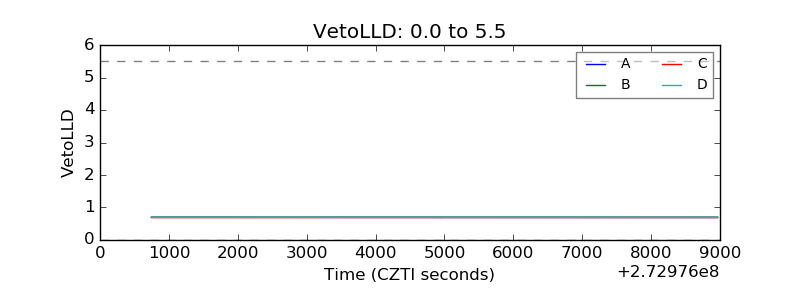 |
| Alpha Counter | 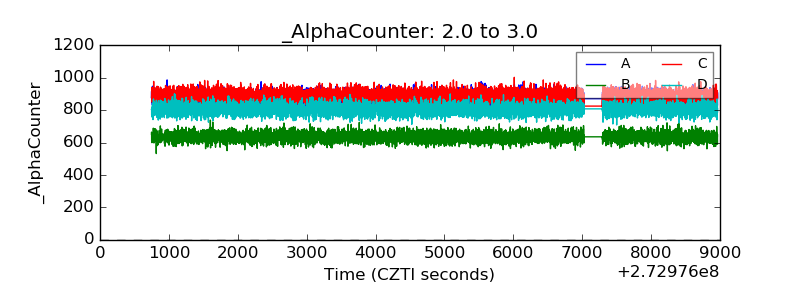 |
| _CPM_Rate |  |
| CZT Counter |  |
| +2.5 Volts monitor |  |
| +5 Volts monitor |  |
| _ROLL_ROT | 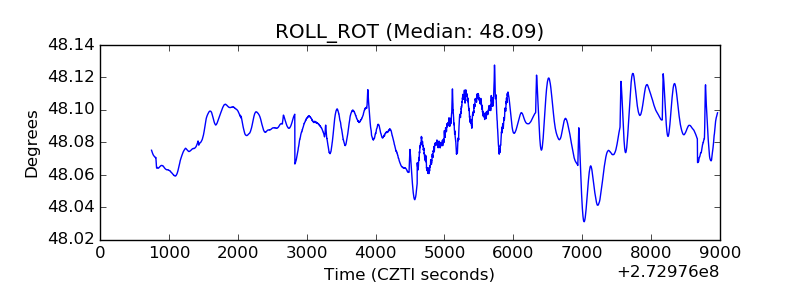 |
| _Roll_DEC | 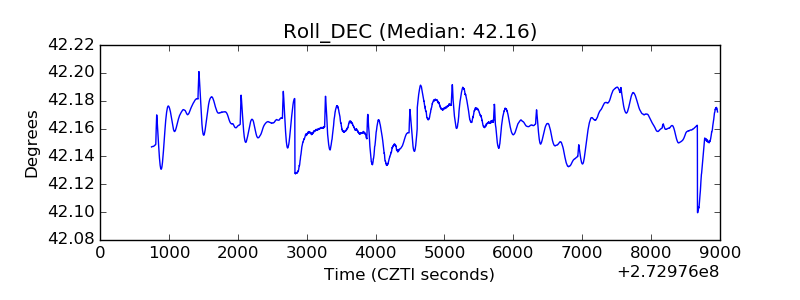 |
| _Roll_RA |  |
| Veto Counter | 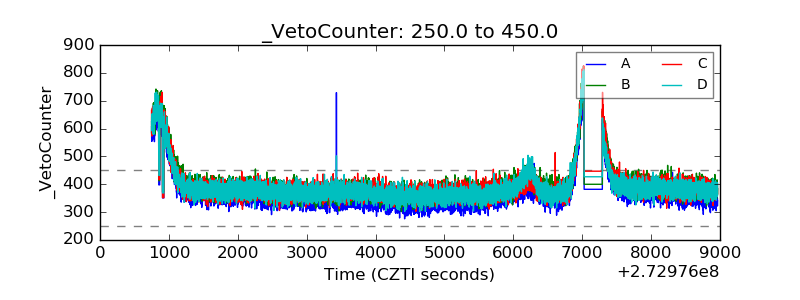 |