| Param | Original file | Final file |
|---|---|---|
| Filename | modeM0/AS1T02_095T01_9000002330_15742cztM0_level2.evt | modeM0/AS1T02_095T01_9000002330_15742cztM0_level2_quad_clean.evt |
| Size (bytes) | 1,654,332,480 | 230,480,640 |
| Size | 1.5 GB | 219.8 MB |
| Events in quadrant A | 19,950,339 | 1,352,842 |
| Events in quadrant B | 9,229,388 | 1,487,550 |
| Events in quadrant C | 8,674,122 | 1,451,935 |
| Events in quadrant D | 11,012,064 | 1,425,181 |
| Mode SS | |||
|---|---|---|---|
| Quadrant | BADHDUFLAG | Total packets | Discarded packets |
| A | 0 | 374 | 0 |
| B | 0 | 374 | 0 |
| C | 0 | 374 | 0 |
| D | 0 | 374 | 0 |
| Mode M0 | |||
|---|---|---|---|
| Quadrant | BADHDUFLAG | Total packets | Discarded packets |
| A | 0 | 71370 | 5 |
| B | 0 | 39588 | 4 |
| C | 0 | 38003 | 4 |
| D | 0 | 45315 | 4 |
| Mode M9 | |||
|---|---|---|---|
| Quadrant | BADHDUFLAG | Total packets | Discarded packets |
| A | 0 | 23 | 0 |
| B | 0 | 23 | 0 |
| C | 0 | 23 | 0 |
| D | 0 | 23 | 0 |
| Quadrant | Total seconds | Saturated seconds | Saturation percentage |
|---|---|---|---|
| A | 18314 | 4721 | 25.778093% |
| B | 18314 | 222 | 1.212187% |
| C | 18314 | 303 | 1.654472% |
| D | 18314 | 683 | 3.729387% |
Noise dominated data is calculated using 1-second bins in cleaned event files. If a bin has >2000 counts, and if more than 50% of those come from <1% of pixels, then it is considered to be noise-dominated and hence unusable.
| Quadrant | # 1 sec bins | Bins with >0 counts | Bins with >2000 counts | High rate bins dominated by noise | Noise dominated (total time) | Noise dominated (detector-on time) | Marked lightcurve |
|---|---|---|---|---|---|---|---|
| A | 20595 | 18319 | 4109 | 4109 | 19.95% | 22.43% | 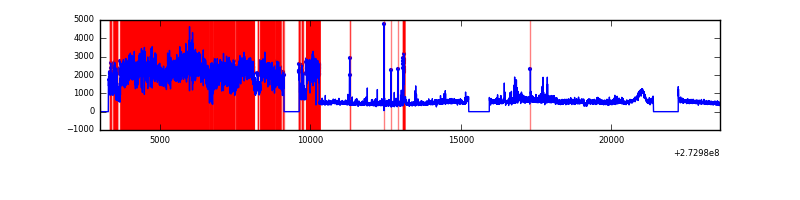 |
| B | 20595 | 18319 | 7 | 7 | 0.03% | 0.04% | 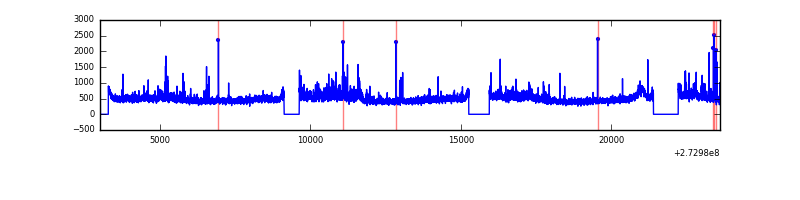 |
| C | 20595 | 18319 | 0 | 0 | 0.00% | 0.00% | 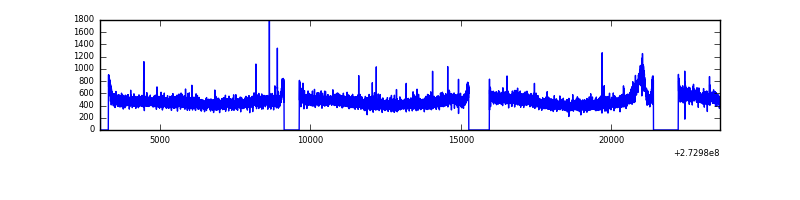 |
| D | 20595 | 18319 | 472 | 472 | 2.29% | 2.58% | 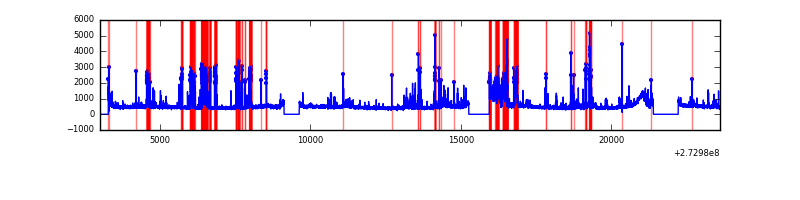 |
Top three noisy pixels from each quadrant. If the there are fewer than three noisy pixels in the level2.evt file, extra rows are filled as -1
| Pixel properties | Quadrant properties | ||||||
|---|---|---|---|---|---|---|---|
| Quadrant | DetID | PixID | Counts | Sigma | Mean | Median | Sigma |
| A | 15 | 239 | 11979887 | 29200.03 | 2036 | 1988 | 410.2 |
| A | 9 | 143 | 149945 | 360.69 | 2036 | 1988 | 410.2 |
| A | 0 | 226 | 17744 | 38.41 | 2036 | 1988 | 410.2 |
| B | 4 | 251 | 304046 | 721.19 | 2192 | 2136 | 418.6 |
| B | 4 | 173 | 105477 | 246.86 | 2192 | 2136 | 418.6 |
| B | 4 | 216 | 73056 | 169.41 | 2192 | 2136 | 418.6 |
| C | 14 | 238 | 323813 | 650.0 | 2118 | 2133 | 494.9 |
| C | 3 | 233 | 50204 | 97.13 | 2118 | 2133 | 494.9 |
| C | 10 | 22 | 15525 | 27.06 | 2118 | 2133 | 494.9 |
| D | 1 | 52 | 2728330 | 5190.58 | 2155 | 2095 | 525.2 |
| D | 2 | 234 | 83605 | 155.19 | 2155 | 2095 | 525.2 |
| D | 10 | 70 | 53357 | 97.6 | 2155 | 2095 | 525.2 |
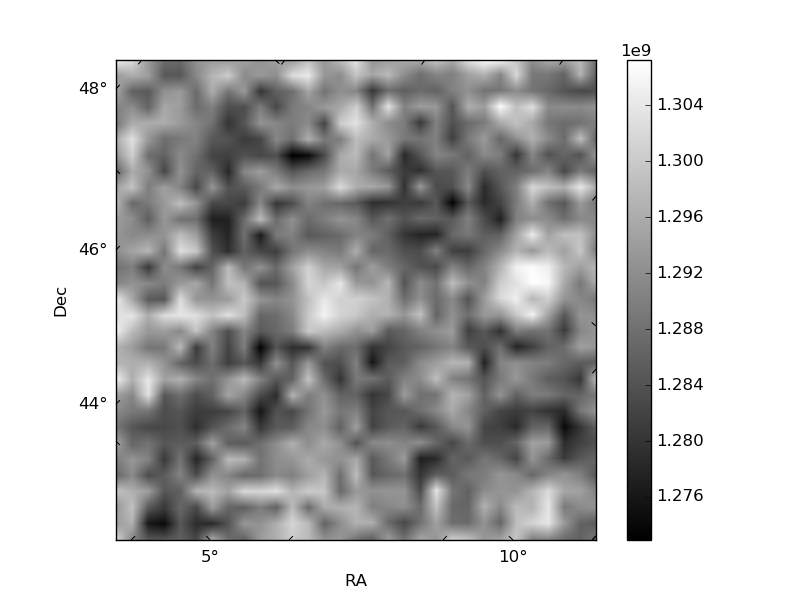
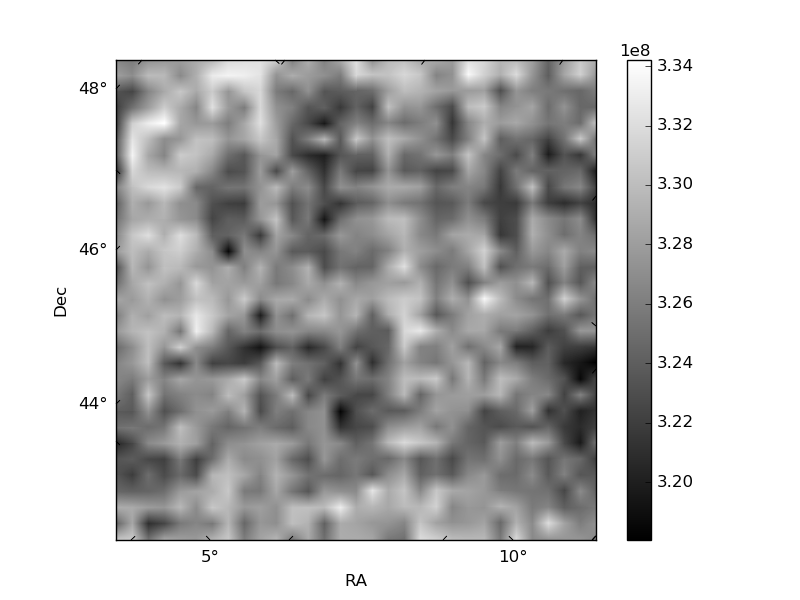
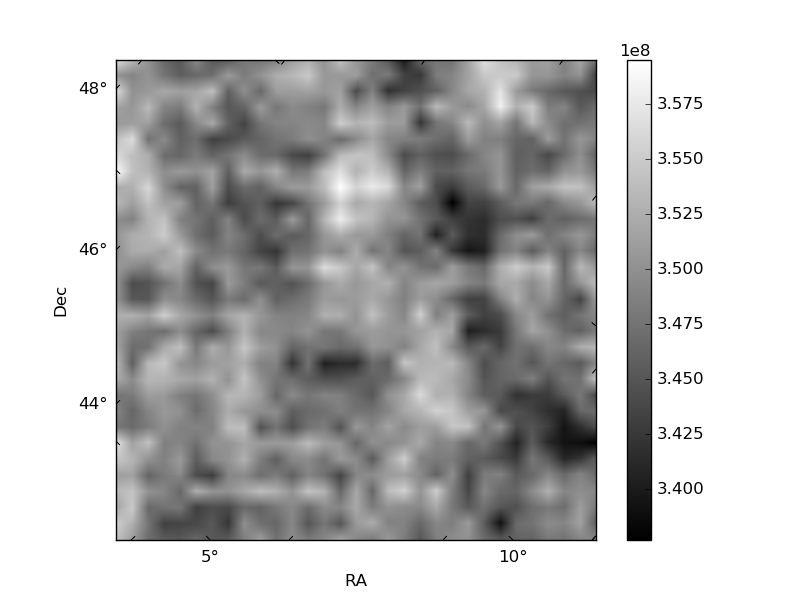
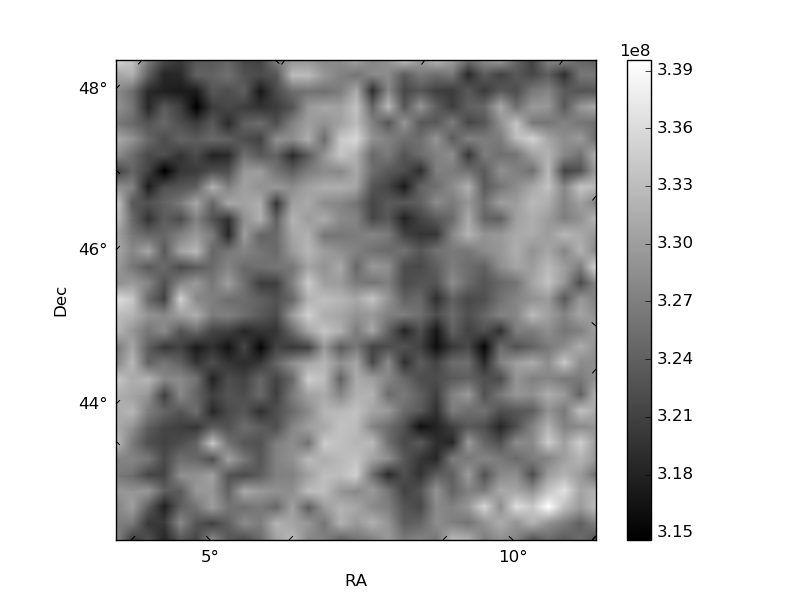
Histogram calculated using DETX and DETY for each event in the final _common_clean file
| Quadrant A | 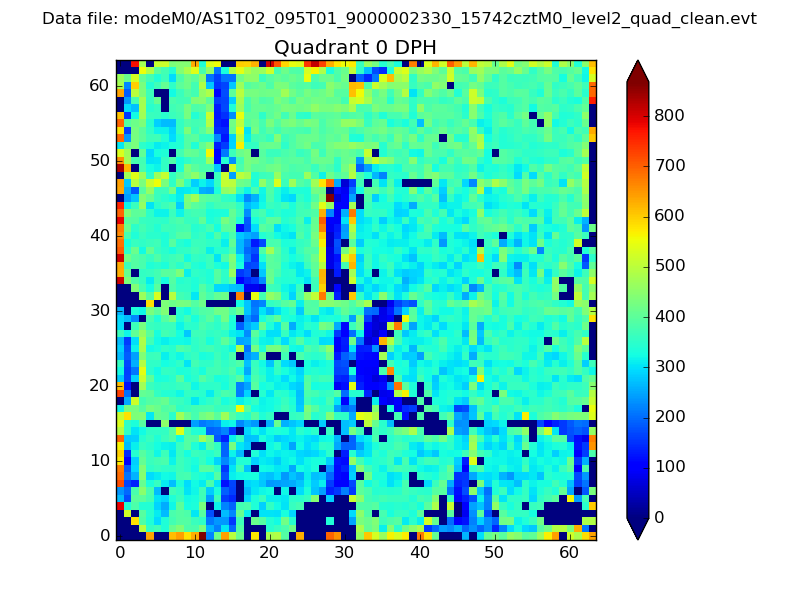 |
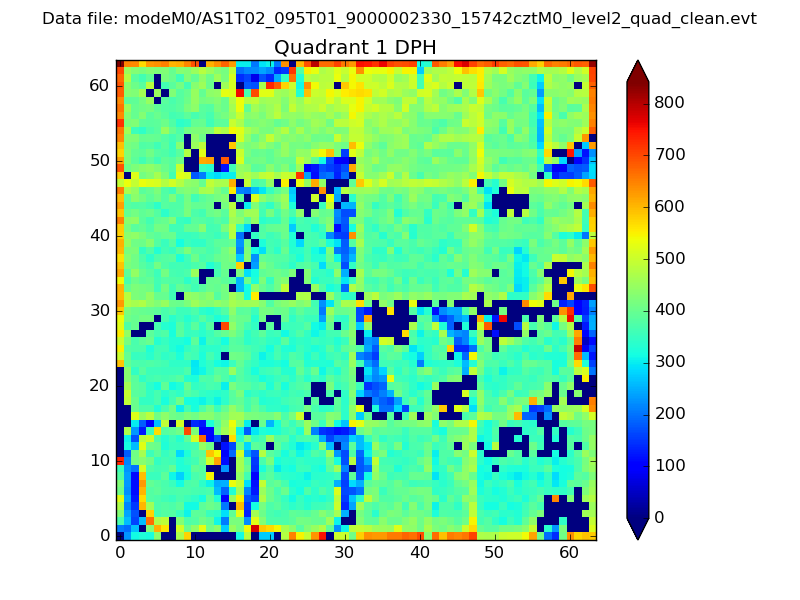 |
Quadrant B |
|---|---|---|---|
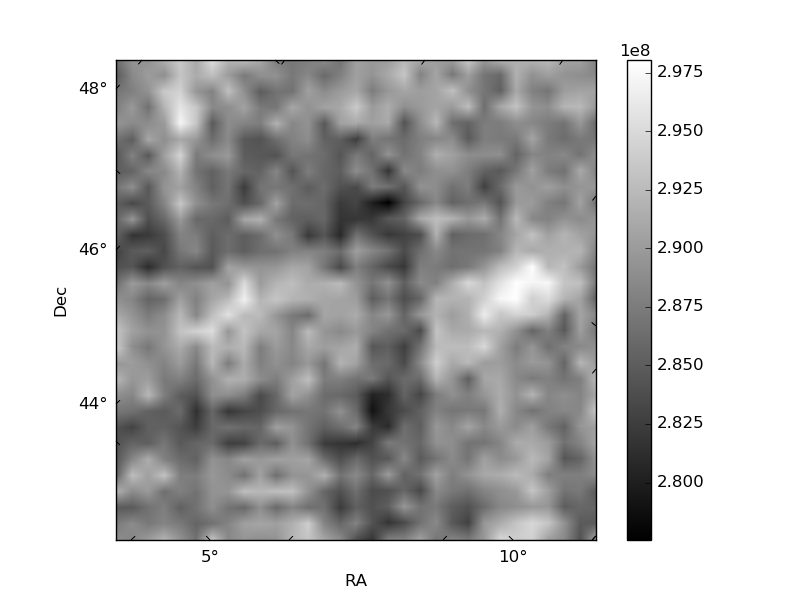
| Quadrant D | 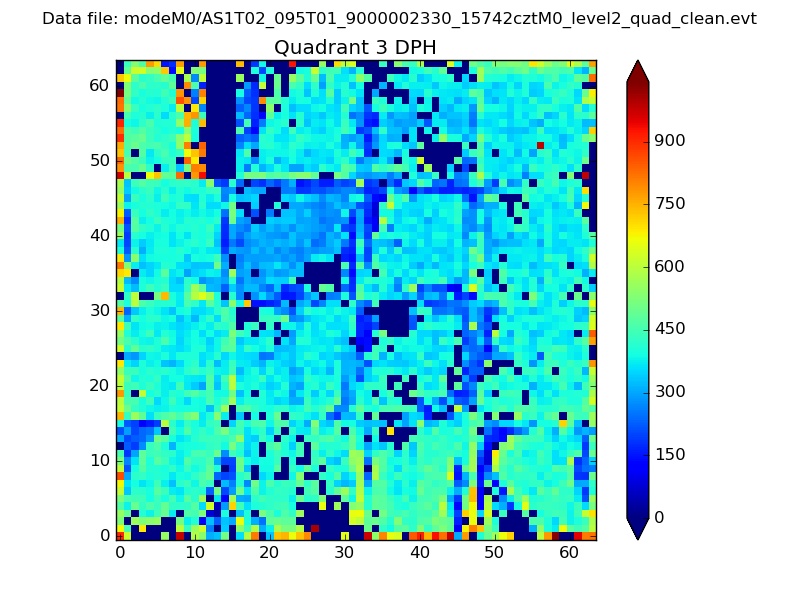 |
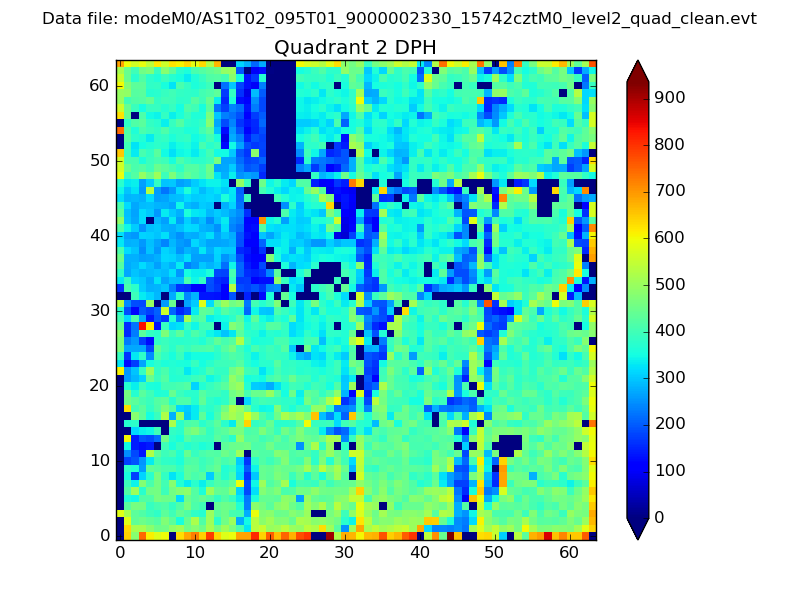 |
Quadrant C |
| Plot type | Count rate plots | Images |
|---|---|---|
| Comparison with Poisson distribution Blue bars denote a histogram of data divided into 1 sec bins. Red curve is a Poisson curve with rate = median count rate of data. |
 |
 |
| Quadrant-wise count rates Data is divided into 100 sec bins |
 |
|
| Module-wise count rates for Quadrant A Data is divided into 100 sec bins |
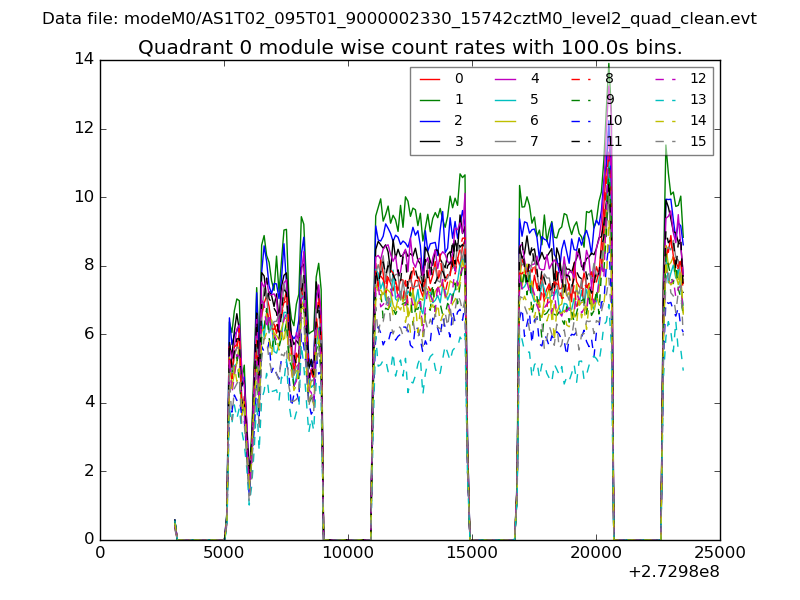 |
 |
| Module-wise count rates for Quadrant B Data is divided into 100 sec bins |
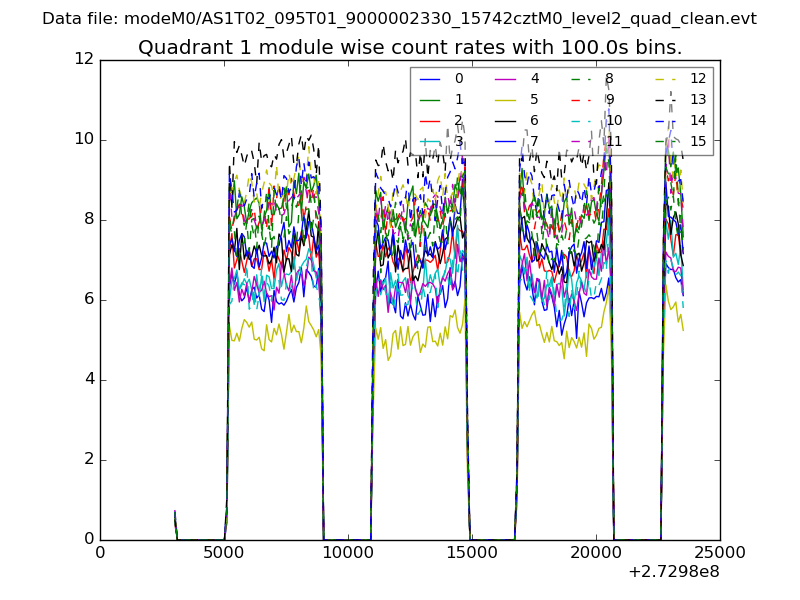 |
 |
| Module-wise count rates for Quadrant C Data is divided into 100 sec bins |
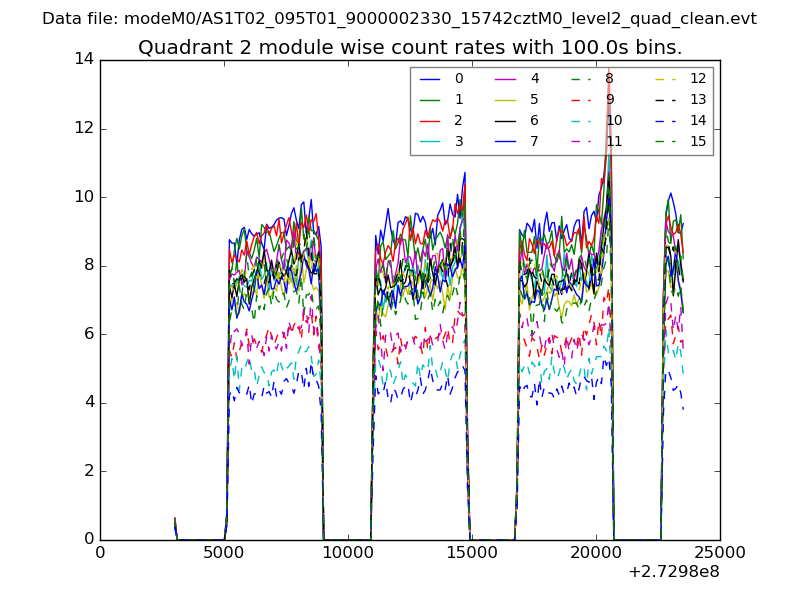 |
 |
| Module-wise count rates for Quadrant D Data is divided into 100 sec bins |
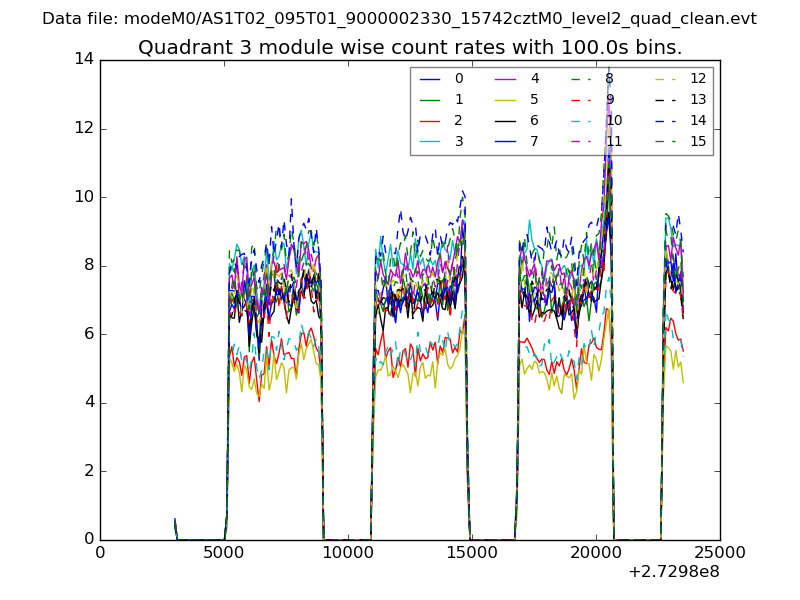 |
 |
| Parameter | Plot |
|---|---|
| CZT HV Monitor | 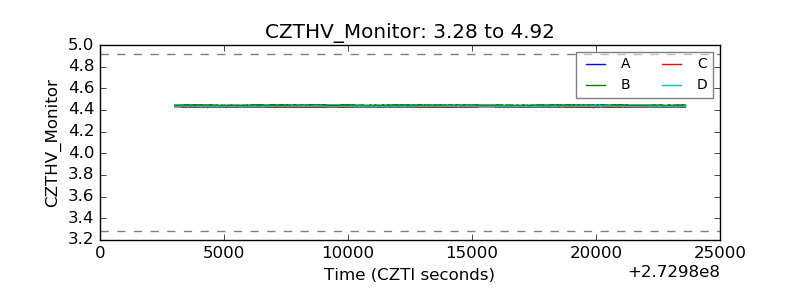 |
| D_VDD | 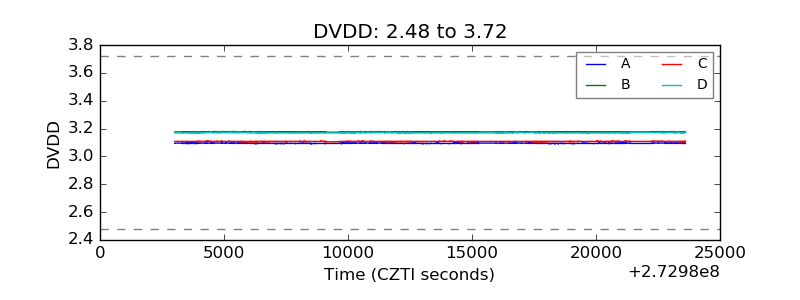 |
| Temperature 1 | 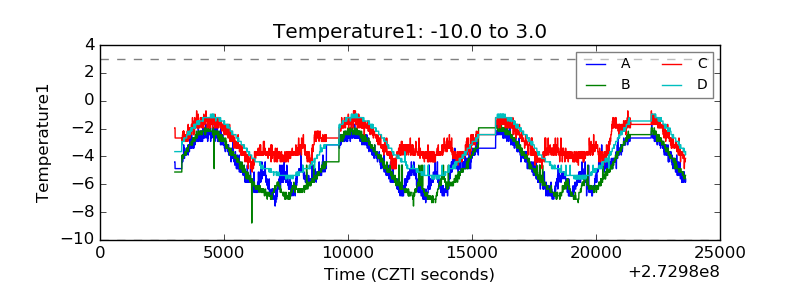 |
| Veto HV Monitor | 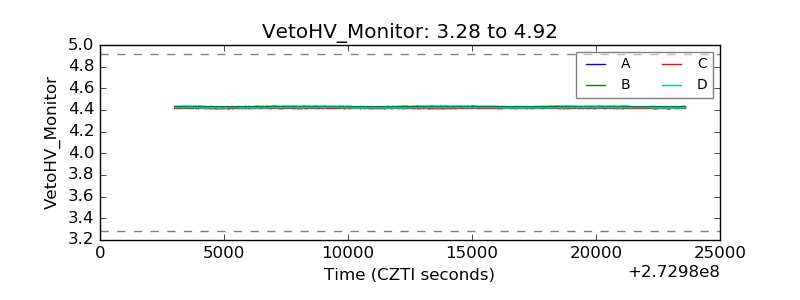 |
| Veto LLD |  |
| Alpha Counter | 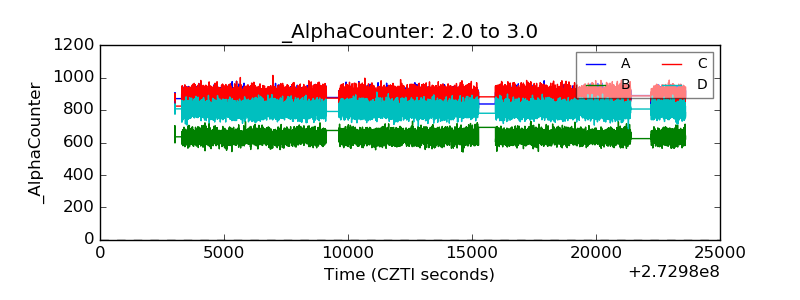 |
| _CPM_Rate |  |
| CZT Counter | 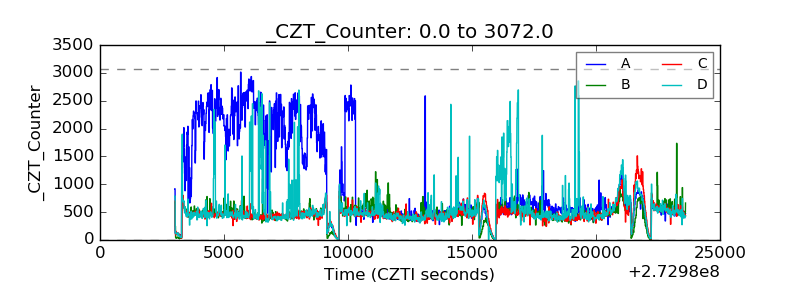 |
| +2.5 Volts monitor |  |
| +5 Volts monitor |  |
| _ROLL_ROT | 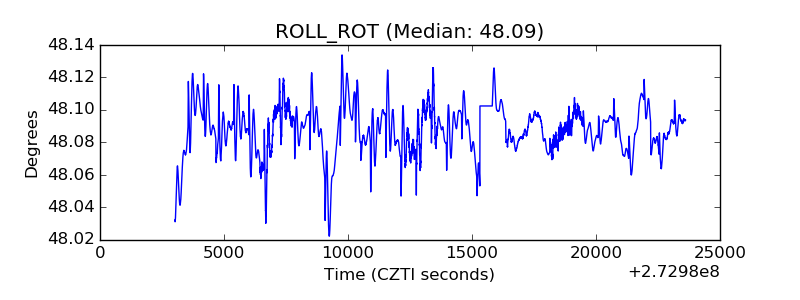 |
| _Roll_DEC | 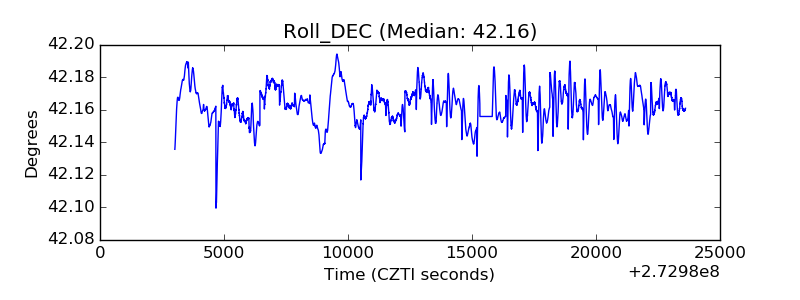 |
| _Roll_RA | 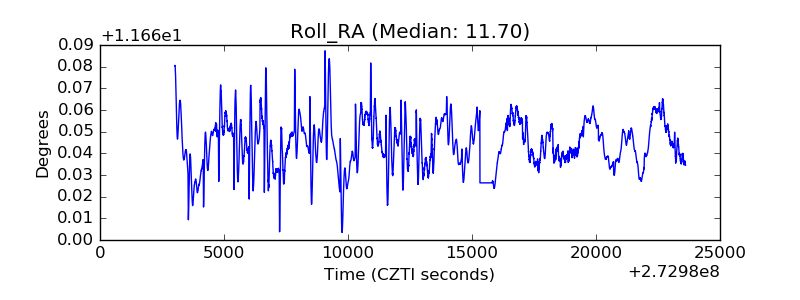 |
| Veto Counter | 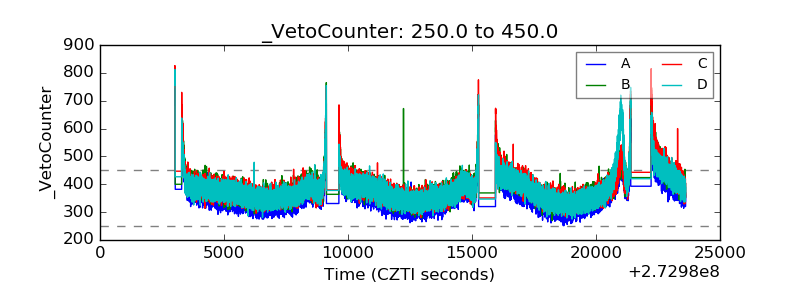 |