| Param | Original file | Final file |
|---|---|---|
| Filename | modeM0/AS1T02_095T01_9000002330_15743cztM0_level2.evt | modeM0/AS1T02_095T01_9000002330_15743cztM0_level2_quad_clean.evt |
| Size (bytes) | 530,596,800 | 99,230,400 |
| Size | 506.0 MB | 94.6 MB |
| Events in quadrant A | 3,251,626 | 640,376 |
| Events in quadrant B | 5,370,789 | 634,542 |
| Events in quadrant C | 3,363,514 | 631,269 |
| Events in quadrant D | 3,616,550 | 619,746 |
| Mode SS | |||
|---|---|---|---|
| Quadrant | BADHDUFLAG | Total packets | Discarded packets |
| A | 0 | 142 | 0 |
| B | 0 | 142 | 0 |
| C | 0 | 142 | 0 |
| D | 0 | 142 | 0 |
| Mode M0 | |||
|---|---|---|---|
| Quadrant | BADHDUFLAG | Total packets | Discarded packets |
| A | 0 | 14374 | 3 |
| B | 0 | 20716 | 2 |
| C | 0 | 14608 | 2 |
| D | 0 | 15556 | 2 |
| Mode M9 | |||
|---|---|---|---|
| Quadrant | BADHDUFLAG | Total packets | Discarded packets |
| A | 0 | 18 | 0 |
| B | 0 | 18 | 0 |
| C | 0 | 18 | 0 |
| D | 0 | 18 | 0 |
| Quadrant | Total seconds | Saturated seconds | Saturation percentage |
|---|---|---|---|
| A | 6875 | 58 | 0.843636% |
| B | 6875 | 503 | 7.316364% |
| C | 6875 | 131 | 1.905455% |
| D | 6875 | 92 | 1.338182% |
Noise dominated data is calculated using 1-second bins in cleaned event files. If a bin has >2000 counts, and if more than 50% of those come from <1% of pixels, then it is considered to be noise-dominated and hence unusable.
| Quadrant | # 1 sec bins | Bins with >0 counts | Bins with >2000 counts | High rate bins dominated by noise | Noise dominated (total time) | Noise dominated (detector-on time) | Marked lightcurve |
|---|---|---|---|---|---|---|---|
| A | 8711 | 6878 | 3 | 3 | 0.03% | 0.04% | 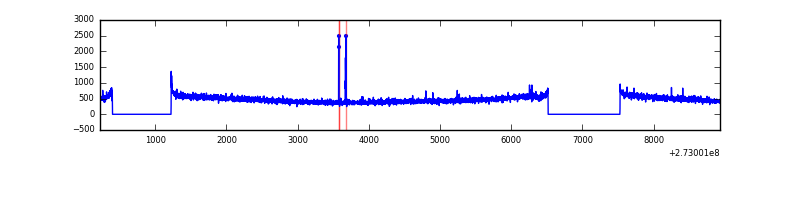 |
| B | 8711 | 6878 | 220 | 220 | 2.53% | 3.20% | 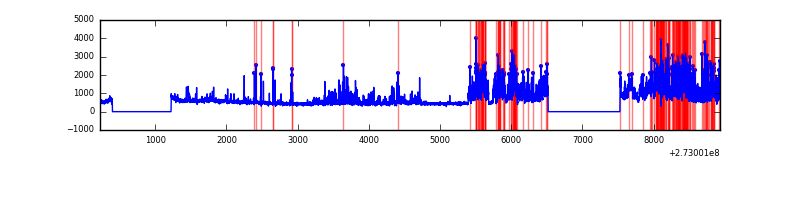 |
| C | 8711 | 6878 | 0 | 0 | 0.00% | 0.00% | 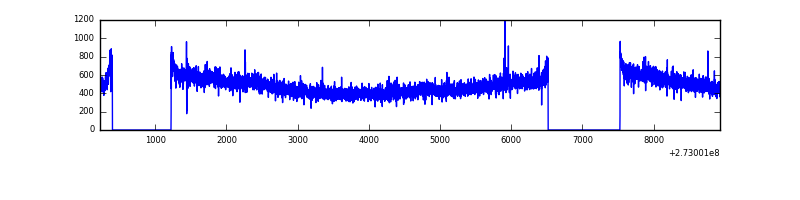 |
| D | 8711 | 6878 | 19 | 19 | 0.22% | 0.28% | 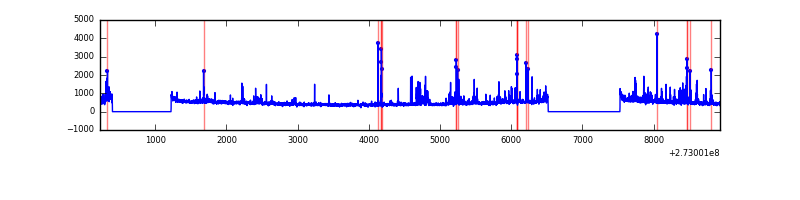 |
Top three noisy pixels from each quadrant. If the there are fewer than three noisy pixels in the level2.evt file, extra rows are filled as -1
| Pixel properties | Quadrant properties | ||||||
|---|---|---|---|---|---|---|---|
| Quadrant | DetID | PixID | Counts | Sigma | Mean | Median | Sigma |
| A | 15 | 239 | 16635 | 93.55 | 837 | 820 | 169.1 |
| A | 9 | 143 | 9322 | 50.29 | 837 | 820 | 169.1 |
| A | 0 | 226 | 7270 | 38.15 | 837 | 820 | 169.1 |
| B | 4 | 251 | 1896218 | 11999.72 | 823 | 802 | 158.0 |
| B | 4 | 48 | 72326 | 452.81 | 823 | 802 | 158.0 |
| B | 4 | 216 | 65331 | 408.53 | 823 | 802 | 158.0 |
| C | 14 | 238 | 126162 | 662.33 | 811 | 817 | 189.2 |
| C | 3 | 233 | 65483 | 341.7 | 811 | 817 | 189.2 |
| C | 13 | 61 | 5762 | 26.13 | 811 | 817 | 189.2 |
| D | 1 | 52 | 421559 | 2095.26 | 822 | 799 | 200.8 |
| D | 7 | 223 | 37639 | 183.45 | 822 | 799 | 200.8 |
| D | 2 | 234 | 29061 | 140.74 | 822 | 799 | 200.8 |
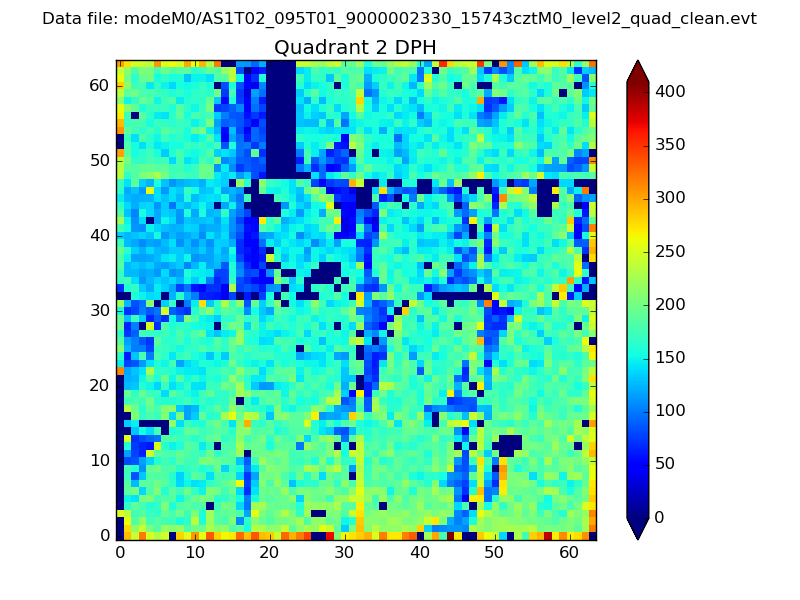
Histogram calculated using DETX and DETY for each event in the final _common_clean file
| Quadrant A |  |
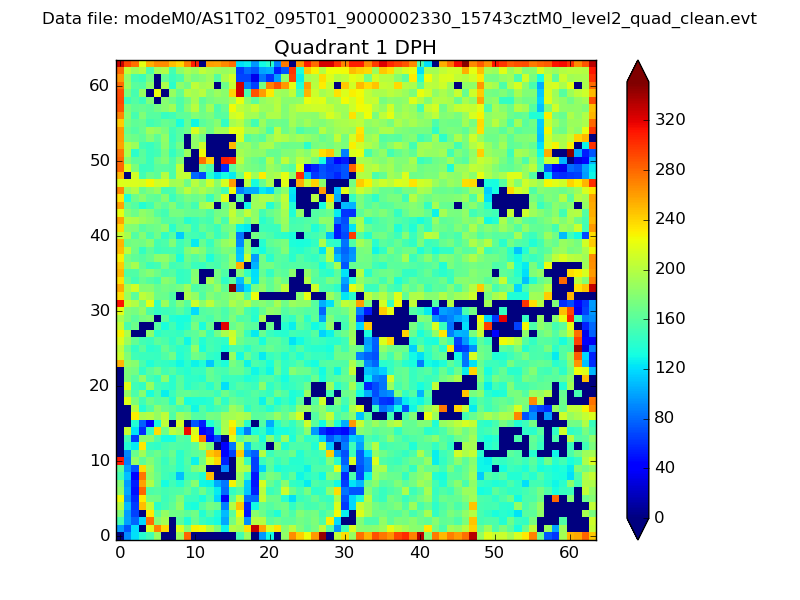 |
Quadrant B |
|---|---|---|---|
| Quadrant D |  |
 |
Quadrant C |
| Plot type | Count rate plots | Images |
|---|---|---|
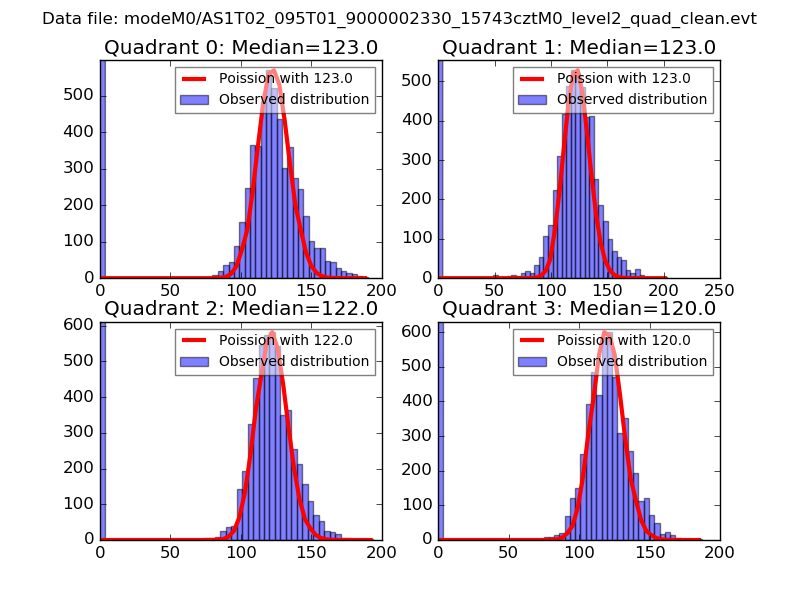
| Comparison with Poisson distribution Blue bars denote a histogram of data divided into 1 sec bins. Red curve is a Poisson curve with rate = median count rate of data. |
 |
 |
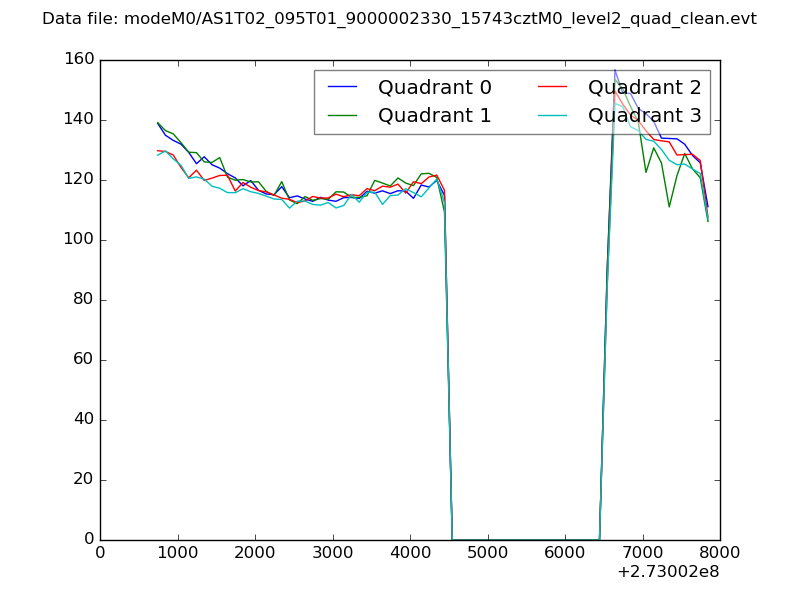
| Quadrant-wise count rates Data is divided into 100 sec bins |
 |
|
| Module-wise count rates for Quadrant A Data is divided into 100 sec bins |
 |
 |
| Module-wise count rates for Quadrant B Data is divided into 100 sec bins |
 |
 |
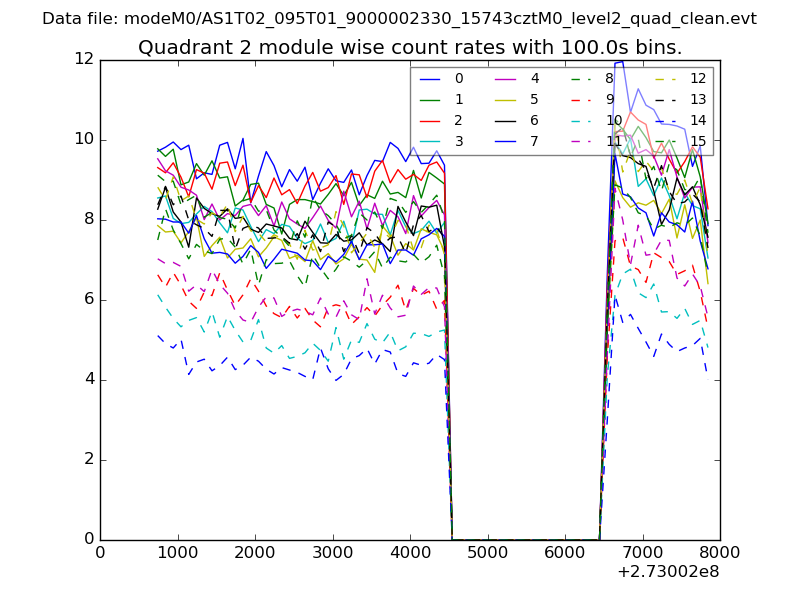
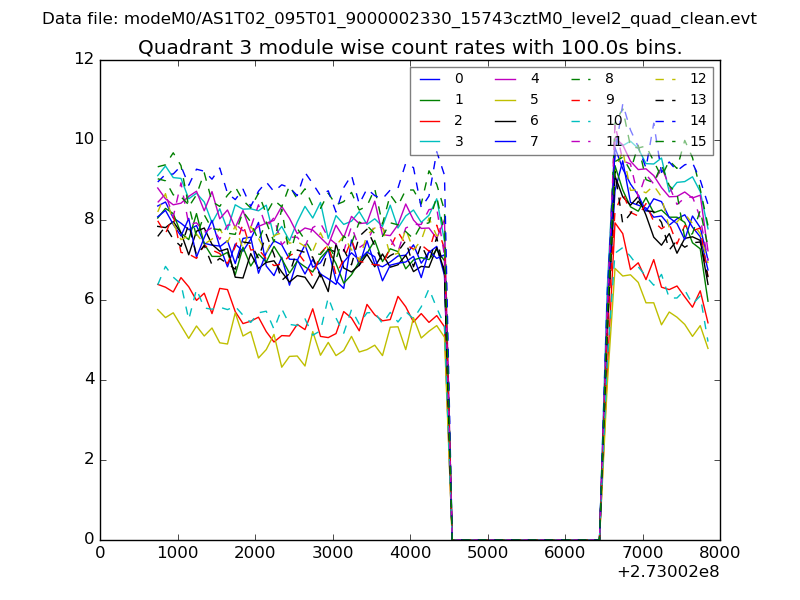
| Module-wise count rates for Quadrant C Data is divided into 100 sec bins |
 |
 |
| Module-wise count rates for Quadrant D Data is divided into 100 sec bins |
 |
 |
| Parameter | Plot |
|---|---|
| CZT HV Monitor | 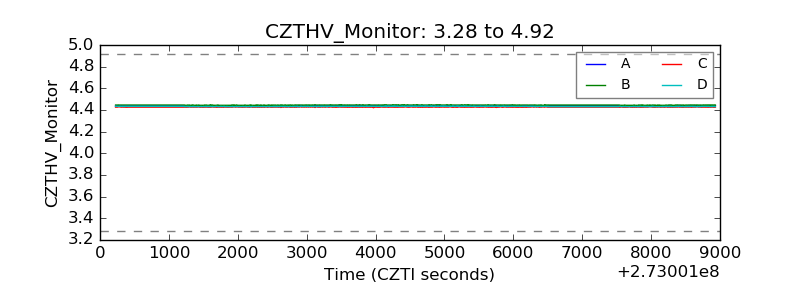 |
| D_VDD | 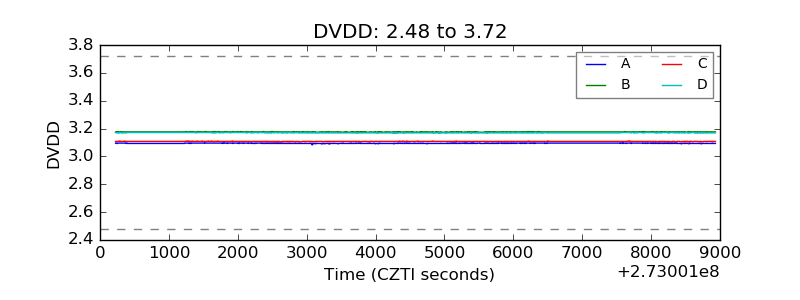 |
| Temperature 1 | 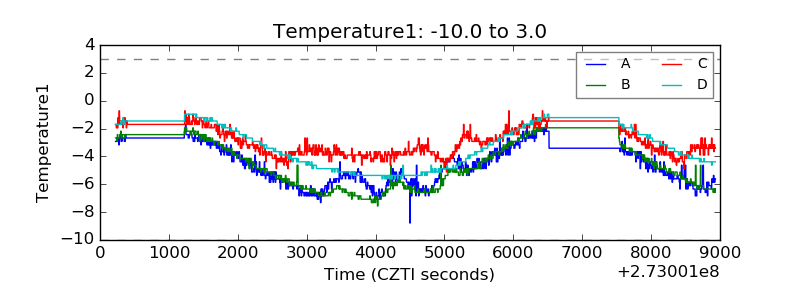 |
| Veto HV Monitor | 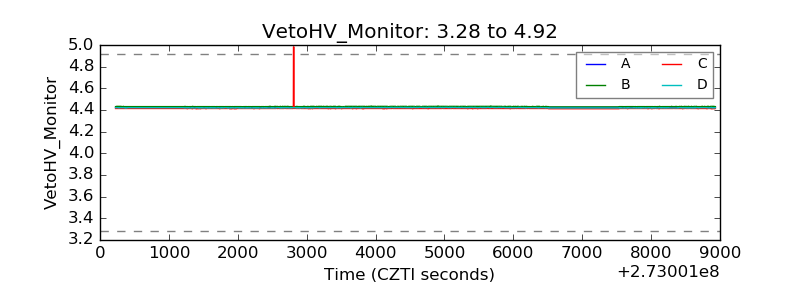 |
| Veto LLD | 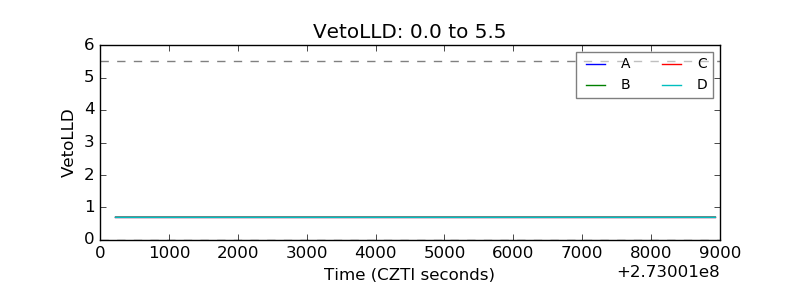 |
| Alpha Counter | 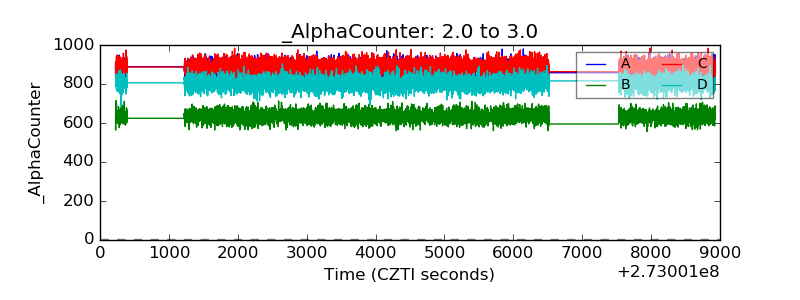 |
| _CPM_Rate | 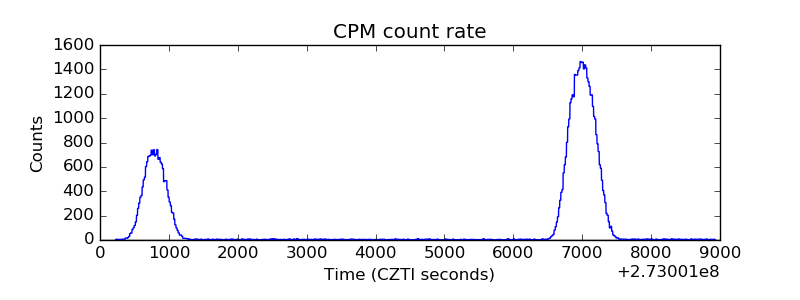 |
| CZT Counter | 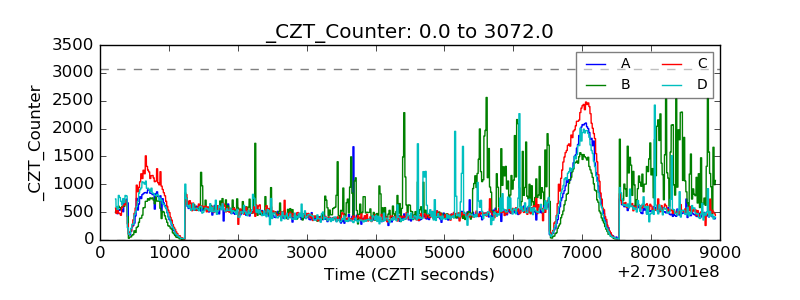 |
| +2.5 Volts monitor |  |
| +5 Volts monitor | 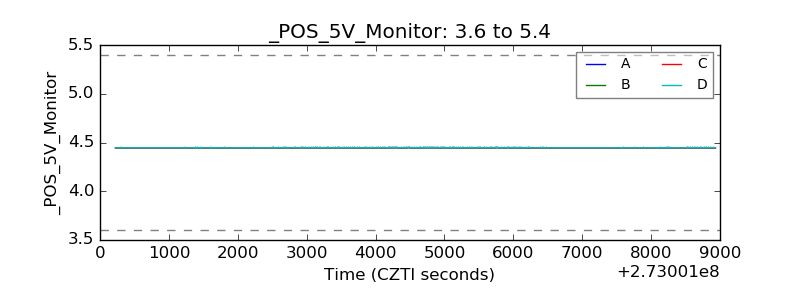 |
| _ROLL_ROT | 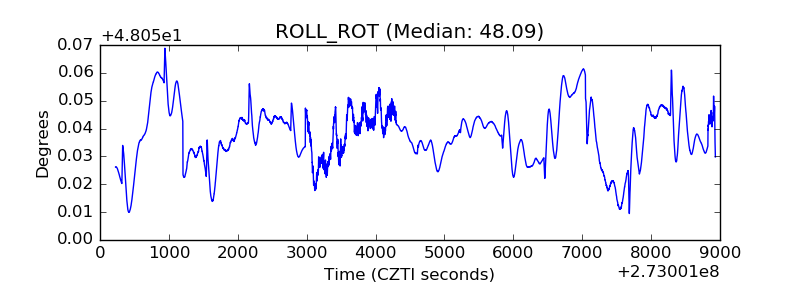 |
| _Roll_DEC | 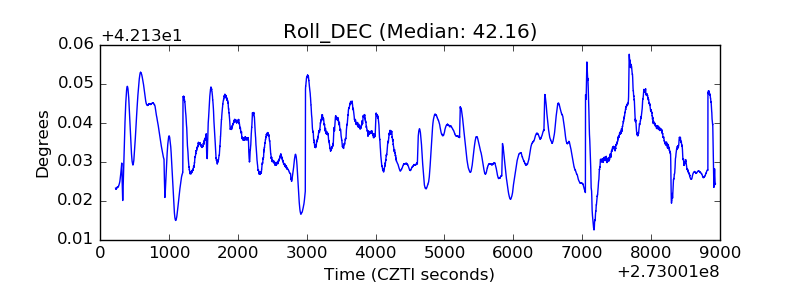 |
| _Roll_RA | 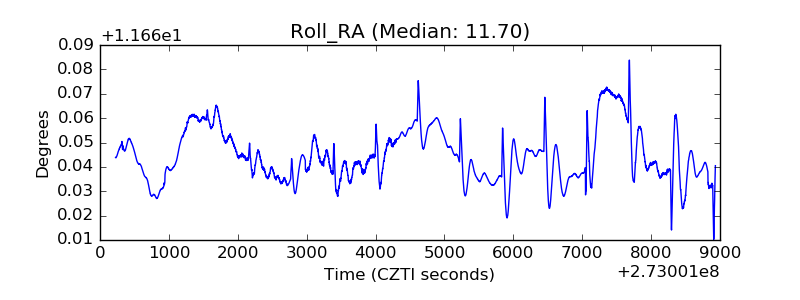 |
| Veto Counter | 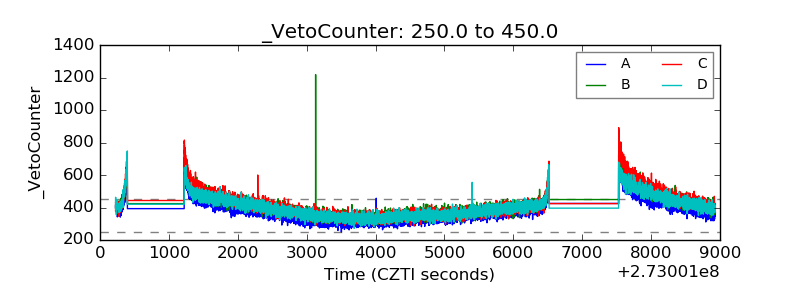 |