| Param | Original file | Final file |
|---|---|---|
| Filename | modeM0/AS1T02_095T01_9000002330_15745cztM0_level2.evt | modeM0/AS1T02_095T01_9000002330_15745cztM0_level2_quad_clean.evt |
| Size (bytes) | 521,576,640 | 100,848,960 |
| Size | 497.4 MB | 96.2 MB |
| Events in quadrant A | 3,128,319 | 660,662 |
| Events in quadrant B | 5,636,870 | 651,848 |
| Events in quadrant C | 3,240,077 | 657,003 |
| Events in quadrant D | 3,357,588 | 638,790 |
| Mode SS | |||
|---|---|---|---|
| Quadrant | BADHDUFLAG | Total packets | Discarded packets |
| A | 0 | 128 | 0 |
| B | 0 | 128 | 0 |
| C | 0 | 128 | 0 |
| D | 0 | 128 | 0 |
| Mode M0 | |||
|---|---|---|---|
| Quadrant | BADHDUFLAG | Total packets | Discarded packets |
| A | 0 | 13781 | 3 |
| B | 0 | 21197 | 2 |
| C | 0 | 13920 | 2 |
| D | 0 | 14599 | 2 |
| Mode M9 | |||
|---|---|---|---|
| Quadrant | BADHDUFLAG | Total packets | Discarded packets |
| A | 0 | 13 | 0 |
| B | 0 | 13 | 0 |
| C | 0 | 13 | 0 |
| D | 0 | 14 | 0 |
| Quadrant | Total seconds | Saturated seconds | Saturation percentage |
|---|---|---|---|
| A | 6393 | 65 | 1.016737% |
| B | 6393 | 412 | 6.444549% |
| C | 6393 | 113 | 1.767558% |
| D | 6393 | 90 | 1.407790% |
Noise dominated data is calculated using 1-second bins in cleaned event files. If a bin has >2000 counts, and if more than 50% of those come from <1% of pixels, then it is considered to be noise-dominated and hence unusable.
| Quadrant | # 1 sec bins | Bins with >0 counts | Bins with >2000 counts | High rate bins dominated by noise | Noise dominated (total time) | Noise dominated (detector-on time) | Marked lightcurve |
|---|---|---|---|---|---|---|---|
| A | 7519 | 6395 | 0 | 0 | 0.00% | 0.00% | 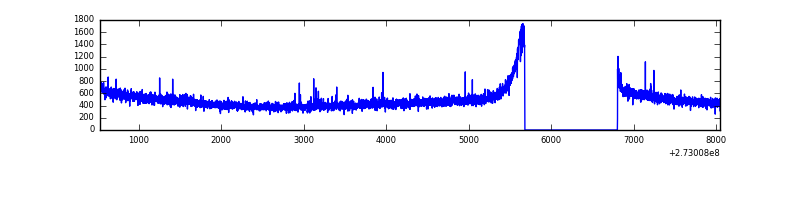 |
| B | 7519 | 6395 | 195 | 195 | 2.59% | 3.05% |  |
| C | 7519 | 6395 | 0 | 0 | 0.00% | 0.00% |  |
| D | 7519 | 6395 | 7 | 7 | 0.09% | 0.11% |  |
Top three noisy pixels from each quadrant. If the there are fewer than three noisy pixels in the level2.evt file, extra rows are filled as -1
| Pixel properties | Quadrant properties | ||||||
|---|---|---|---|---|---|---|---|
| Quadrant | DetID | PixID | Counts | Sigma | Mean | Median | Sigma |
| A | 0 | 226 | 7009 | 38.09 | 810 | 794 | 163.2 |
| A | 4 | 2 | 6414 | 34.44 | 810 | 794 | 163.2 |
| A | 12 | 194 | 6052 | 32.22 | 810 | 794 | 163.2 |
| B | 4 | 251 | 2308658 | 15574.44 | 789 | 771 | 148.2 |
| B | 4 | 48 | 68478 | 456.91 | 789 | 771 | 148.2 |
| B | 4 | 216 | 51954 | 345.4 | 789 | 771 | 148.2 |
| C | 14 | 238 | 120920 | 658.13 | 782 | 787 | 182.5 |
| C | 3 | 233 | 56800 | 306.86 | 782 | 787 | 182.5 |
| C | 10 | 187 | 5544 | 26.06 | 782 | 787 | 182.5 |
| D | 1 | 52 | 271497 | 1396.19 | 800 | 780 | 193.9 |
| D | 2 | 234 | 26029 | 130.22 | 800 | 780 | 193.9 |
| D | 10 | 70 | 16385 | 80.48 | 800 | 780 | 193.9 |
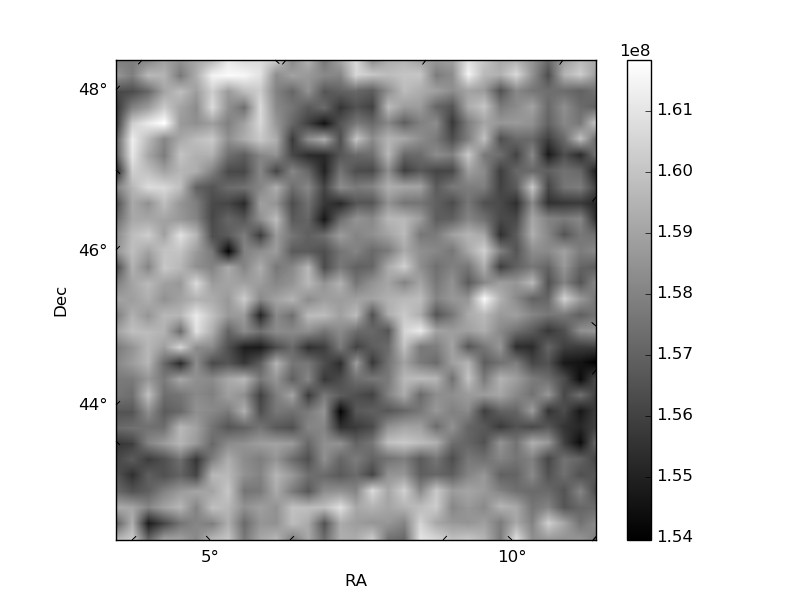
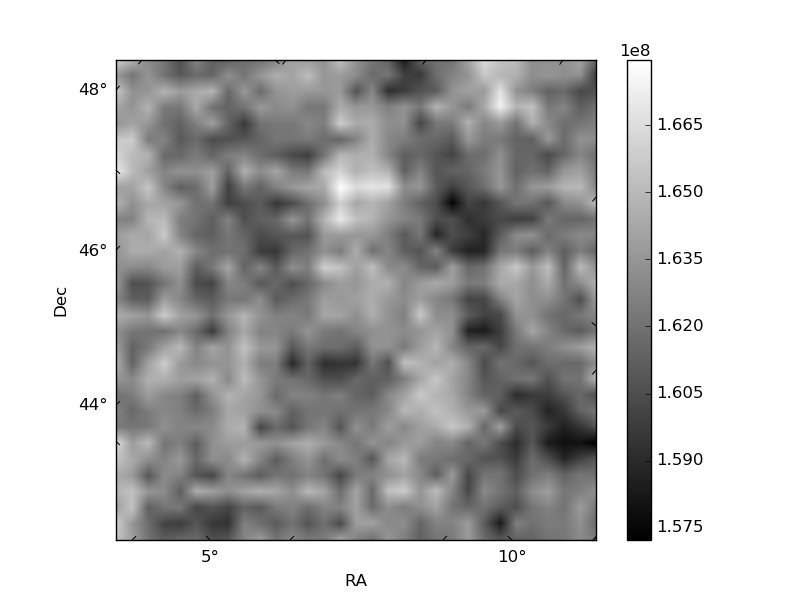
Histogram calculated using DETX and DETY for each event in the final _common_clean file
| Quadrant A |  |
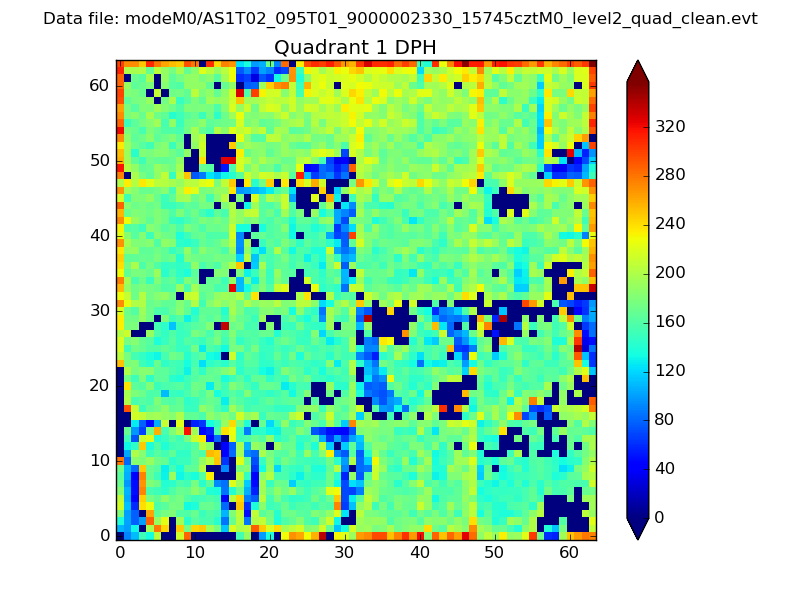 |
Quadrant B |
|---|---|---|---|
| Quadrant D |  |
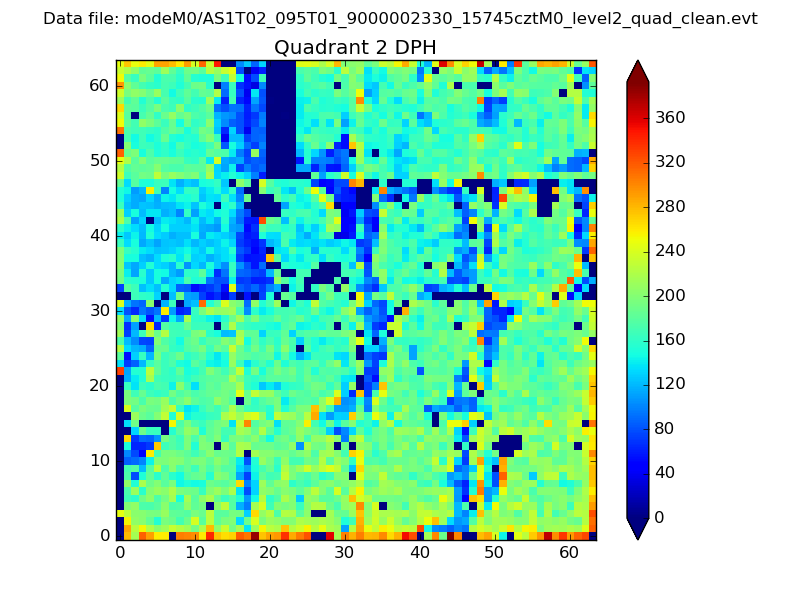 |
Quadrant C |
| Plot type | Count rate plots | Images |
|---|---|---|
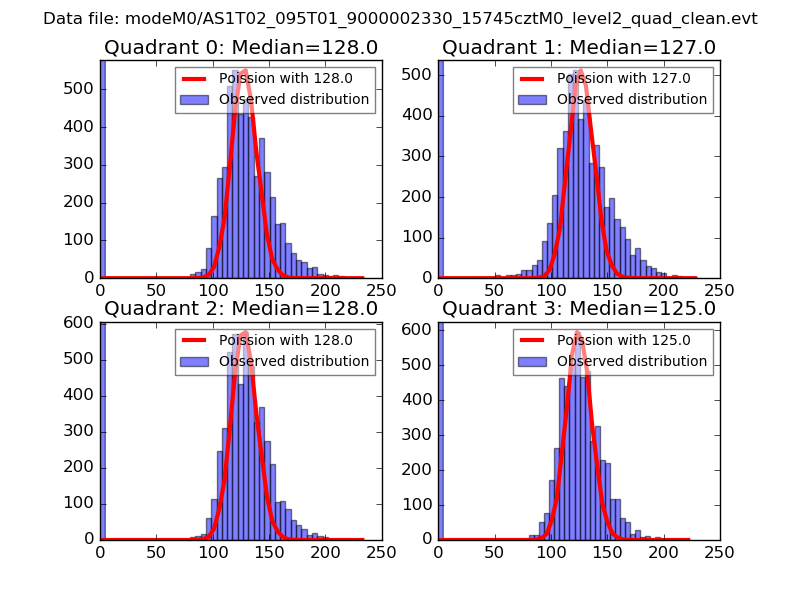
| Comparison with Poisson distribution Blue bars denote a histogram of data divided into 1 sec bins. Red curve is a Poisson curve with rate = median count rate of data. |
 |
 |
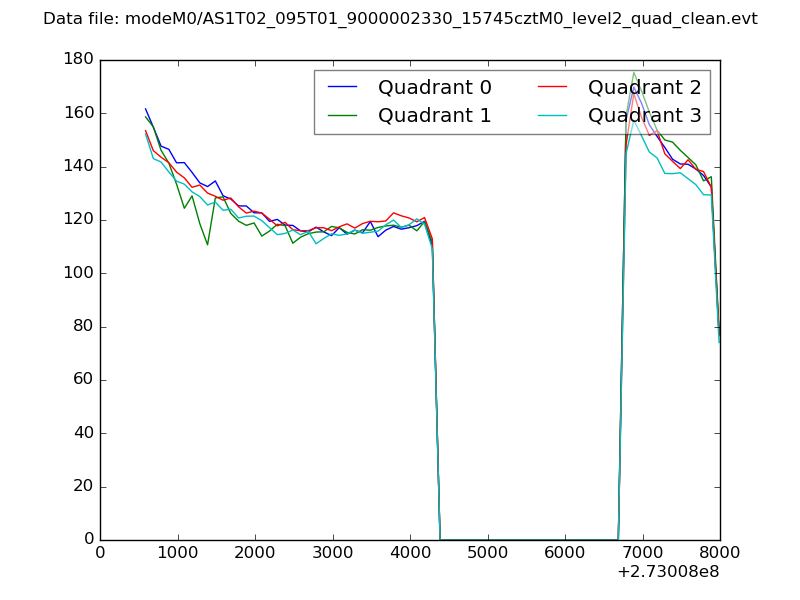
| Quadrant-wise count rates Data is divided into 100 sec bins |
 |
|
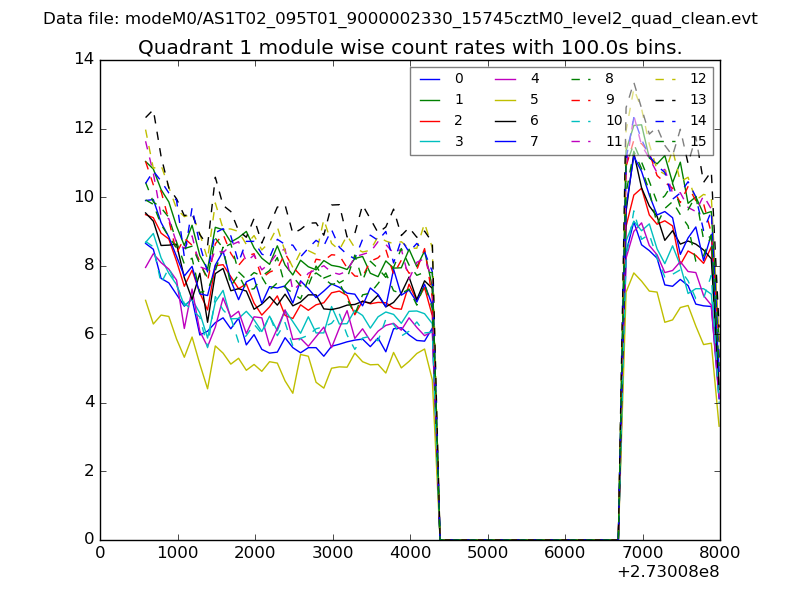
| Module-wise count rates for Quadrant A Data is divided into 100 sec bins |
 |
 |
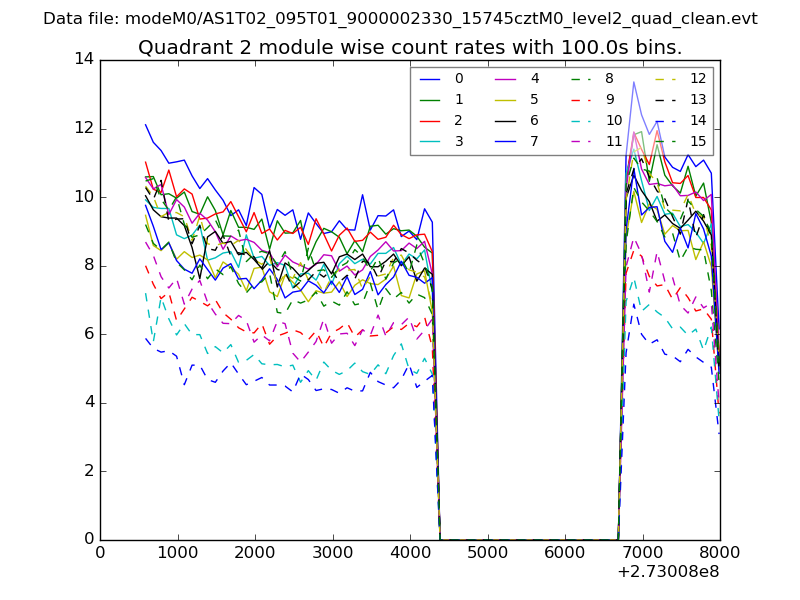
| Module-wise count rates for Quadrant B Data is divided into 100 sec bins |
 |
 |
| Module-wise count rates for Quadrant C Data is divided into 100 sec bins |
 |
 |
| Module-wise count rates for Quadrant D Data is divided into 100 sec bins |
 |
 |
| Parameter | Plot |
|---|---|
| CZT HV Monitor | 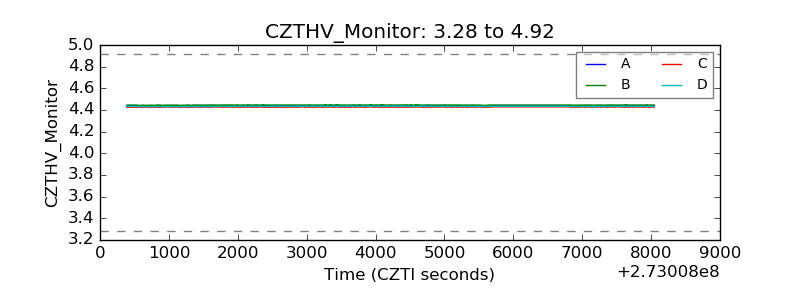 |
| D_VDD | 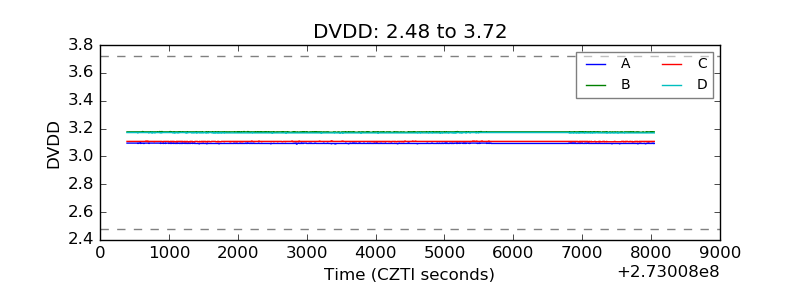 |
| Temperature 1 | 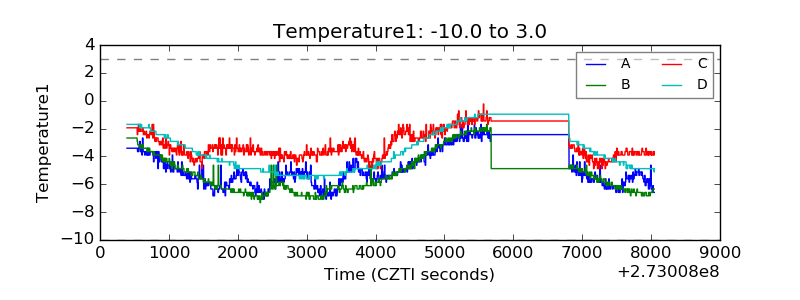 |
| Veto HV Monitor | 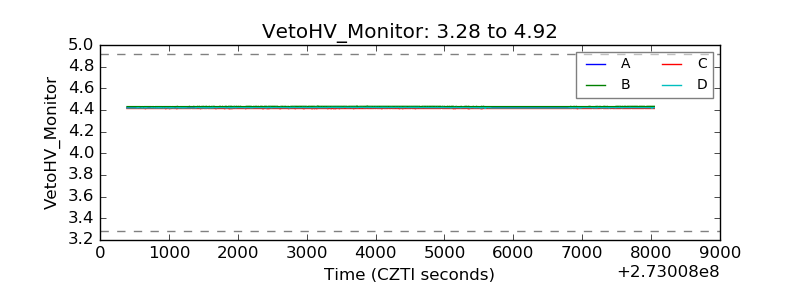 |
| Veto LLD | 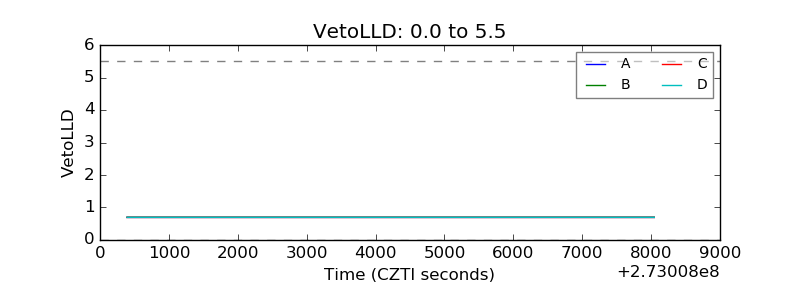 |
| Alpha Counter | 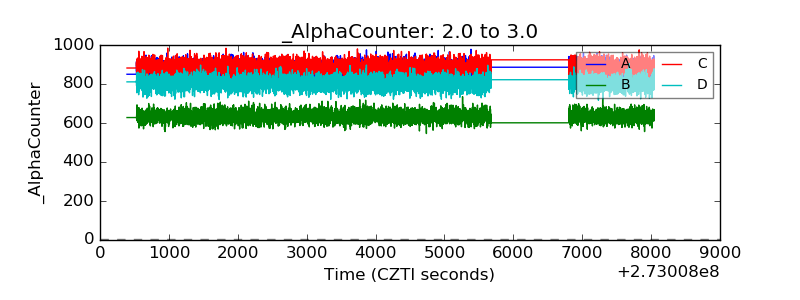 |
| _CPM_Rate | 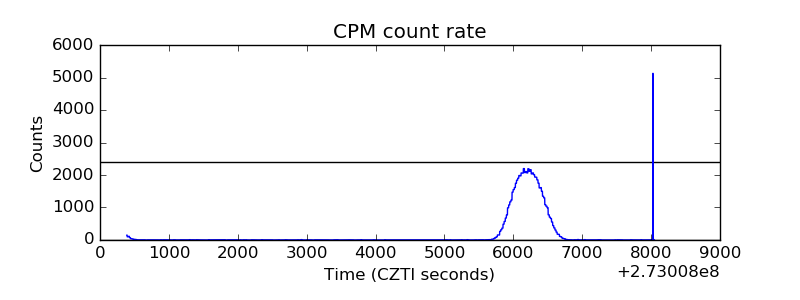 |
| CZT Counter | 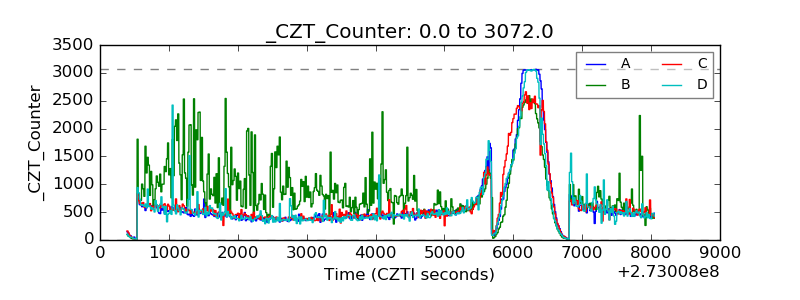 |
| +2.5 Volts monitor |  |
| +5 Volts monitor |  |
| _ROLL_ROT | 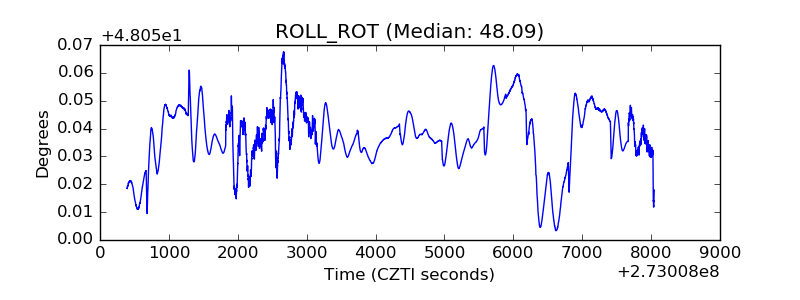 |
| _Roll_DEC | 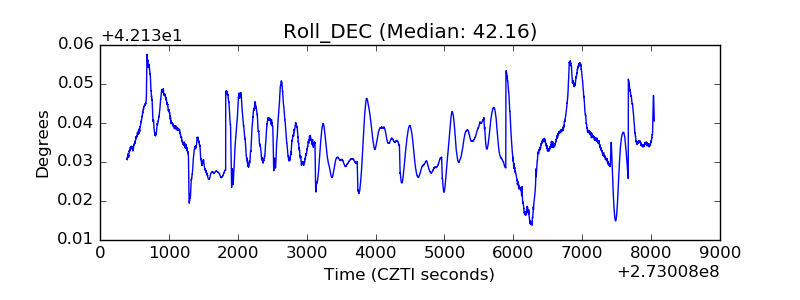 |
| _Roll_RA | 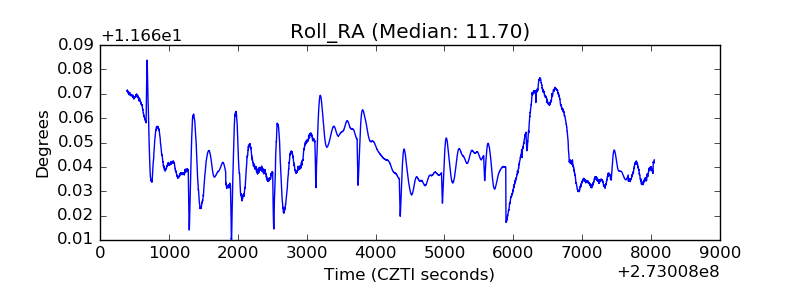 |
| Veto Counter | 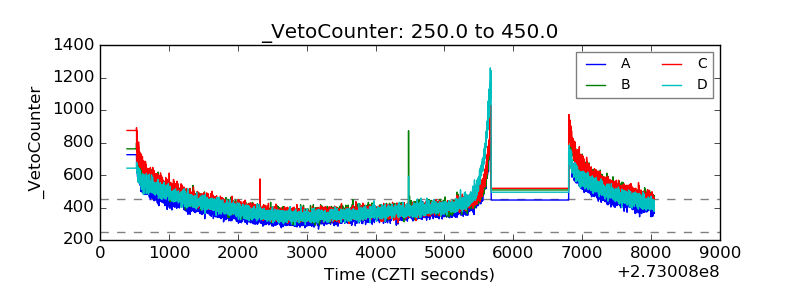 |