| Param | Original file | Final file |
|---|---|---|
| Filename | modeM0/AS1T02_095T01_9000002330_15746cztM0_level2.evt | modeM0/AS1T02_095T01_9000002330_15746cztM0_level2_quad_clean.evt |
| Size (bytes) | 181,938,240 | 39,977,280 |
| Size | 173.5 MB | 38.1 MB |
| Events in quadrant A | 1,273,179 | 263,703 |
| Events in quadrant B | 1,441,263 | 268,645 |
| Events in quadrant C | 1,283,782 | 261,105 |
| Events in quadrant D | 1,353,716 | 251,319 |
| Mode SS | |||
|---|---|---|---|
| Quadrant | BADHDUFLAG | Total packets | Discarded packets |
| A | 0 | 46 | 0 |
| B | 0 | 46 | 0 |
| C | 0 | 46 | 0 |
| D | 0 | 46 | 0 |
| Mode M0 | |||
|---|---|---|---|
| Quadrant | BADHDUFLAG | Total packets | Discarded packets |
| A | 0 | 5367 | 1 |
| B | 0 | 5889 | 1 |
| C | 0 | 5324 | 1 |
| D | 0 | 5636 | 1 |
| Mode M9 | |||
|---|---|---|---|
| Quadrant | BADHDUFLAG | Total packets | Discarded packets |
| A | 0 | 12 | 0 |
| B | 0 | 12 | 0 |
| C | 0 | 12 | 0 |
| D | 0 | 12 | 0 |
| Quadrant | Total seconds | Saturated seconds | Saturation percentage |
|---|---|---|---|
| A | 2301 | 58 | 2.520643% |
| B | 2301 | 58 | 2.520643% |
| C | 2301 | 82 | 3.563668% |
| D | 2301 | 72 | 3.129074% |
Noise dominated data is calculated using 1-second bins in cleaned event files. If a bin has >2000 counts, and if more than 50% of those come from <1% of pixels, then it is considered to be noise-dominated and hence unusable.
| Quadrant | # 1 sec bins | Bins with >0 counts | Bins with >2000 counts | High rate bins dominated by noise | Noise dominated (total time) | Noise dominated (detector-on time) | Marked lightcurve |
|---|---|---|---|---|---|---|---|
| A | 3427 | 2303 | 0 | 0 | 0.00% | 0.00% | 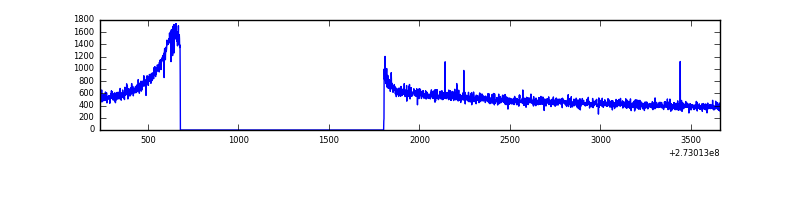 |
| B | 3427 | 2303 | 5 | 5 | 0.15% | 0.22% | 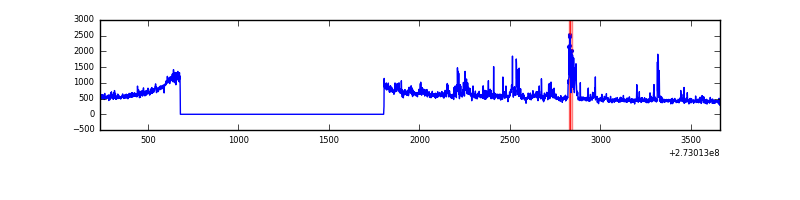 |
| C | 3427 | 2303 | 0 | 0 | 0.00% | 0.00% | 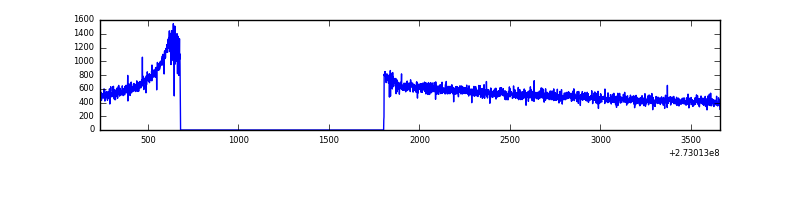 |
| D | 3427 | 2303 | 1 | 1 | 0.03% | 0.04% | 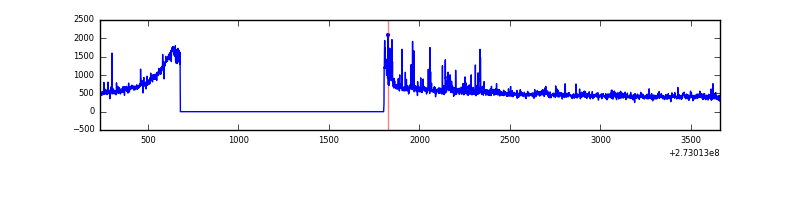 |
Top three noisy pixels from each quadrant. If the there are fewer than three noisy pixels in the level2.evt file, extra rows are filled as -1
| Pixel properties | Quadrant properties | ||||||
|---|---|---|---|---|---|---|---|
| Quadrant | DetID | PixID | Counts | Sigma | Mean | Median | Sigma |
| A | 4 | 2 | 4719 | 63.48 | 329 | 324 | 69.2 |
| A | 0 | 226 | 2849 | 36.47 | 329 | 324 | 69.2 |
| A | 12 | 194 | 2531 | 31.88 | 329 | 324 | 69.2 |
| B | 4 | 251 | 165055 | 2654.5 | 318 | 311 | 62.1 |
| B | 4 | 216 | 10929 | 171.09 | 318 | 311 | 62.1 |
| B | 12 | 111 | 6507 | 99.84 | 318 | 311 | 62.1 |
| C | 14 | 238 | 48038 | 616.71 | 315 | 318 | 77.4 |
| C | 3 | 233 | 4507 | 54.14 | 315 | 318 | 77.4 |
| C | 13 | 61 | 2194 | 24.24 | 315 | 318 | 77.4 |
| D | 1 | 52 | 94976 | 1137.51 | 330 | 321 | 83.2 |
| D | 2 | 234 | 9011 | 104.43 | 330 | 321 | 83.2 |
| D | 10 | 70 | 4939 | 55.5 | 330 | 321 | 83.2 |
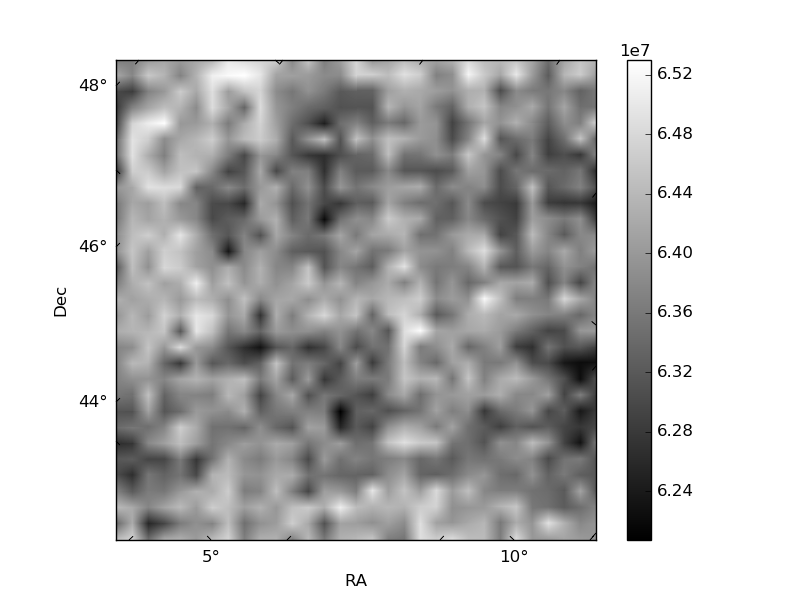
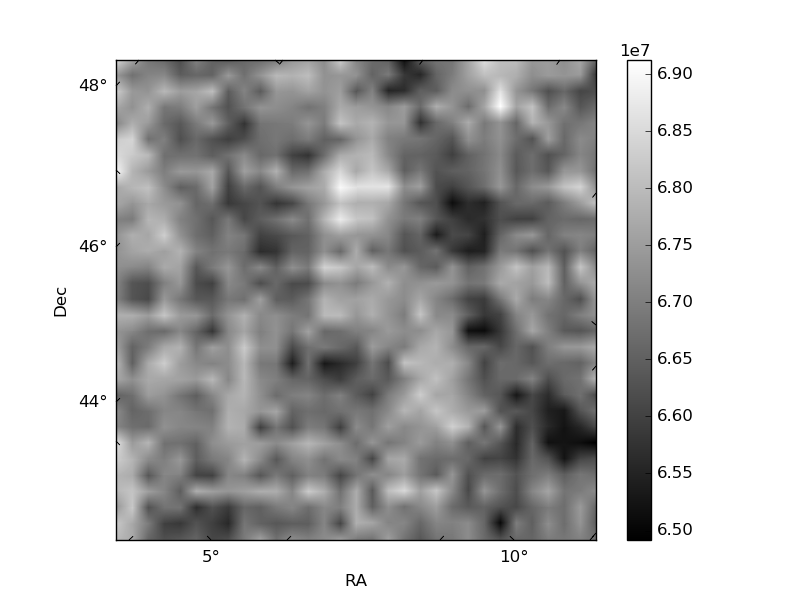
Histogram calculated using DETX and DETY for each event in the final _common_clean file
| Quadrant A | 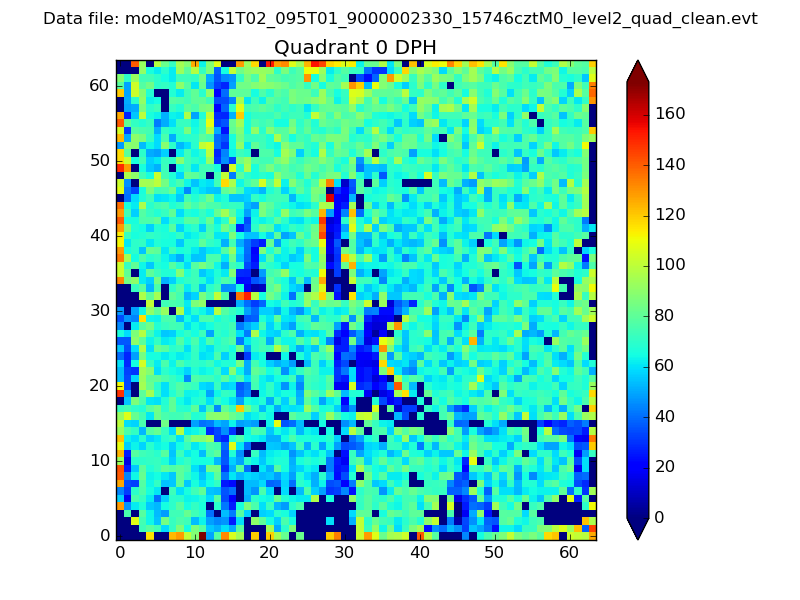 |
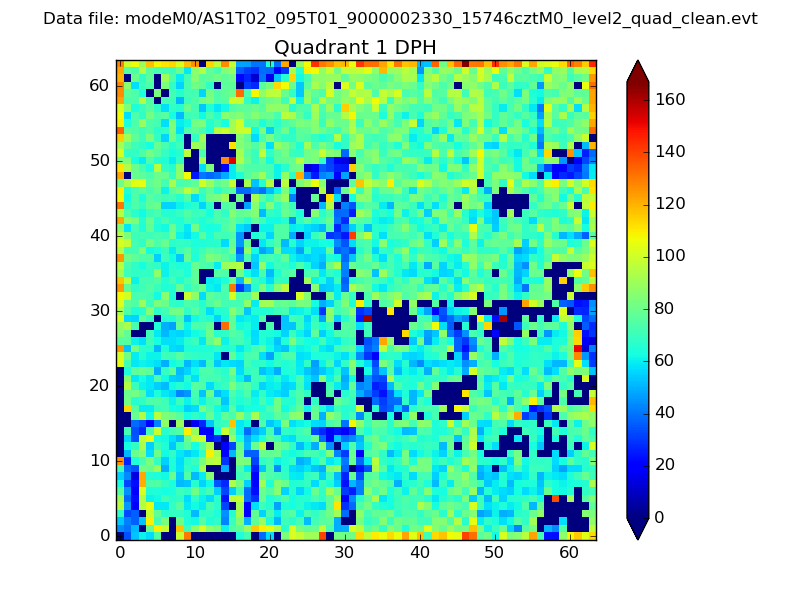 |
Quadrant B |
|---|---|---|---|
| Quadrant D | 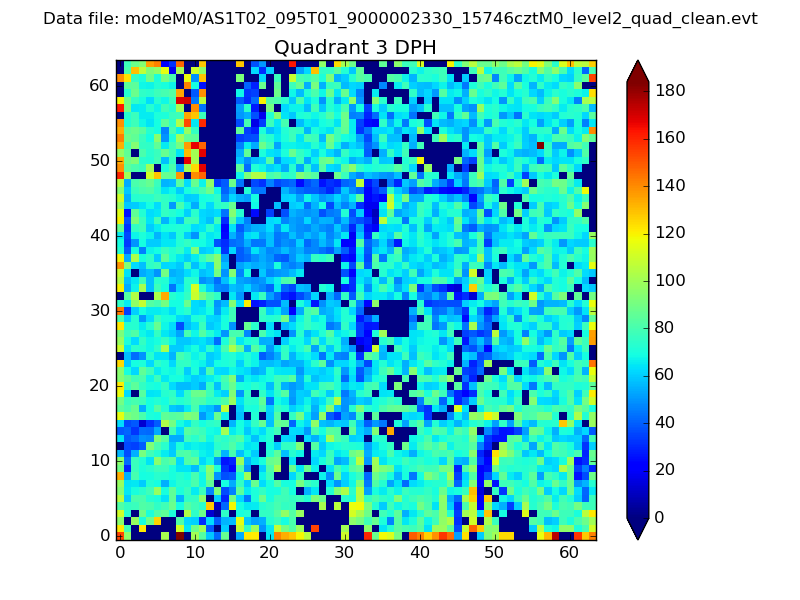 |
 |
Quadrant C |
| Plot type | Count rate plots | Images |
|---|---|---|
| Comparison with Poisson distribution Blue bars denote a histogram of data divided into 1 sec bins. Red curve is a Poisson curve with rate = median count rate of data. |
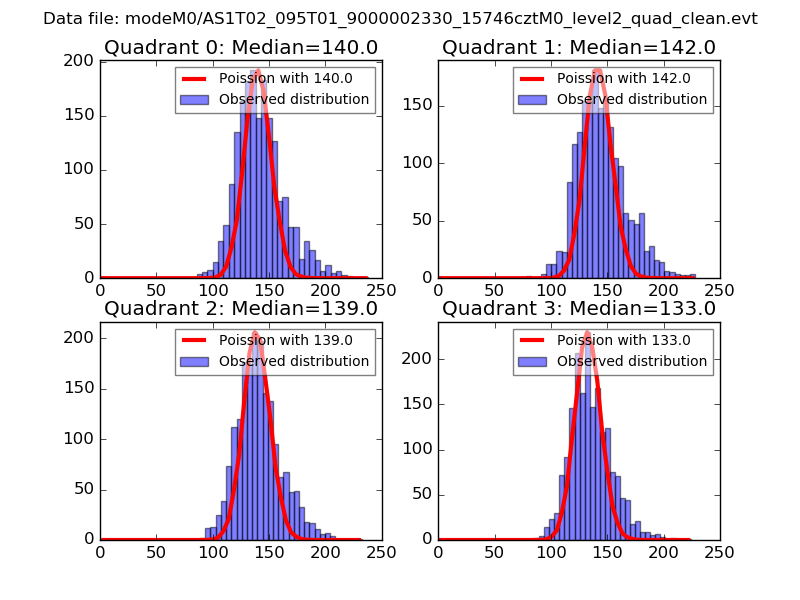 |
 |
| Quadrant-wise count rates Data is divided into 100 sec bins |
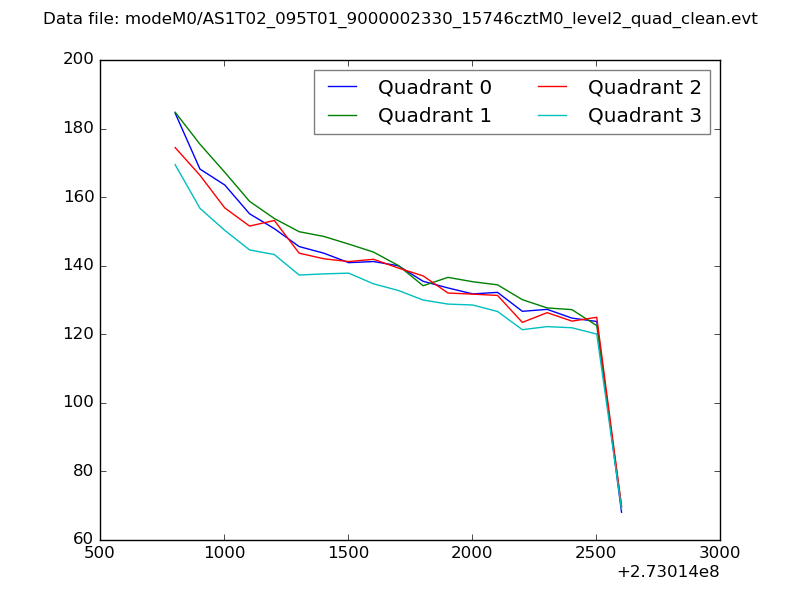 |
|
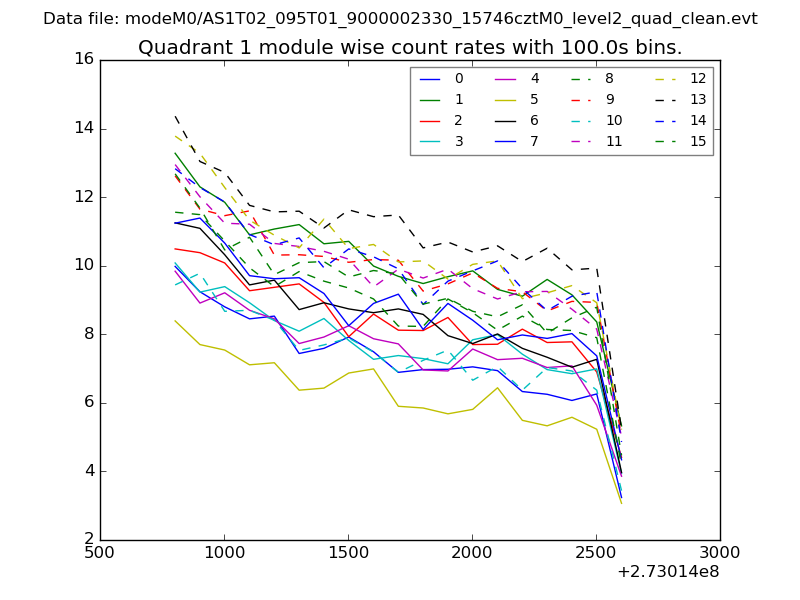
| Module-wise count rates for Quadrant A Data is divided into 100 sec bins |
 |
 |
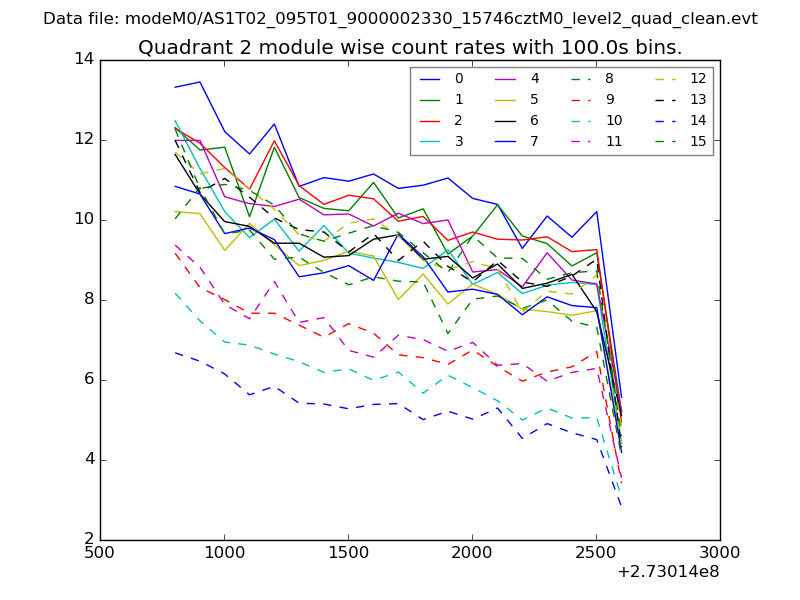
| Module-wise count rates for Quadrant B Data is divided into 100 sec bins |
 |
 |
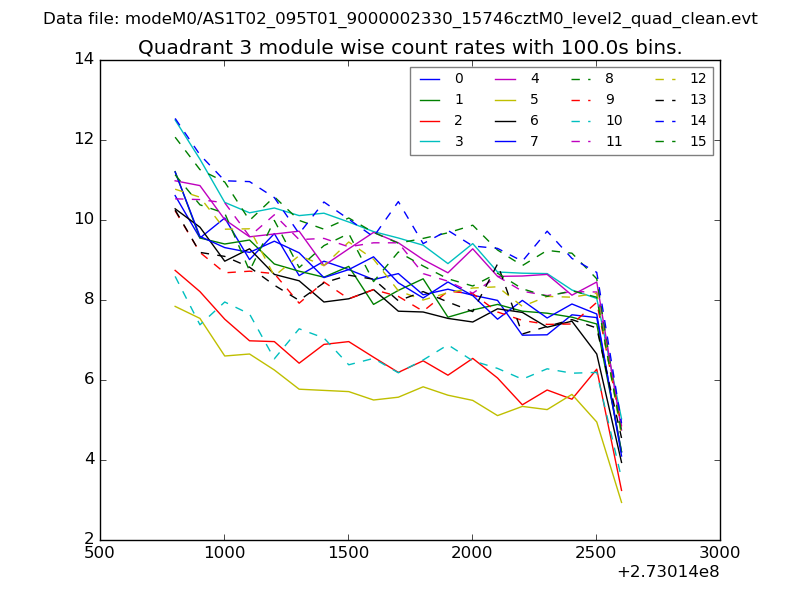
| Module-wise count rates for Quadrant C Data is divided into 100 sec bins |
 |
 |
| Module-wise count rates for Quadrant D Data is divided into 100 sec bins |
 |
 |
| Parameter | Plot |
|---|---|
| CZT HV Monitor | 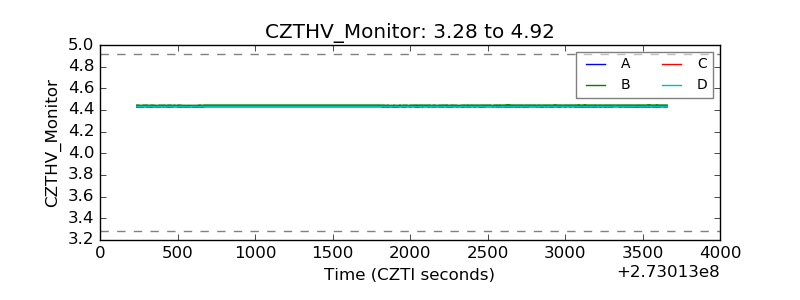 |
| D_VDD | 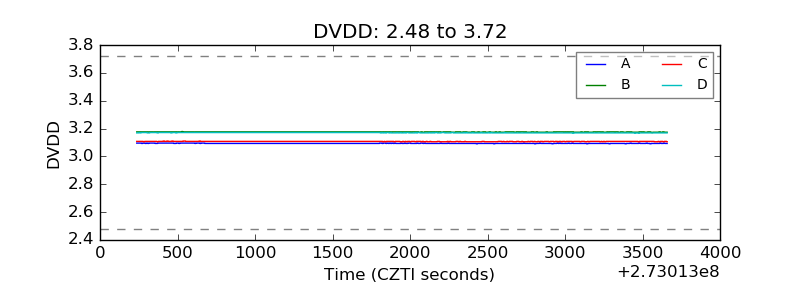 |
| Temperature 1 | 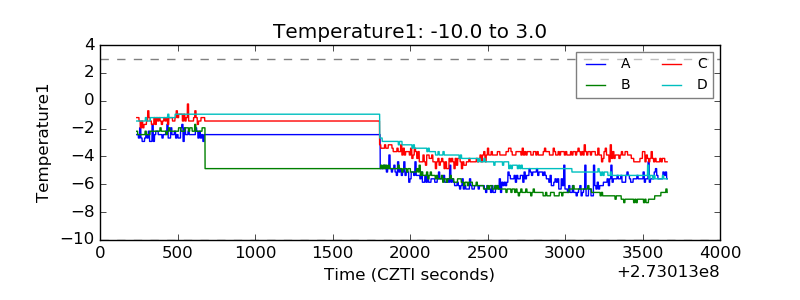 |
| Veto HV Monitor | 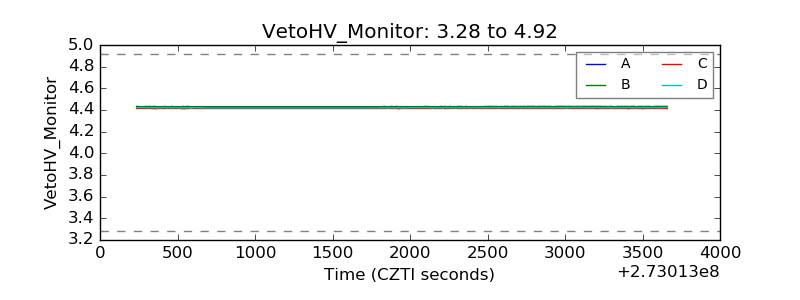 |
| Veto LLD | 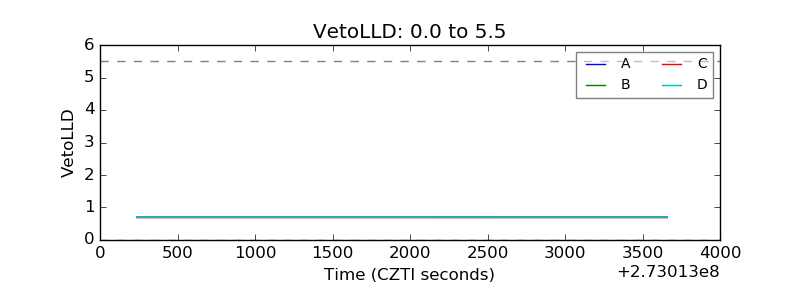 |
| Alpha Counter | 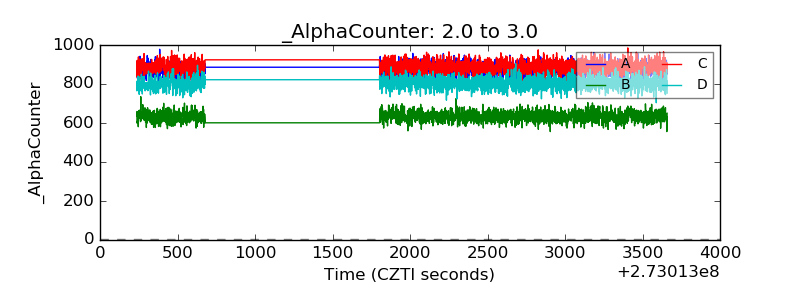 |
| _CPM_Rate | 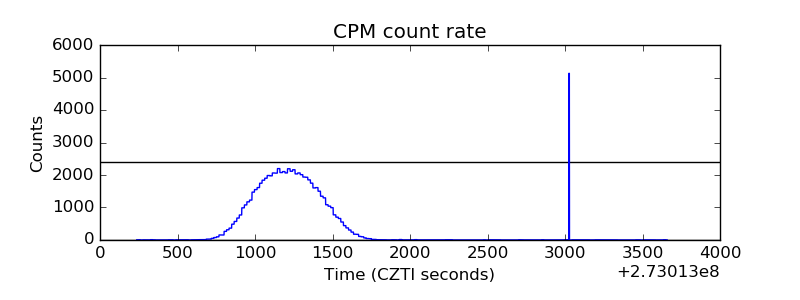 |
| CZT Counter |  |
| +2.5 Volts monitor |  |
| +5 Volts monitor | 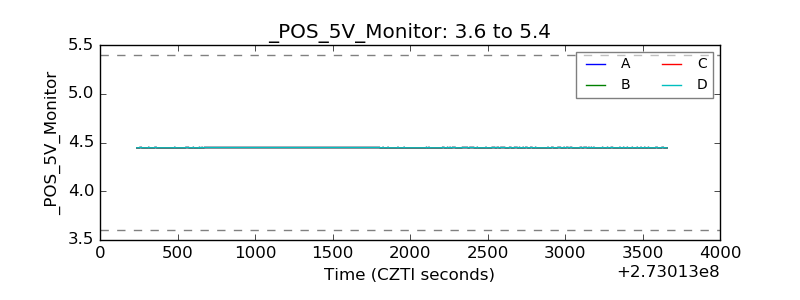 |
| _ROLL_ROT | 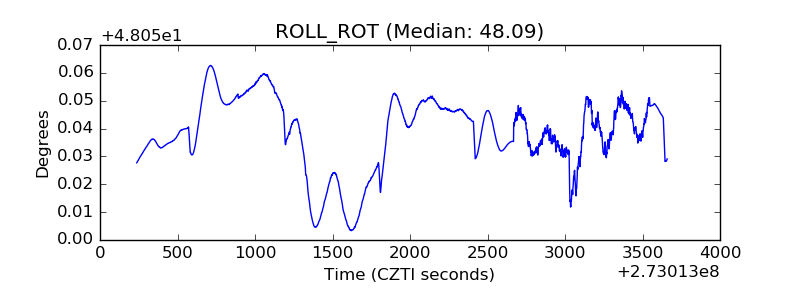 |
| _Roll_DEC | 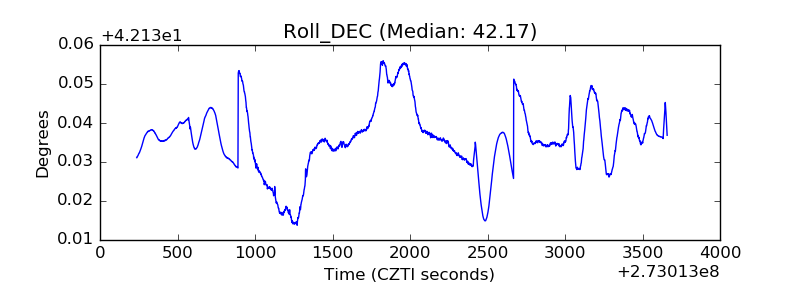 |
| _Roll_RA |  |
| Veto Counter | 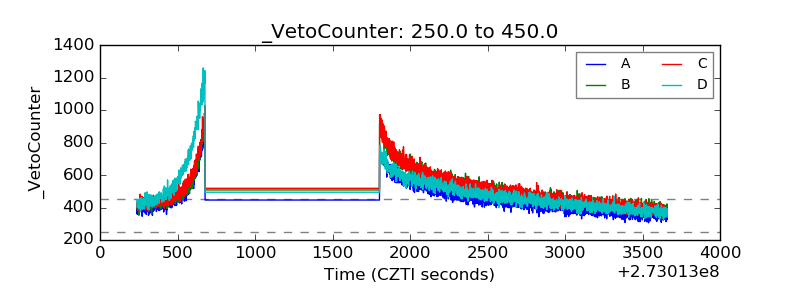 |