| Param | Original file | Final file |
|---|---|---|
| Filename | modeM0/AS1T02_088T01_9000002332cztM0_level2.fits | modeM0/AS1T02_088T01_9000002332cztM0_level2_quad_clean.evt |
| Size (bytes) | 789,528,960 | 703,615,680 |
| Size | 753.0 MB | 671.0 MB |
| Events in quadrant A | 4,801,084 | 4,076,250 |
| Events in quadrant B | 4,638,058 | 4,101,428 |
| Events in quadrant C | 4,736,630 | 3,924,742 |
| Events in quadrant D | 4,122,614 | 3,593,769 |
| Mode M9 | |||
|---|---|---|---|
| Quadrant | BADHDUFLAG | Total packets | Discarded packets |
| A | 0 | 130 | 0 |
| B | 0 | 130 | 0 |
| C | 0 | 130 | 0 |
| D | 0 | 130 | 0 |
| Mode SS | |||
|---|---|---|---|
| Quadrant | BADHDUFLAG | Total packets | Discarded packets |
| A | 0 | 1670 | 0 |
| B | 0 | 1670 | 0 |
| C | 0 | 1670 | 0 |
| D | 0 | 1670 | 0 |
| Mode M0 | |||
|---|---|---|---|
| Quadrant | BADHDUFLAG | Total packets | Discarded packets |
| A | 0 | 172068 | 0 |
| B | 0 | 174976 | 0 |
| C | 0 | 170549 | 0 |
| D | 0 | 172141 | 0 |
| Quadrant | Total seconds | Saturated seconds | Saturation percentage |
|---|---|---|---|
| A | 81854 | 1263 | 1.542991% |
| B | 81854 | 1297 | 1.584529% |
| C | 81854 | 1437 | 1.755565% |
| D | 81854 | 1006 | 1.229018% |
Noise dominated data is calculated using 1-second bins in cleaned event files. If a bin has >2000 counts, and if more than 50% of those come from <1% of pixels, then it is considered to be noise-dominated and hence unusable.
| Quadrant | # 1 sec bins | Bins with >0 counts | Bins with >2000 counts | High rate bins dominated by noise | Noise dominated (total time) | Noise dominated (detector-on time) | Marked lightcurve |
|---|---|---|---|---|---|---|---|
| A | 95079 | 81847 | 0 | 0 | 0.00% | 0.00% |  |
| B | 95079 | 81852 | 0 | 0 | 0.00% | 0.00% | 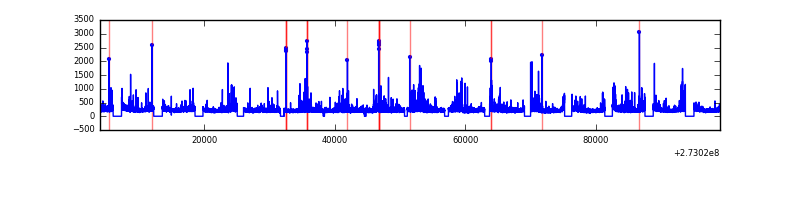 |
| C | 95079 | 81852 | 0 | 0 | 0.00% | 0.00% |  |
| D | 95079 | 81843 | 0 | 0 | 0.00% | 0.00% |  |
Top three noisy pixels from each quadrant. If the there are fewer than three noisy pixels in the level2.evt file, extra rows are filled as -1
| Pixel properties | Quadrant properties | ||||||
|---|---|---|---|---|---|---|---|
| Quadrant | DetID | PixID | Counts | Sigma | Mean | Median | Sigma |
| A | 0 | 29 | 4693 | 11.37 | 1250 | 1167 | 310.1 |
| A | 7 | 110 | 3745 | 8.31 | 1250 | 1167 | 310.1 |
| A | 0 | 30 | 3560 | 7.72 | 1250 | 1167 | 310.1 |
| B | 2 | 9 | 3839 | 11.0 | 1229 | 1172 | 242.4 |
| B | 2 | 8 | 3268 | 8.65 | 1229 | 1172 | 242.4 |
| B | 3 | 17 | 3110 | 7.99 | 1229 | 1172 | 242.4 |
| C | 12 | 241 | 3358 | 6.67 | 1253 | 1162 | 329.1 |
| C | 9 | 233 | 3215 | 6.24 | 1253 | 1162 | 329.1 |
| C | 3 | 158 | 3210 | 6.22 | 1253 | 1162 | 329.1 |
| D | 3 | 14 | 3134 | 6.6 | 1175 | 1065 | 313.3 |
| D | 6 | 231 | 3020 | 6.24 | 1175 | 1065 | 313.3 |
| D | 7 | 3 | 2862 | 5.74 | 1175 | 1065 | 313.3 |
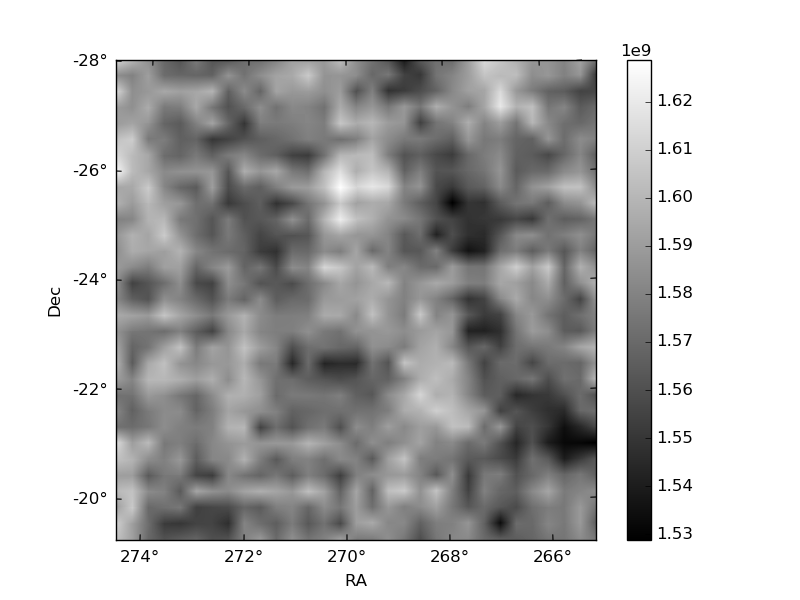
Histogram calculated using DETX and DETY for each event in the final _common_clean file
| Quadrant A |  |
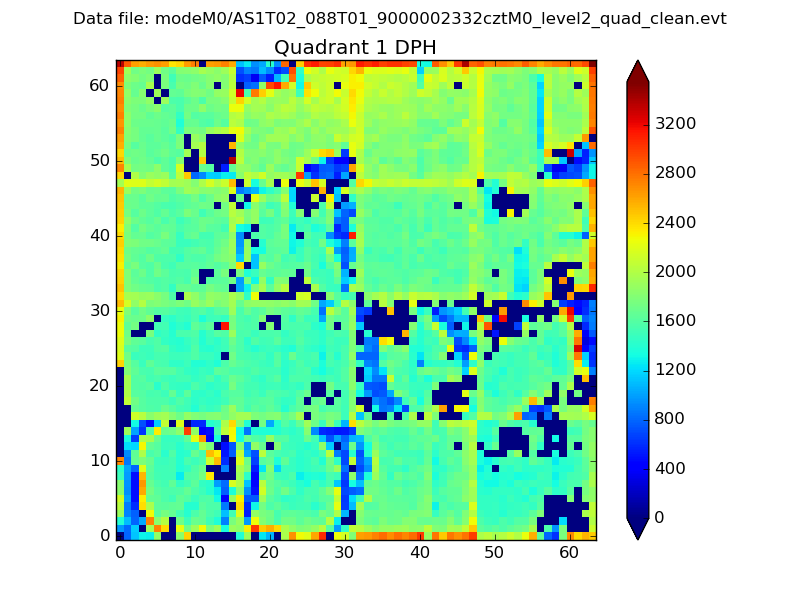 |
Quadrant B |
|---|---|---|---|
| Quadrant D | 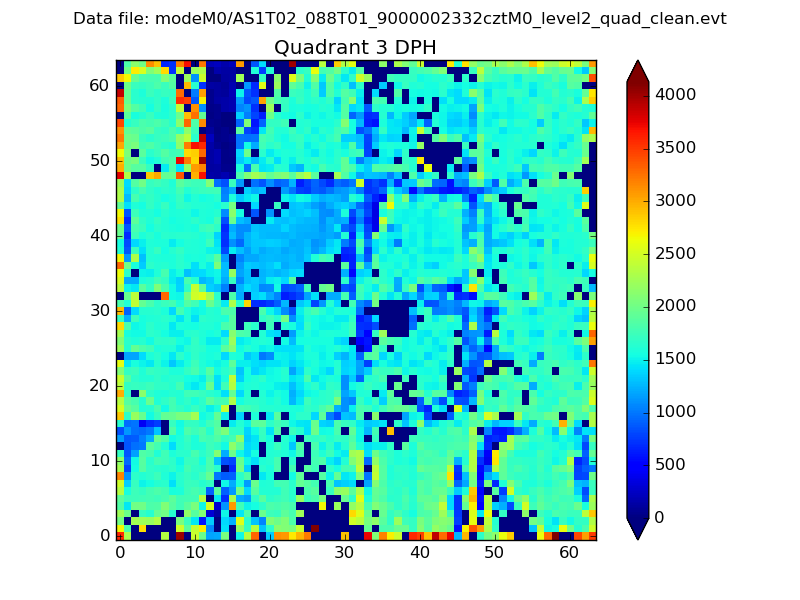 |
 |
Quadrant C |
| Plot type | Count rate plots | Images |
|---|---|---|
| Comparison with Poisson distribution Blue bars denote a histogram of data divided into 1 sec bins. Red curve is a Poisson curve with rate = median count rate of data. |
 |
 |
| Quadrant-wise count rates Data is divided into 100 sec bins |
 |
|
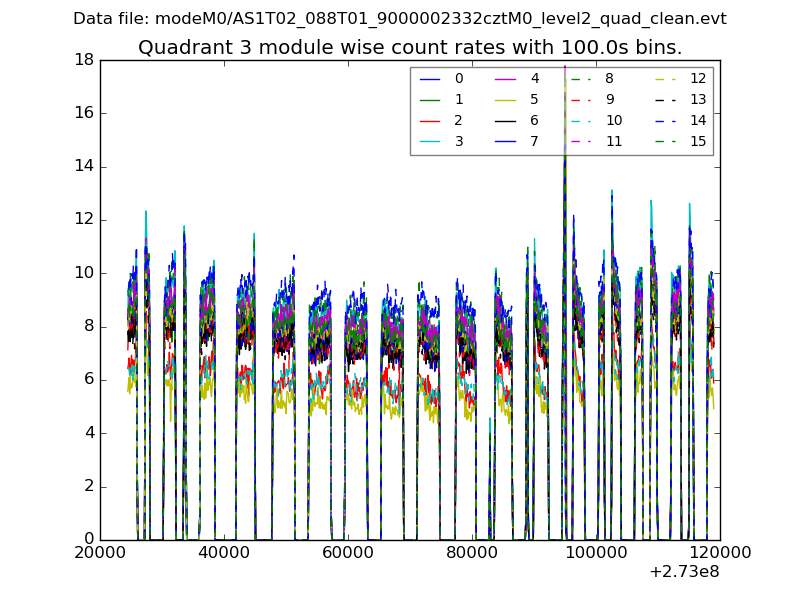
| Module-wise count rates for Quadrant A Data is divided into 100 sec bins |
 |
 |
| Module-wise count rates for Quadrant B Data is divided into 100 sec bins |
 |
 |
| Module-wise count rates for Quadrant C Data is divided into 100 sec bins |
 |
 |
| Module-wise count rates for Quadrant D Data is divided into 100 sec bins |
 |
 |
| Parameter | Plot |
|---|---|
| CZT HV Monitor |  |
| D_VDD |  |
| Temperature 1 |  |
| Veto HV Monitor |  |
| Veto LLD | 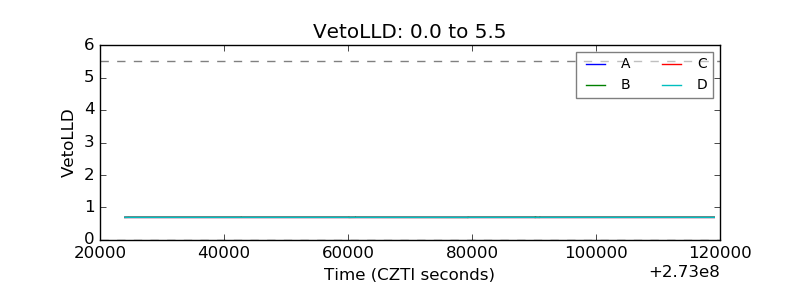 |
| Alpha Counter |  |
| _CPM_Rate |  |
| CZT Counter |  |
| +2.5 Volts monitor |  |
| +5 Volts monitor |  |
| _ROLL_ROT |  |
| _Roll_DEC |  |
| _Roll_RA |  |
| Veto Counter |  |