| Param | Original file | Final file |
|---|---|---|
| Filename | modeM0/AS1T02_088T01_9000002332_15747cztM0_level2.evt | modeM0/AS1T02_088T01_9000002332_15747cztM0_level2_quad_clean.evt |
| Size (bytes) | 241,453,440 | 52,090,560 |
| Size | 230.3 MB | 49.7 MB |
| Events in quadrant A | 1,711,782 | 338,875 |
| Events in quadrant B | 1,887,816 | 348,407 |
| Events in quadrant C | 1,802,379 | 333,039 |
| Events in quadrant D | 1,682,438 | 320,384 |
| Mode M9 | |||
|---|---|---|---|
| Quadrant | BADHDUFLAG | Total packets | Discarded packets |
| A | 0 | 13 | 0 |
| B | 0 | 13 | 0 |
| C | 0 | 13 | 0 |
| D | 0 | 13 | 0 |
| Mode SS | |||
|---|---|---|---|
| Quadrant | BADHDUFLAG | Total packets | Discarded packets |
| A | 0 | 68 | 0 |
| B | 0 | 68 | 0 |
| C | 0 | 68 | 0 |
| D | 0 | 68 | 0 |
| Mode M0 | |||
|---|---|---|---|
| Quadrant | BADHDUFLAG | Total packets | Discarded packets |
| A | 0 | 6978 | 2 |
| B | 0 | 7552 | 1 |
| C | 0 | 7294 | 1 |
| D | 0 | 7011 | 1 |
| Quadrant | Total seconds | Saturated seconds | Saturation percentage |
|---|---|---|---|
| A | 3333 | 13 | 0.390039% |
| B | 3333 | 35 | 1.050105% |
| C | 3333 | 37 | 1.110111% |
| D | 3333 | 12 | 0.360036% |
Noise dominated data is calculated using 1-second bins in cleaned event files. If a bin has >2000 counts, and if more than 50% of those come from <1% of pixels, then it is considered to be noise-dominated and hence unusable.
| Quadrant | # 1 sec bins | Bins with >0 counts | Bins with >2000 counts | High rate bins dominated by noise | Noise dominated (total time) | Noise dominated (detector-on time) | Marked lightcurve |
|---|---|---|---|---|---|---|---|
| A | 4614 | 3335 | 0 | 0 | 0.00% | 0.00% | 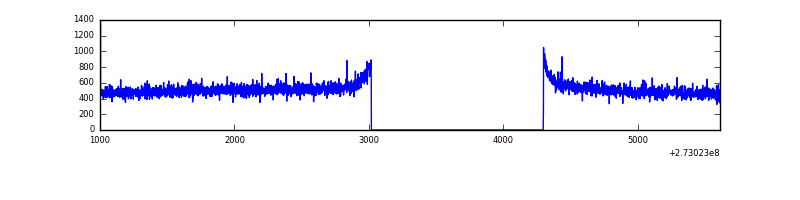 |
| B | 4614 | 3335 | 2 | 2 | 0.04% | 0.06% | 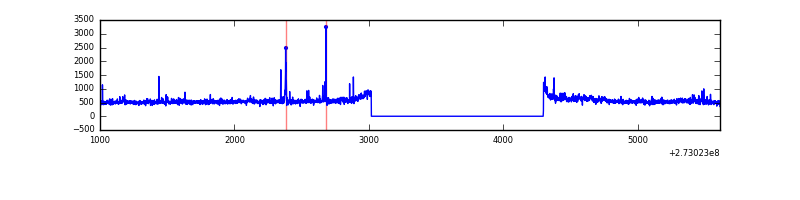 |
| C | 4614 | 3335 | 0 | 0 | 0.00% | 0.00% | 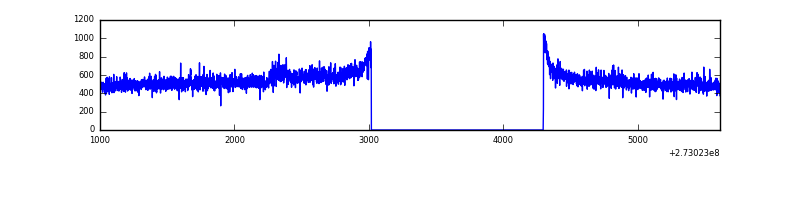 |
| D | 4614 | 3335 | 1 | 1 | 0.02% | 0.03% | 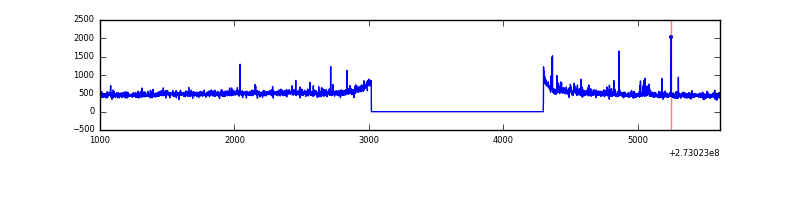 |
Top three noisy pixels from each quadrant. If the there are fewer than three noisy pixels in the level2.evt file, extra rows are filled as -1
| Pixel properties | Quadrant properties | ||||||
|---|---|---|---|---|---|---|---|
| Quadrant | DetID | PixID | Counts | Sigma | Mean | Median | Sigma |
| A | 0 | 226 | 4012 | 40.08 | 442 | 434 | 89.3 |
| A | 12 | 194 | 3283 | 31.91 | 442 | 434 | 89.3 |
| A | 3 | 1 | 3161 | 30.55 | 442 | 434 | 89.3 |
| B | 4 | 251 | 58849 | 672.06 | 446 | 436 | 86.9 |
| B | 3 | 209 | 21995 | 248.04 | 446 | 436 | 86.9 |
| B | 5 | 236 | 14023 | 156.32 | 446 | 436 | 86.9 |
| C | 14 | 238 | 65549 | 652.04 | 426 | 430 | 99.9 |
| C | 3 | 233 | 64720 | 643.74 | 426 | 430 | 99.9 |
| C | 7 | 247 | 10190 | 97.73 | 426 | 430 | 99.9 |
| D | 1 | 52 | 37200 | 346.31 | 428 | 414 | 106.2 |
| D | 2 | 234 | 13319 | 121.49 | 428 | 414 | 106.2 |
| D | 5 | 51 | 9426 | 84.84 | 428 | 414 | 106.2 |
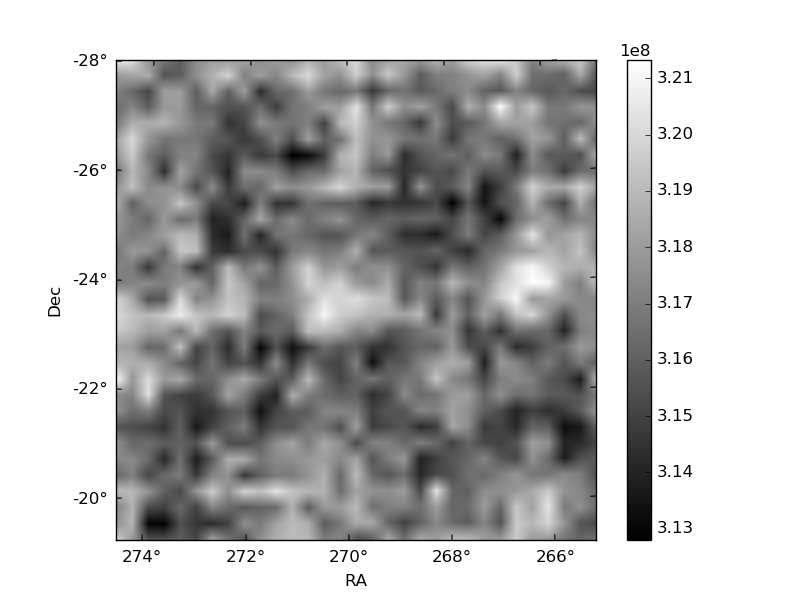
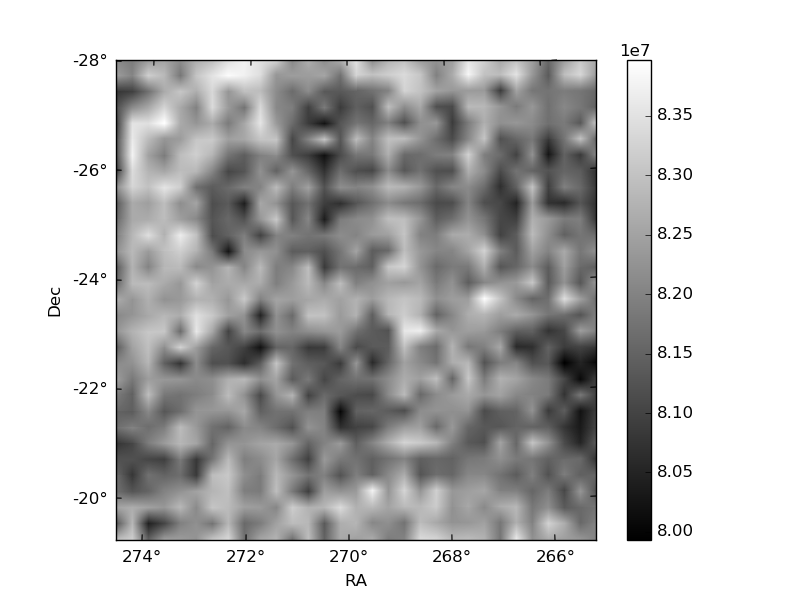
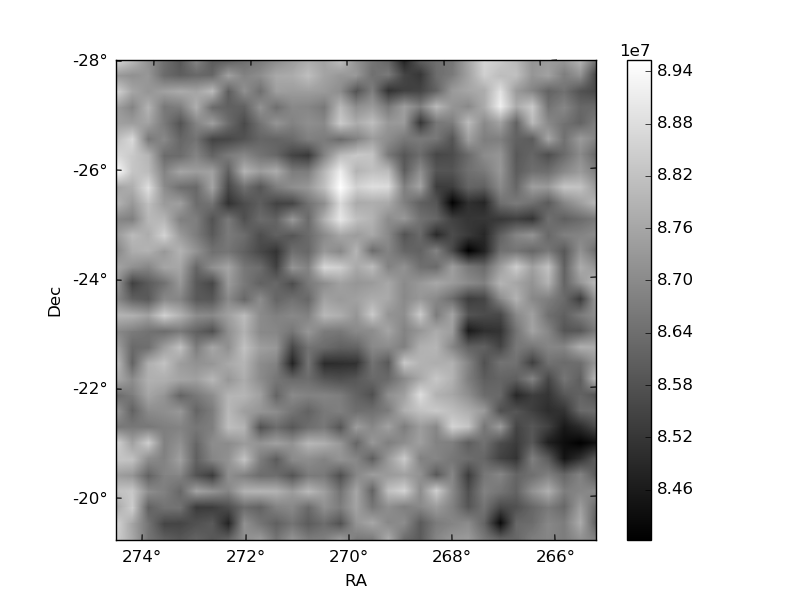
Histogram calculated using DETX and DETY for each event in the final _common_clean file
| Quadrant A | 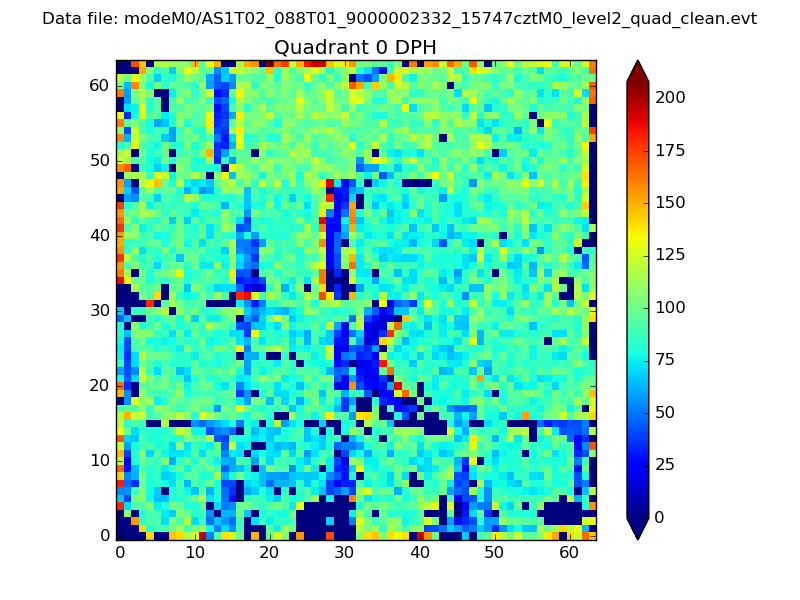 |
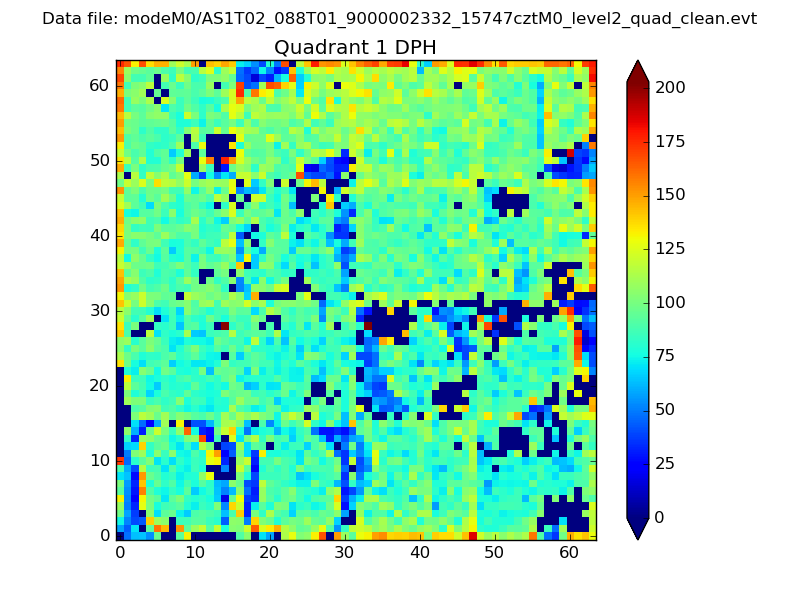 |
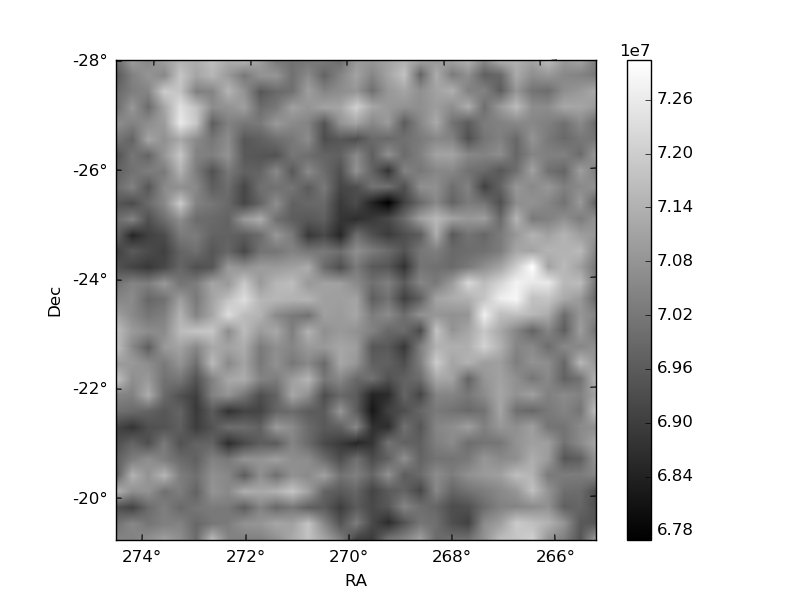
Quadrant B |
|---|---|---|---|
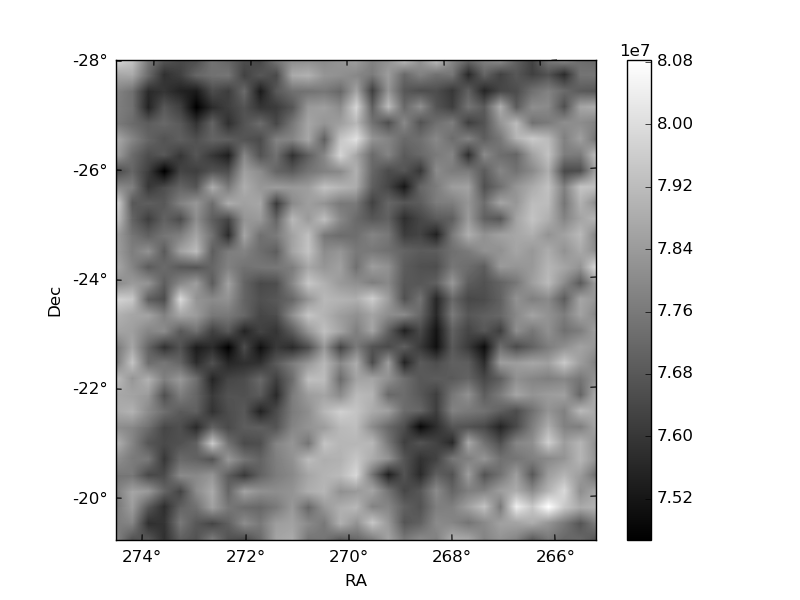
| Quadrant D | 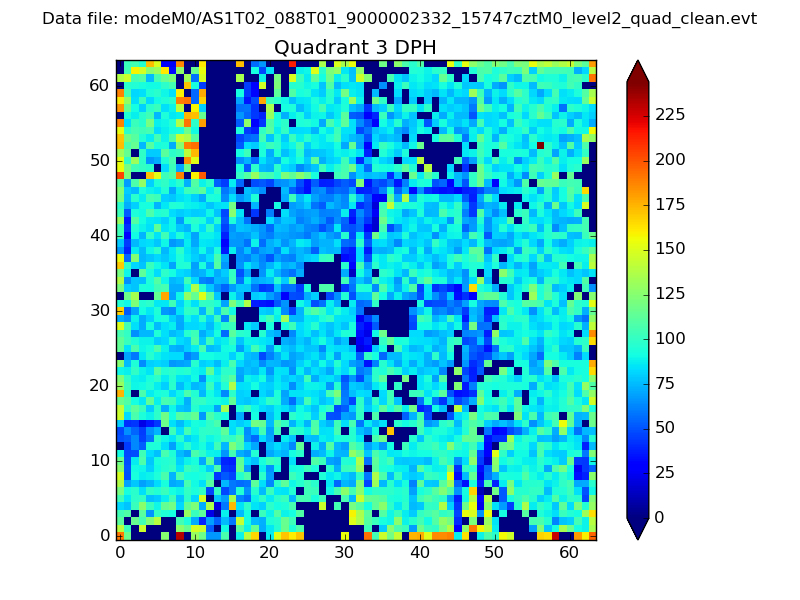 |
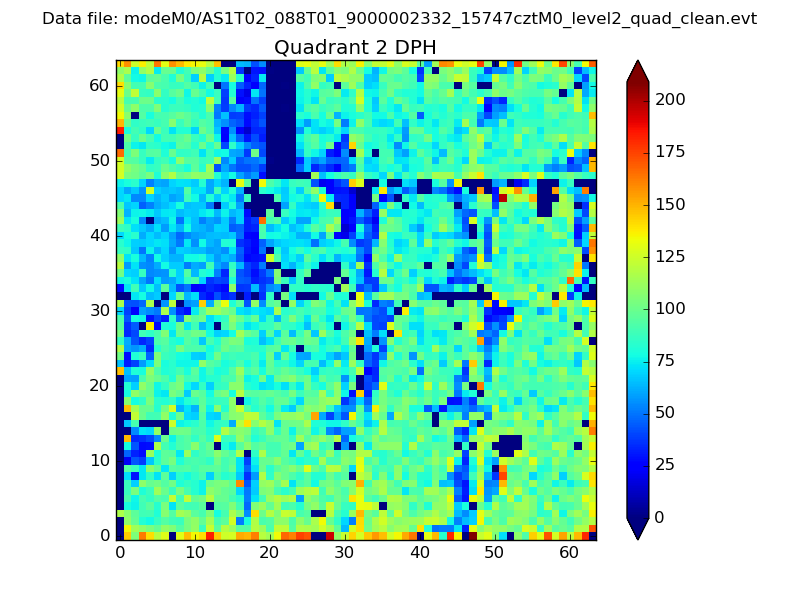 |
Quadrant C |
| Plot type | Count rate plots | Images |
|---|---|---|
| Comparison with Poisson distribution Blue bars denote a histogram of data divided into 1 sec bins. Red curve is a Poisson curve with rate = median count rate of data. |
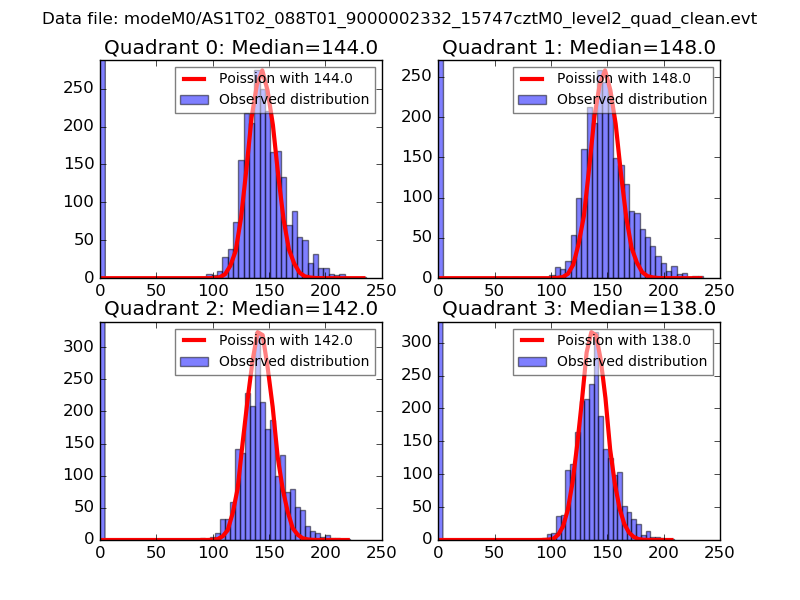 |
 |
| Quadrant-wise count rates Data is divided into 100 sec bins |
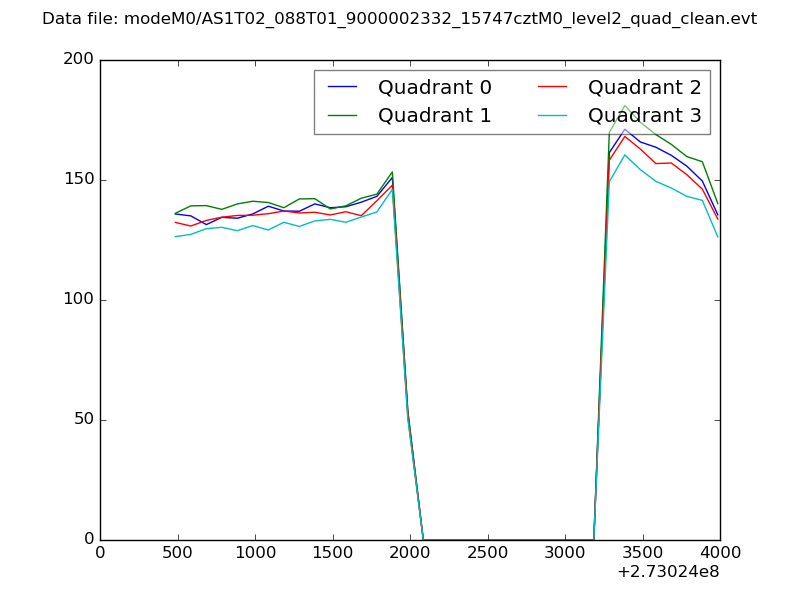 |
|
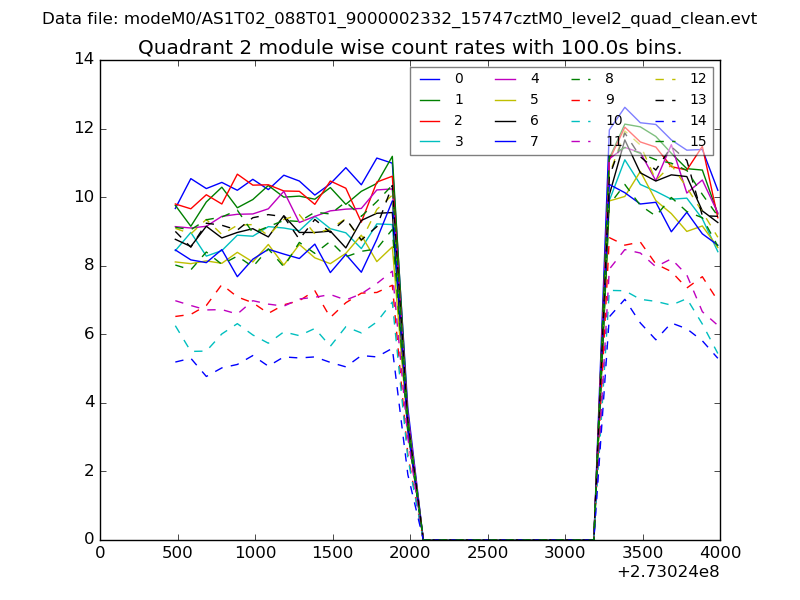
| Module-wise count rates for Quadrant A Data is divided into 100 sec bins |
 |
 |
| Module-wise count rates for Quadrant B Data is divided into 100 sec bins |
 |
 |
| Module-wise count rates for Quadrant C Data is divided into 100 sec bins |
 |
 |
| Module-wise count rates for Quadrant D Data is divided into 100 sec bins |
 |
 |
| Parameter | Plot |
|---|---|
| CZT HV Monitor | 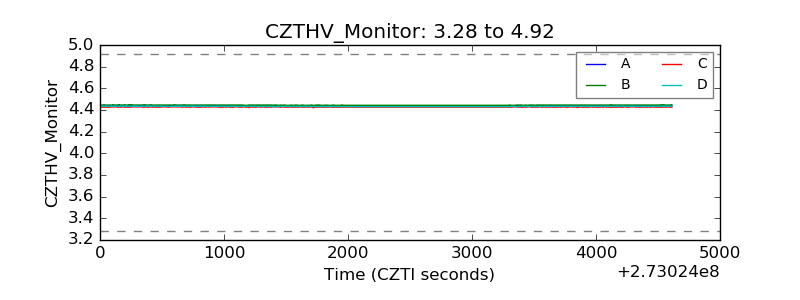 |
| D_VDD |  |
| Temperature 1 | 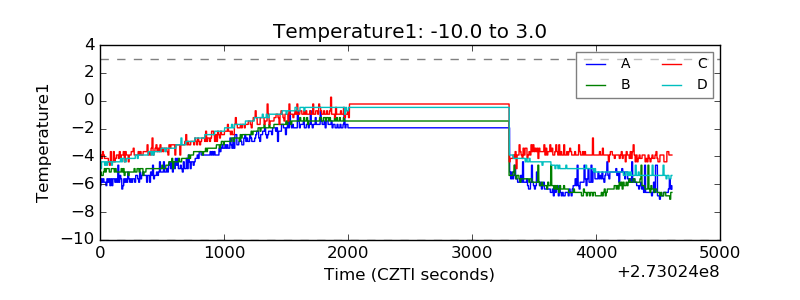 |
| Veto HV Monitor | 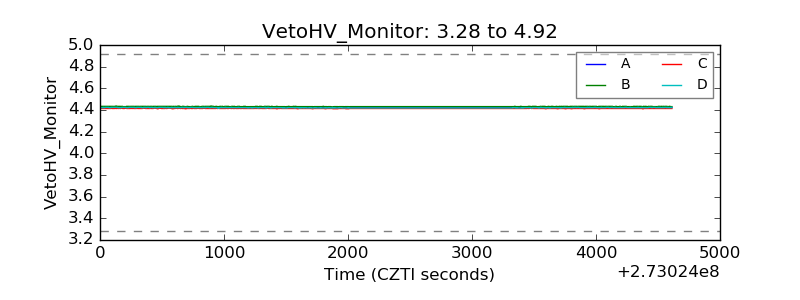 |
| Veto LLD |  |
| Alpha Counter | 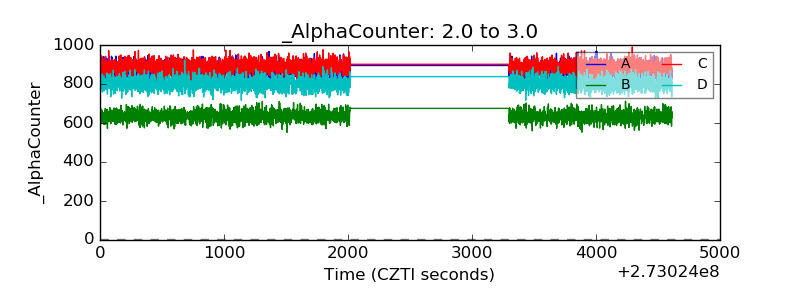 |
| _CPM_Rate | 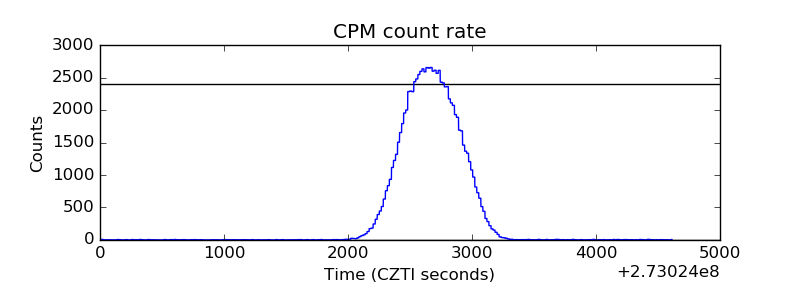 |
| CZT Counter | 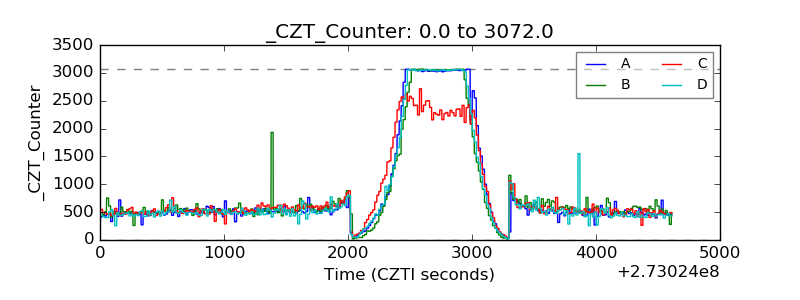 |
| +2.5 Volts monitor |  |
| +5 Volts monitor |  |
| _ROLL_ROT |  |
| _Roll_DEC | 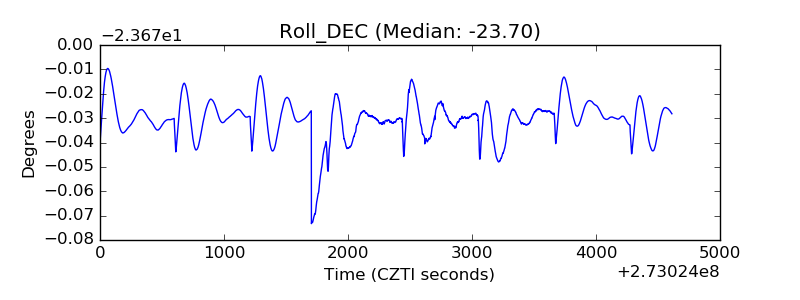 |
| _Roll_RA | 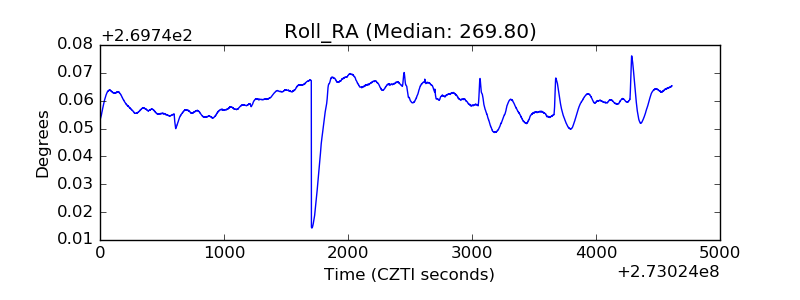 |
| Veto Counter |  |