| Param | Original file | Final file |
|---|---|---|
| Filename | modeM0/AS1T02_088T01_9000002332_15748cztM0_level2.evt | modeM0/AS1T02_088T01_9000002332_15748cztM0_level2_quad_clean.evt |
| Size (bytes) | 459,800,640 | 73,647,360 |
| Size | 438.5 MB | 70.2 MB |
| Events in quadrant A | 3,476,672 | 447,204 |
| Events in quadrant B | 3,446,626 | 464,486 |
| Events in quadrant C | 3,371,252 | 439,205 |
| Events in quadrant D | 3,187,016 | 423,542 |
| Mode M9 | |||
|---|---|---|---|
| Quadrant | BADHDUFLAG | Total packets | Discarded packets |
| A | 0 | 15 | 0 |
| B | 0 | 15 | 0 |
| C | 0 | 15 | 0 |
| D | 0 | 16 | 0 |
| Mode SS | |||
|---|---|---|---|
| Quadrant | BADHDUFLAG | Total packets | Discarded packets |
| A | 0 | 132 | 0 |
| B | 0 | 132 | 0 |
| C | 0 | 132 | 0 |
| D | 0 | 132 | 0 |
| Mode M0 | |||
|---|---|---|---|
| Quadrant | BADHDUFLAG | Total packets | Discarded packets |
| A | 0 | 14257 | 3 |
| B | 0 | 14055 | 2 |
| C | 0 | 13707 | 2 |
| D | 0 | 13683 | 2 |
| Quadrant | Total seconds | Saturated seconds | Saturation percentage |
|---|---|---|---|
| A | 6532 | 81 | 1.240049% |
| B | 6532 | 37 | 0.566442% |
| C | 6532 | 67 | 1.025720% |
| D | 6532 | 12 | 0.183711% |
Noise dominated data is calculated using 1-second bins in cleaned event files. If a bin has >2000 counts, and if more than 50% of those come from <1% of pixels, then it is considered to be noise-dominated and hence unusable.
| Quadrant | # 1 sec bins | Bins with >0 counts | Bins with >2000 counts | High rate bins dominated by noise | Noise dominated (total time) | Noise dominated (detector-on time) | Marked lightcurve |
|---|---|---|---|---|---|---|---|
| A | 7858 | 6534 | 19 | 19 | 0.24% | 0.29% | 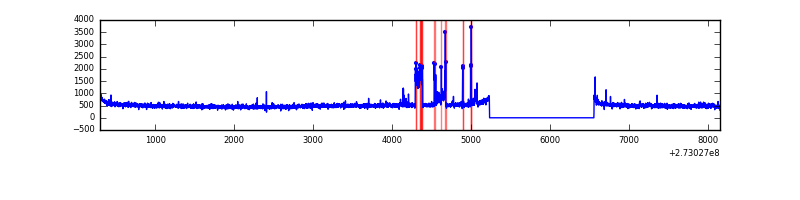 |
| B | 7858 | 6534 | 2 | 2 | 0.03% | 0.03% | 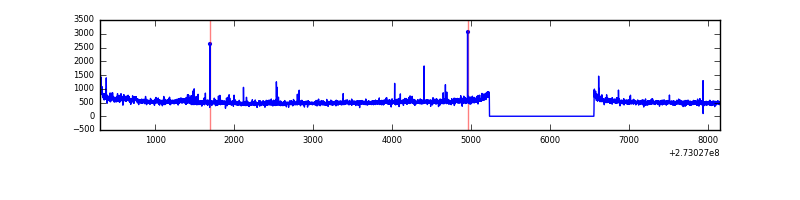 |
| C | 7858 | 6533 | 0 | 0 | 0.00% | 0.00% | 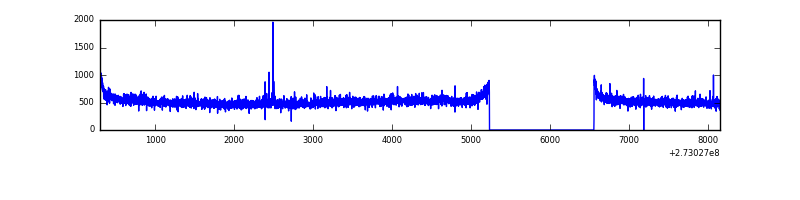 |
| D | 7858 | 6534 | 2 | 2 | 0.03% | 0.03% | 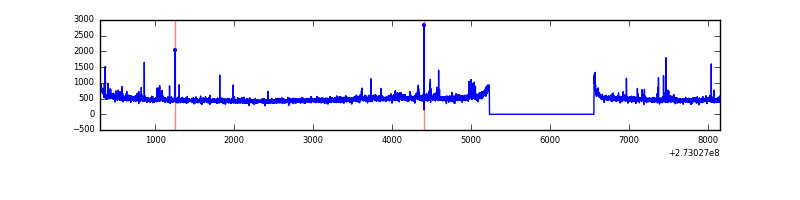 |
Top three noisy pixels from each quadrant. If the there are fewer than three noisy pixels in the level2.evt file, extra rows are filled as -1
| Pixel properties | Quadrant properties | ||||||
|---|---|---|---|---|---|---|---|
| Quadrant | DetID | PixID | Counts | Sigma | Mean | Median | Sigma |
| A | 15 | 239 | 232266 | 1390.79 | 833 | 819 | 166.4 |
| A | 15 | 69 | 16363 | 93.41 | 833 | 819 | 166.4 |
| A | 8 | 35 | 13019 | 73.31 | 833 | 819 | 166.4 |
| B | 4 | 251 | 76102 | 475.99 | 845 | 826 | 158.1 |
| B | 12 | 111 | 18259 | 110.23 | 845 | 826 | 158.1 |
| B | 0 | 198 | 17404 | 104.83 | 845 | 826 | 158.1 |
| C | 14 | 238 | 128907 | 684.3 | 806 | 813 | 187.2 |
| C | 3 | 233 | 66889 | 352.99 | 806 | 813 | 187.2 |
| C | 7 | 247 | 16086 | 81.59 | 806 | 813 | 187.2 |
| D | 1 | 52 | 91057 | 460.42 | 805 | 782 | 196.1 |
| D | 2 | 234 | 26218 | 129.73 | 805 | 782 | 196.1 |
| D | 5 | 51 | 18775 | 91.77 | 805 | 782 | 196.1 |
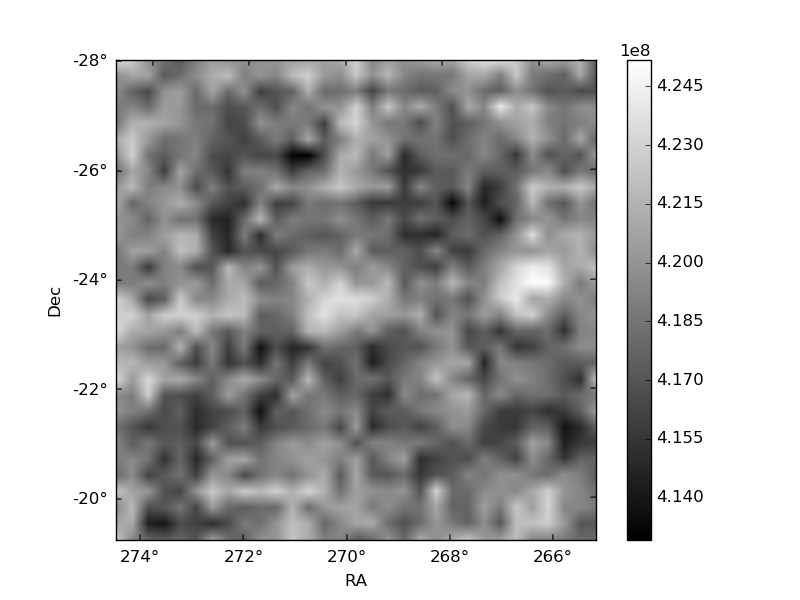
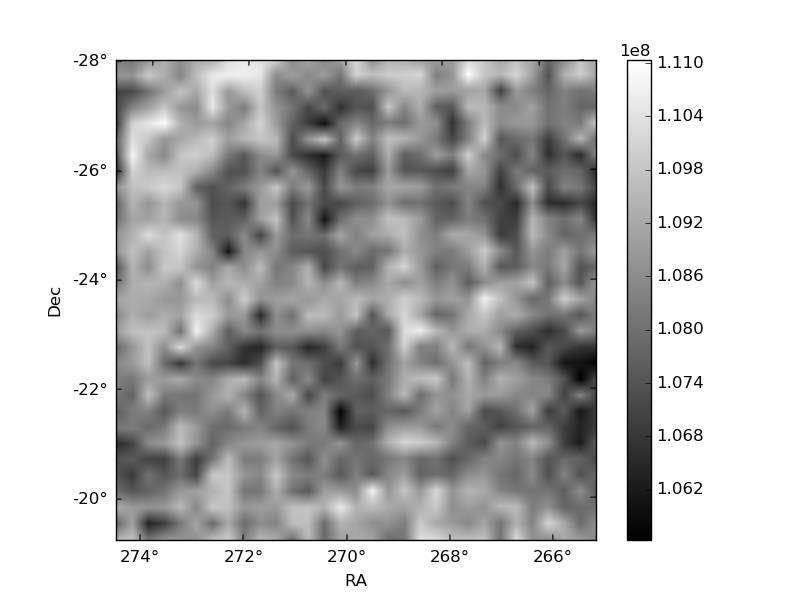
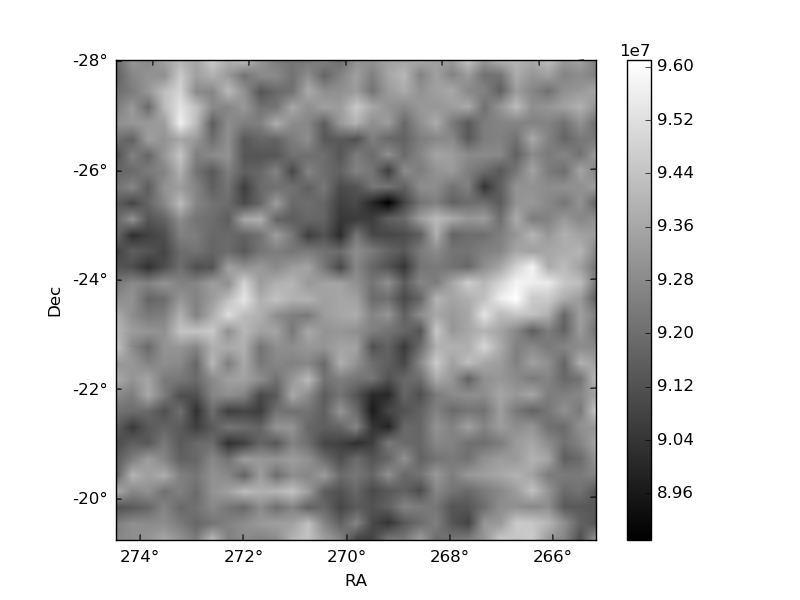
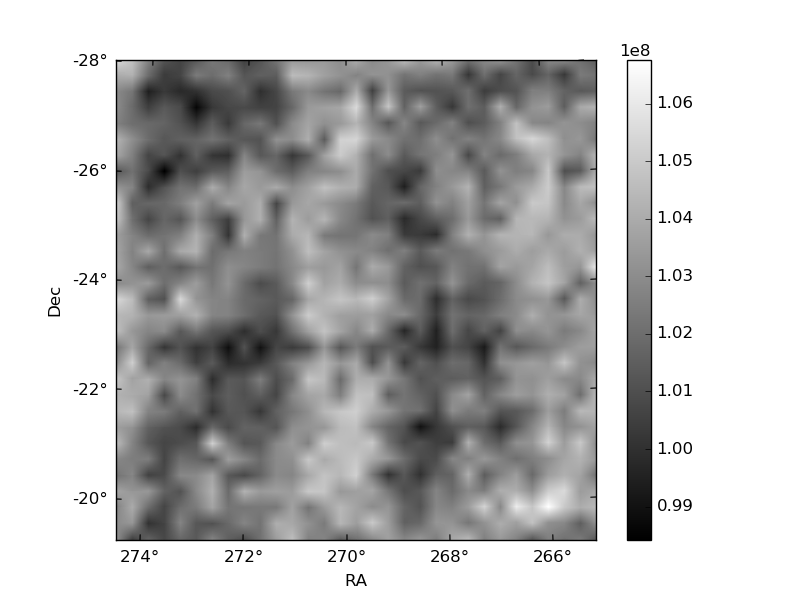
Histogram calculated using DETX and DETY for each event in the final _common_clean file
| Quadrant A | 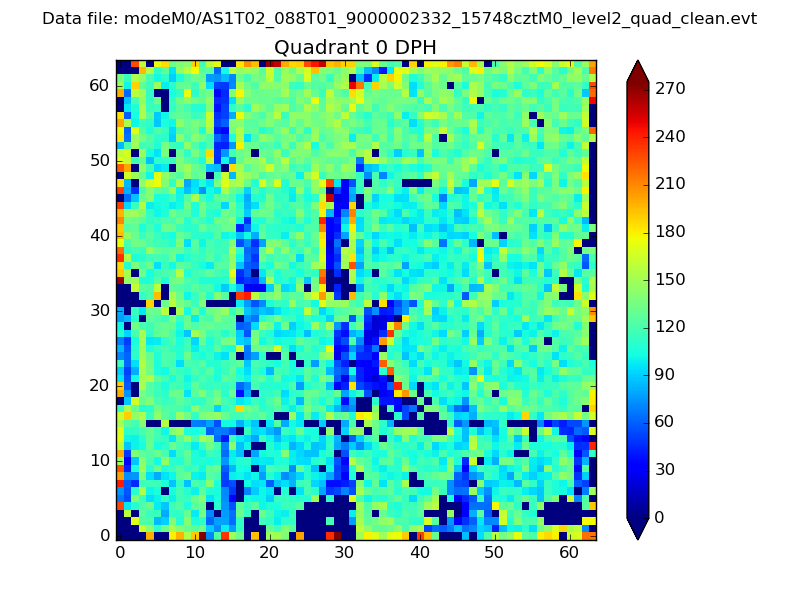 |
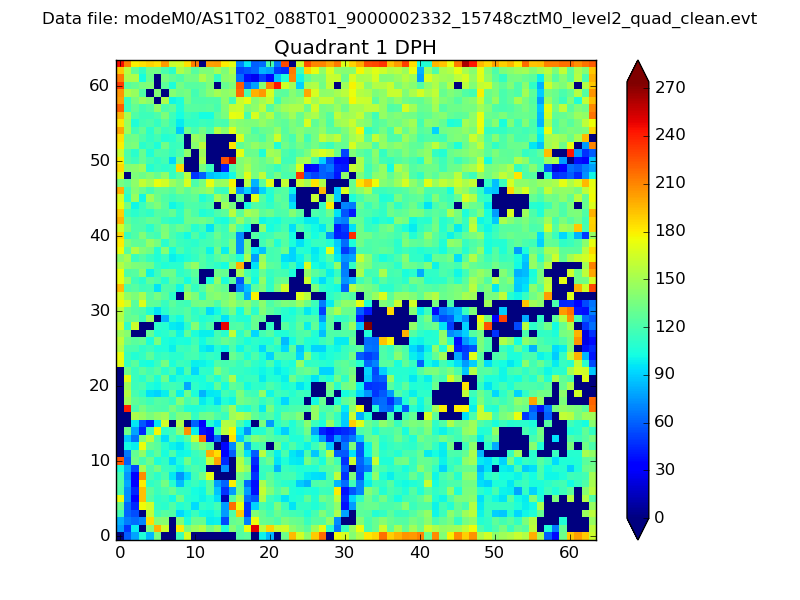 |
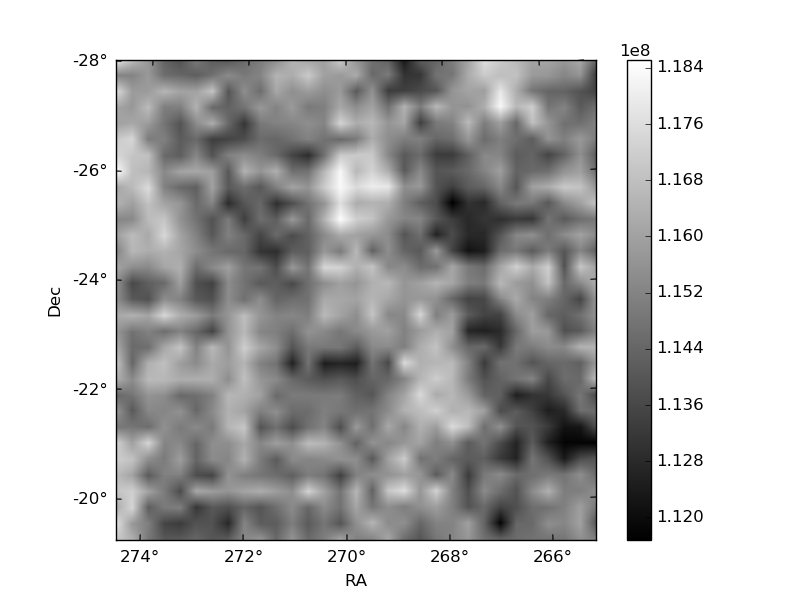
Quadrant B |
|---|---|---|---|
| Quadrant D | 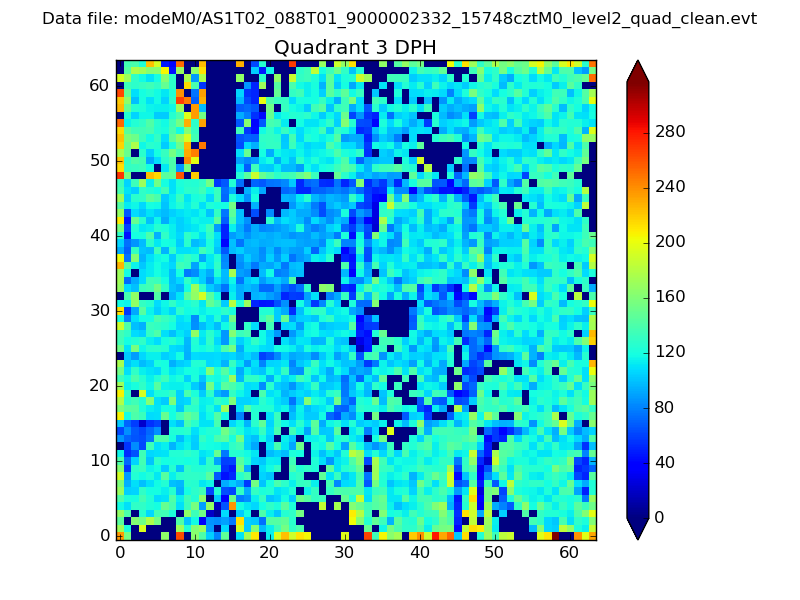 |
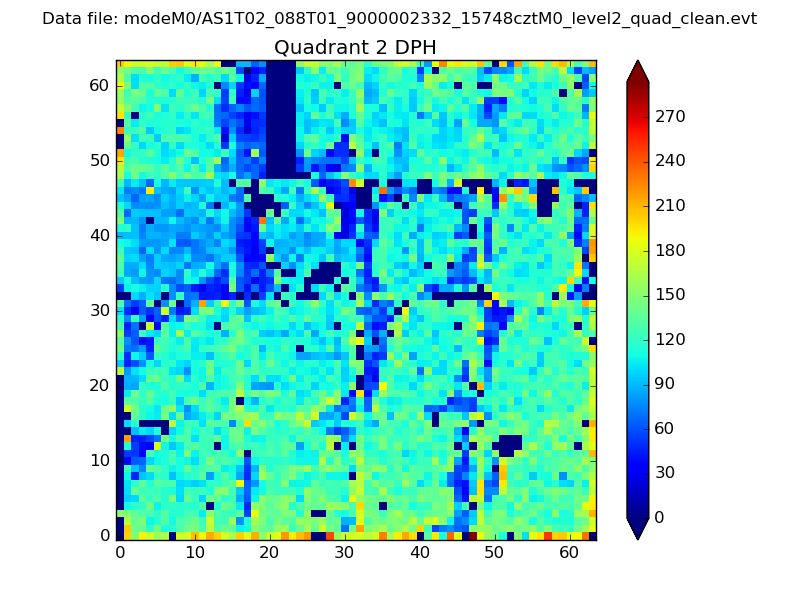 |
Quadrant C |
| Plot type | Count rate plots | Images |
|---|---|---|
| Comparison with Poisson distribution Blue bars denote a histogram of data divided into 1 sec bins. Red curve is a Poisson curve with rate = median count rate of data. |
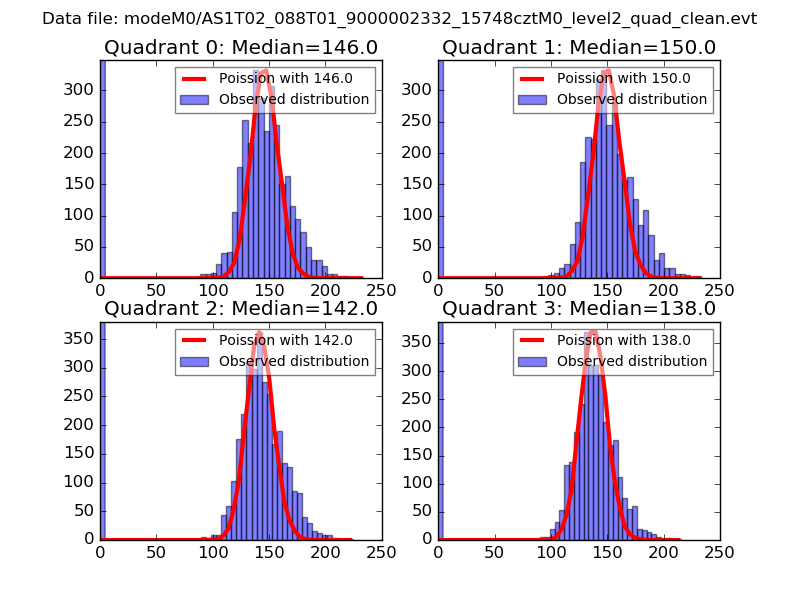 |
 |
| Quadrant-wise count rates Data is divided into 100 sec bins |
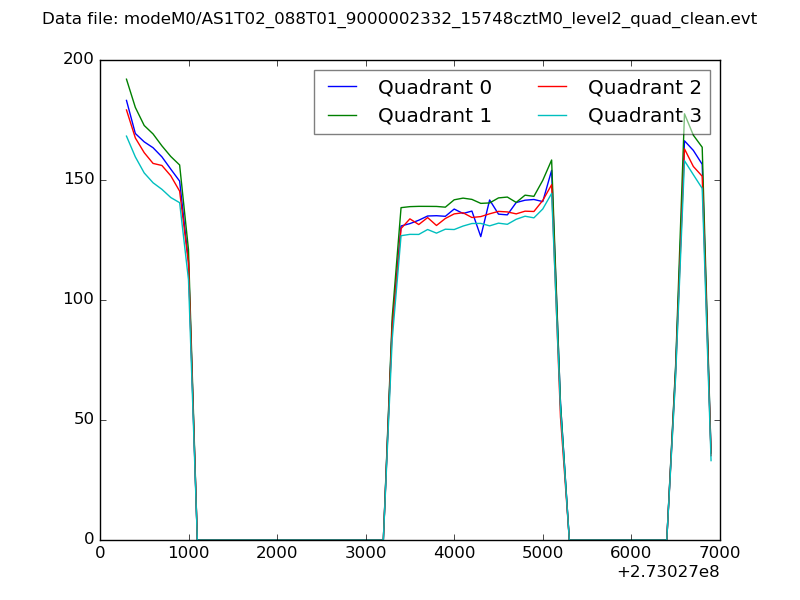 |
|
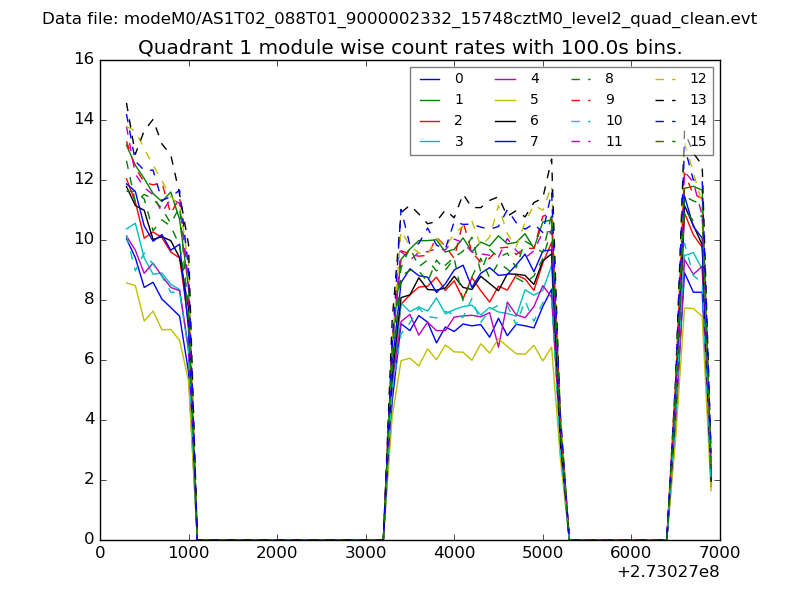
| Module-wise count rates for Quadrant A Data is divided into 100 sec bins |
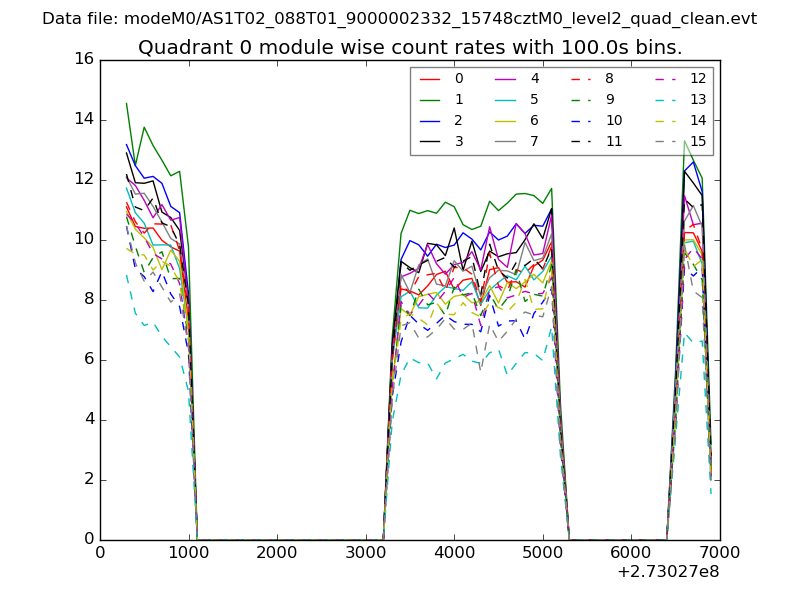 |
 |
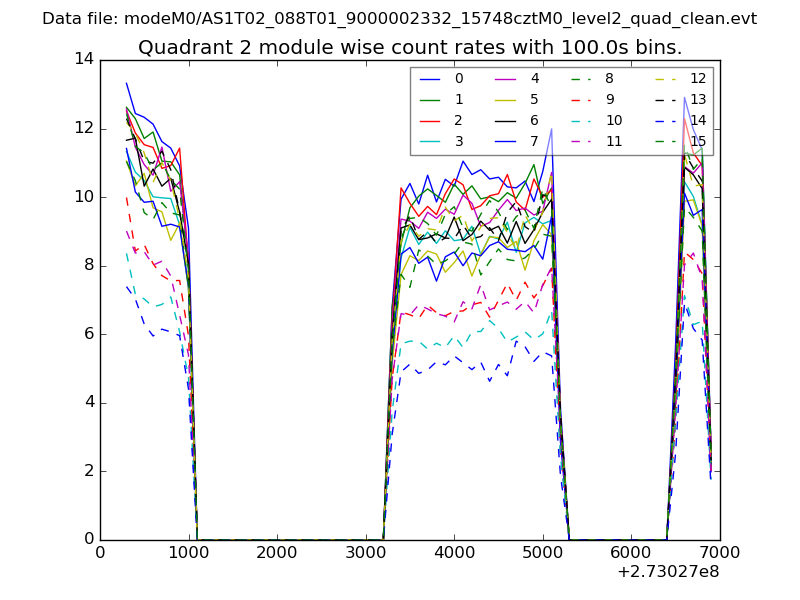
| Module-wise count rates for Quadrant B Data is divided into 100 sec bins |
 |
 |
| Module-wise count rates for Quadrant C Data is divided into 100 sec bins |
 |
 |
| Module-wise count rates for Quadrant D Data is divided into 100 sec bins |
 |
 |
| Parameter | Plot |
|---|---|
| CZT HV Monitor | 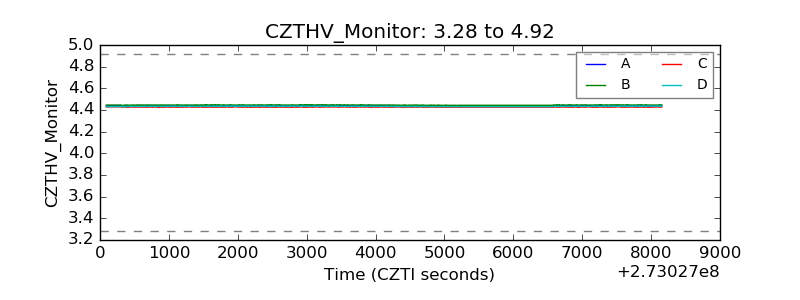 |
| D_VDD | 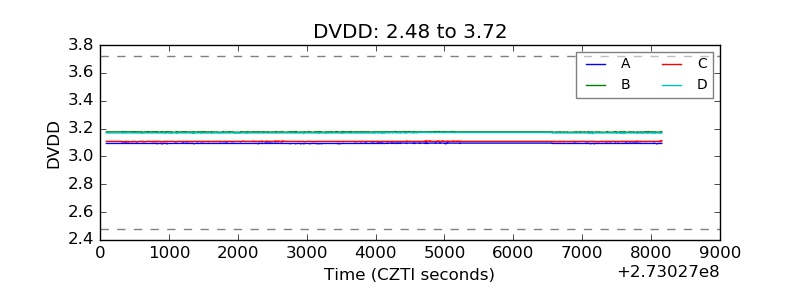 |
| Temperature 1 | 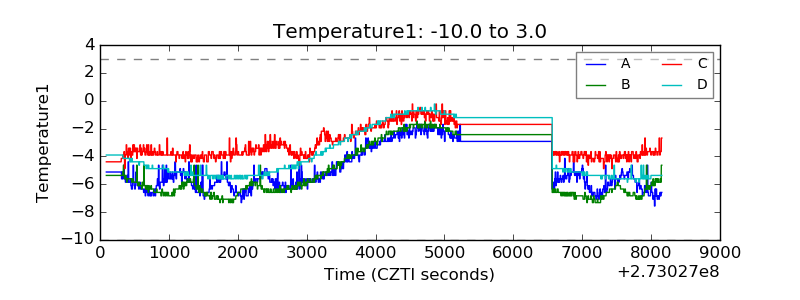 |
| Veto HV Monitor | 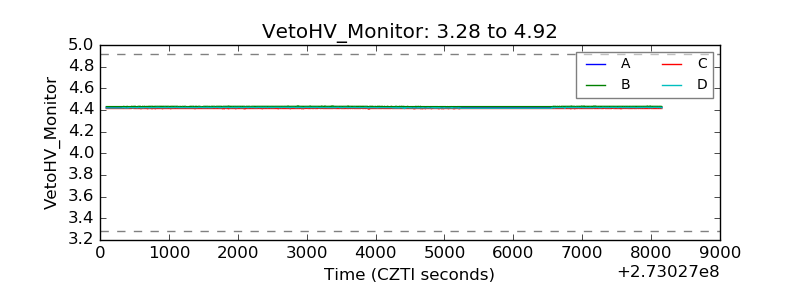 |
| Veto LLD |  |
| Alpha Counter |  |
| _CPM_Rate | 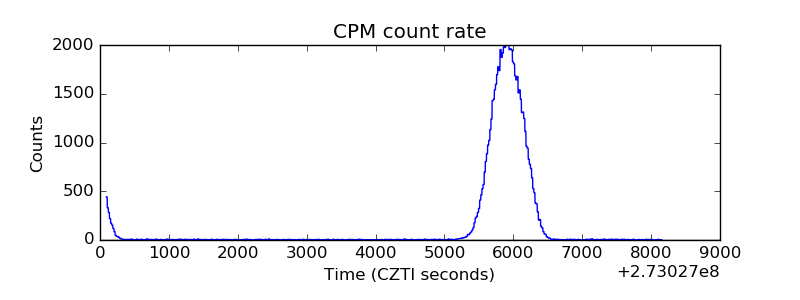 |
| CZT Counter | 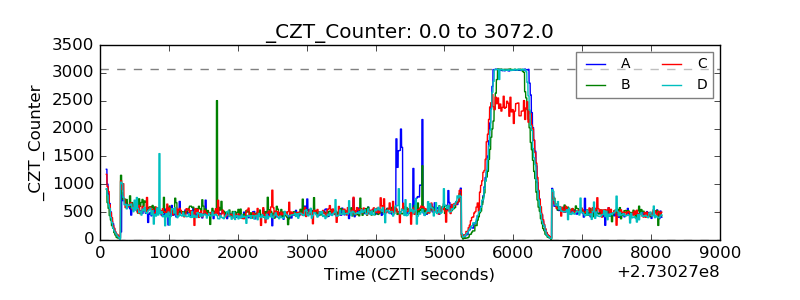 |
| +2.5 Volts monitor |  |
| +5 Volts monitor | 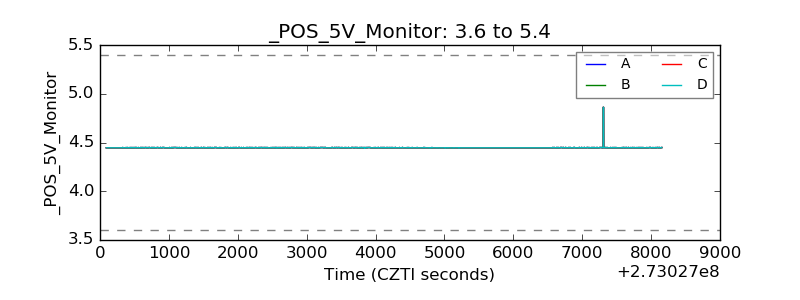 |
| _ROLL_ROT | 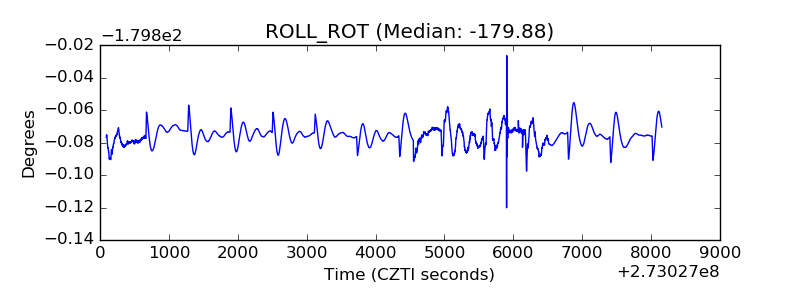 |
| _Roll_DEC |  |
| _Roll_RA | 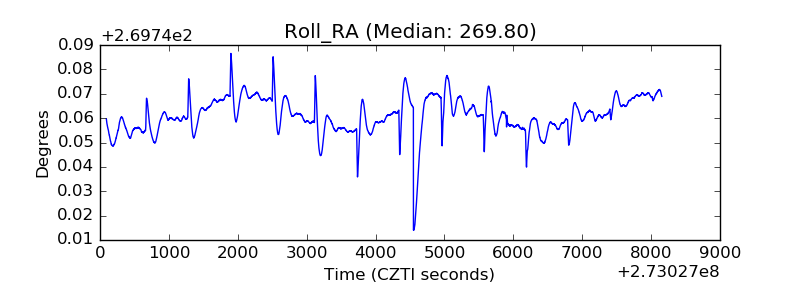 |
| Veto Counter | 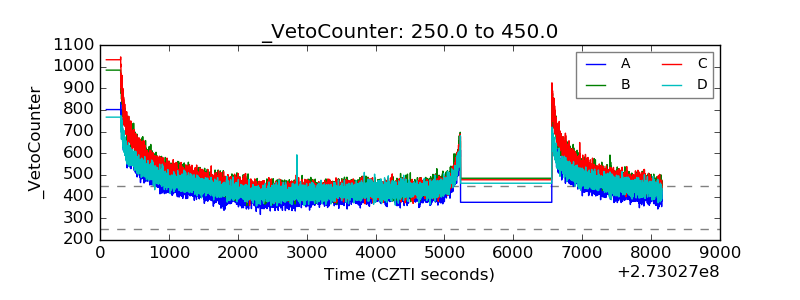 |