| Param | Original file | Final file |
|---|---|---|
| Filename | modeM0/AS1T02_088T01_9000002332_15749cztM0_level2.evt | modeM0/AS1T02_088T01_9000002332_15749cztM0_level2_quad_clean.evt |
| Size (bytes) | 452,436,480 | 65,496,960 |
| Size | 431.5 MB | 62.5 MB |
| Events in quadrant A | 3,312,245 | 387,838 |
| Events in quadrant B | 3,351,628 | 396,259 |
| Events in quadrant C | 3,421,900 | 376,337 |
| Events in quadrant D | 3,173,294 | 367,908 |
| Mode M9 | |||
|---|---|---|---|
| Quadrant | BADHDUFLAG | Total packets | Discarded packets |
| A | 0 | 16 | 0 |
| B | 0 | 16 | 0 |
| C | 0 | 16 | 0 |
| D | 0 | 17 | 0 |
| Mode SS | |||
|---|---|---|---|
| Quadrant | BADHDUFLAG | Total packets | Discarded packets |
| A | 0 | 134 | 0 |
| B | 0 | 134 | 0 |
| C | 0 | 134 | 0 |
| D | 0 | 134 | 0 |
| Mode M0 | |||
|---|---|---|---|
| Quadrant | BADHDUFLAG | Total packets | Discarded packets |
| A | 0 | 13820 | 3 |
| B | 0 | 13699 | 2 |
| C | 0 | 13832 | 2 |
| D | 0 | 13631 | 2 |
| Quadrant | Total seconds | Saturated seconds | Saturation percentage |
|---|---|---|---|
| A | 6514 | 57 | 0.875038% |
| B | 6514 | 76 | 1.166718% |
| C | 6514 | 106 | 1.627264% |
| D | 6514 | 56 | 0.859687% |
Noise dominated data is calculated using 1-second bins in cleaned event files. If a bin has >2000 counts, and if more than 50% of those come from <1% of pixels, then it is considered to be noise-dominated and hence unusable.
| Quadrant | # 1 sec bins | Bins with >0 counts | Bins with >2000 counts | High rate bins dominated by noise | Noise dominated (total time) | Noise dominated (detector-on time) | Marked lightcurve |
|---|---|---|---|---|---|---|---|
| A | 7735 | 6516 | 1 | 1 | 0.01% | 0.02% | 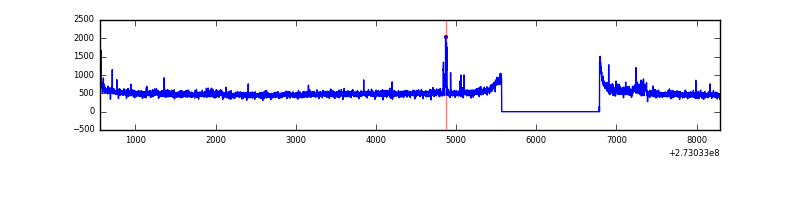 |
| B | 7735 | 6515 | 2 | 2 | 0.03% | 0.03% | 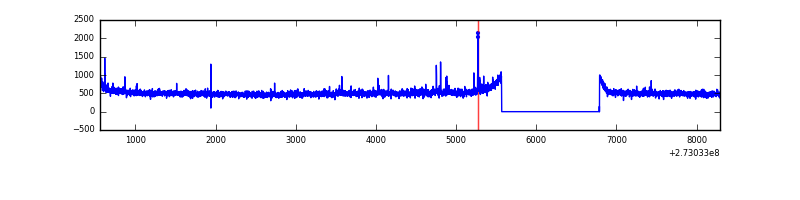 |
| C | 7735 | 6514 | 2 | 2 | 0.03% | 0.03% | 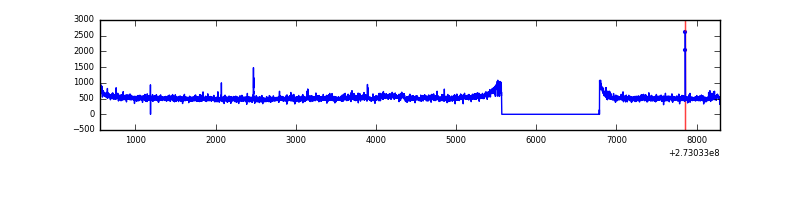 |
| D | 7735 | 6516 | 4 | 4 | 0.05% | 0.06% | 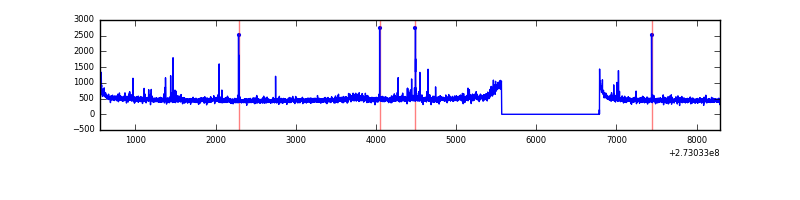 |
Top three noisy pixels from each quadrant. If the there are fewer than three noisy pixels in the level2.evt file, extra rows are filled as -1
| Pixel properties | Quadrant properties | ||||||
|---|---|---|---|---|---|---|---|
| Quadrant | DetID | PixID | Counts | Sigma | Mean | Median | Sigma |
| A | 3 | 80 | 76410 | 455.34 | 829 | 813 | 166.0 |
| A | 4 | 2 | 23553 | 136.97 | 829 | 813 | 166.0 |
| A | 8 | 35 | 13013 | 73.48 | 829 | 813 | 166.0 |
| B | 12 | 111 | 18253 | 110.33 | 837 | 819 | 158.0 |
| B | 3 | 209 | 15938 | 95.68 | 837 | 819 | 158.0 |
| B | 11 | 111 | 15647 | 93.84 | 837 | 819 | 158.0 |
| C | 3 | 233 | 146773 | 782.25 | 800 | 807 | 186.6 |
| C | 14 | 238 | 126553 | 673.89 | 800 | 807 | 186.6 |
| C | 7 | 247 | 10176 | 50.21 | 800 | 807 | 186.6 |
| D | 1 | 52 | 79942 | 403.28 | 805 | 781 | 196.3 |
| D | 2 | 234 | 23974 | 118.15 | 805 | 781 | 196.3 |
| D | 5 | 51 | 21530 | 105.7 | 805 | 781 | 196.3 |
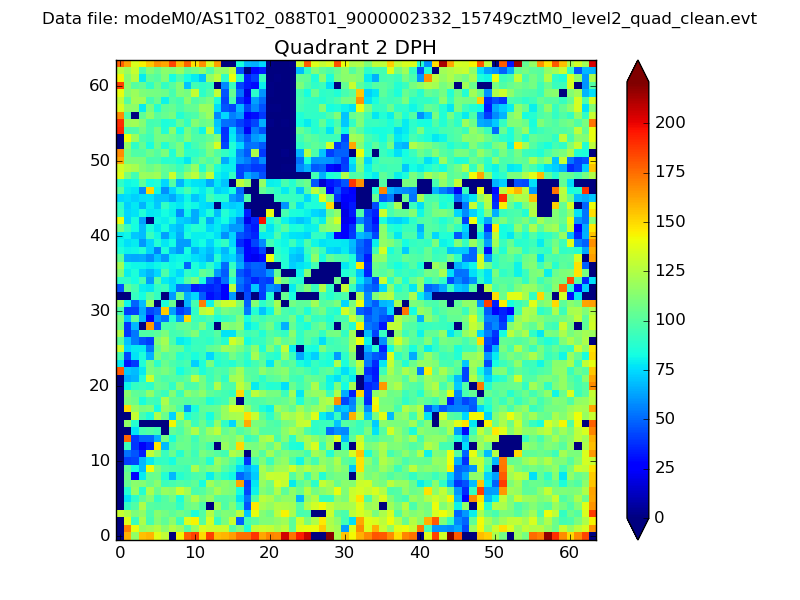
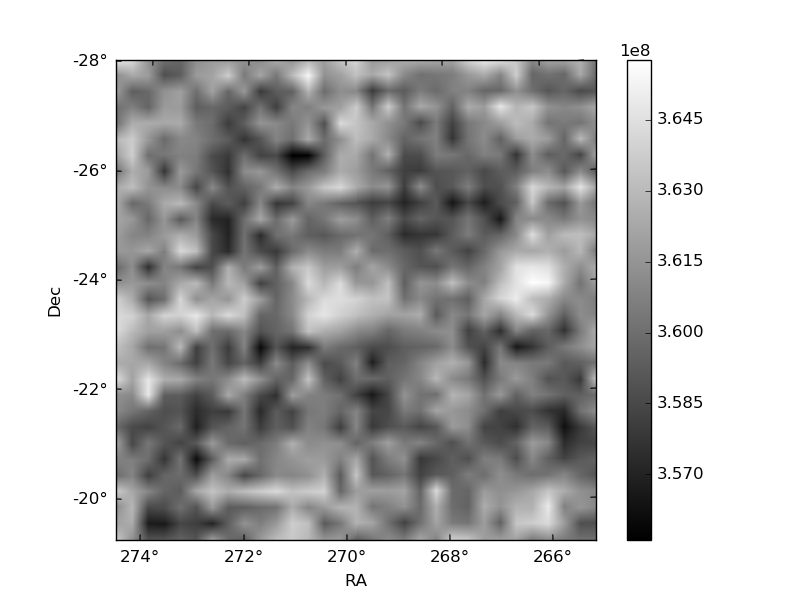
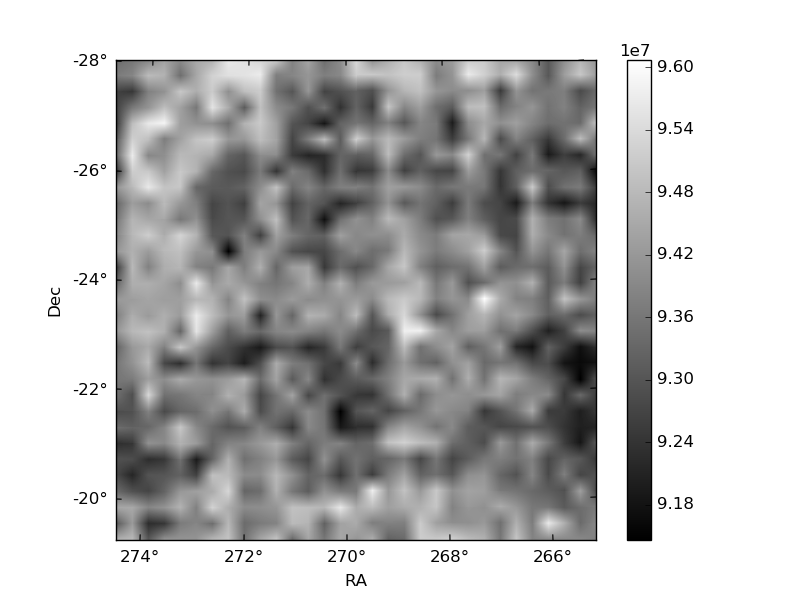
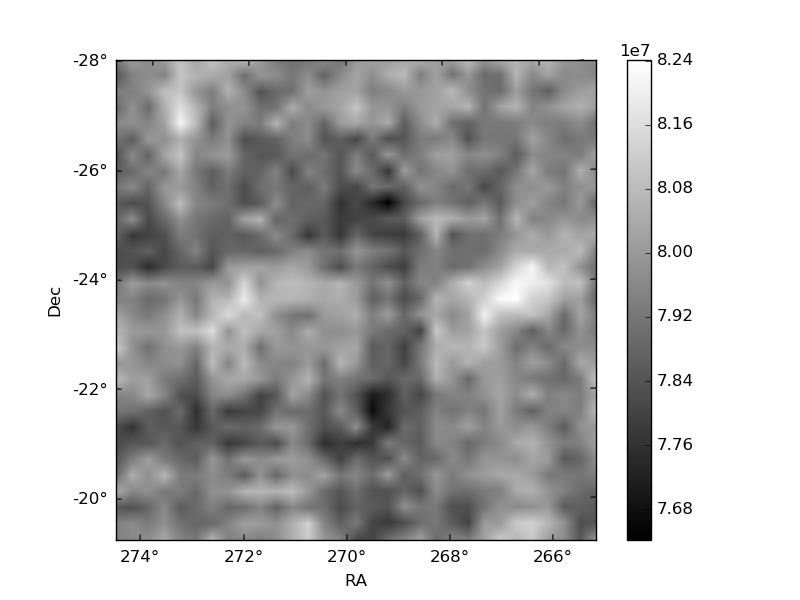
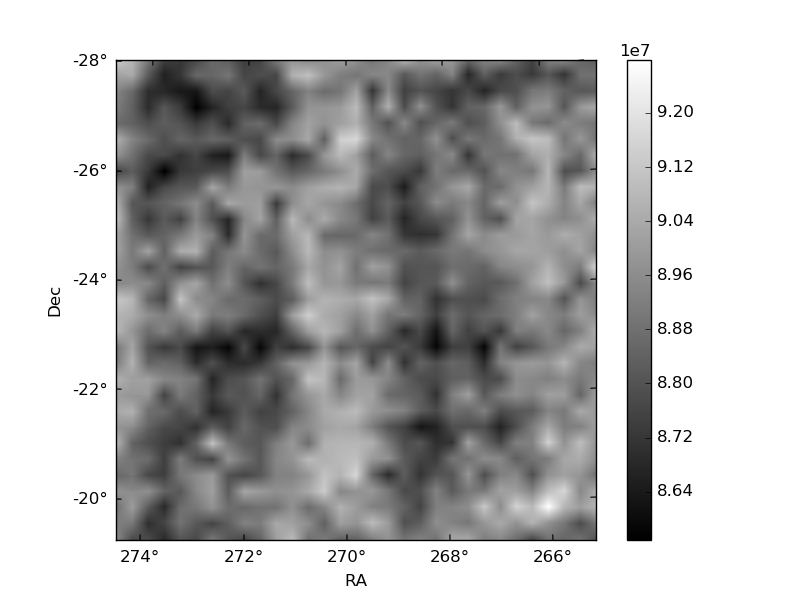
Histogram calculated using DETX and DETY for each event in the final _common_clean file
| Quadrant A | 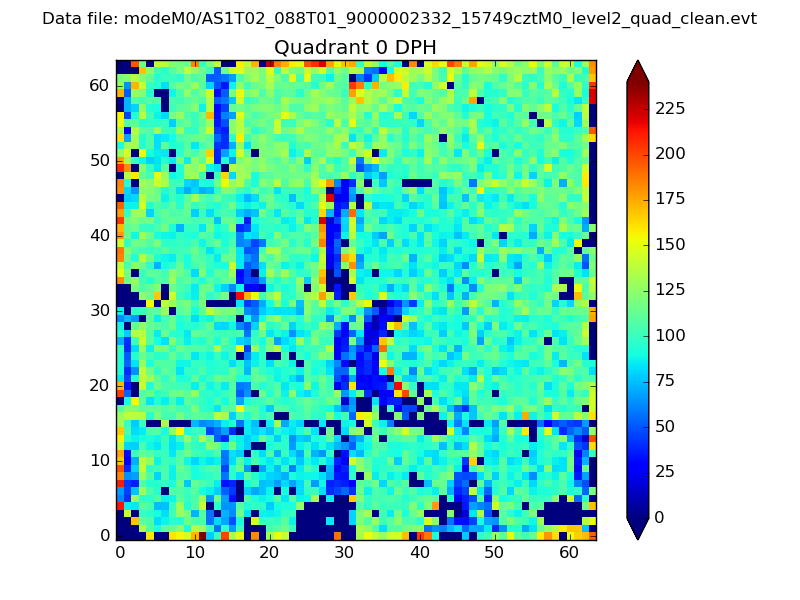 |
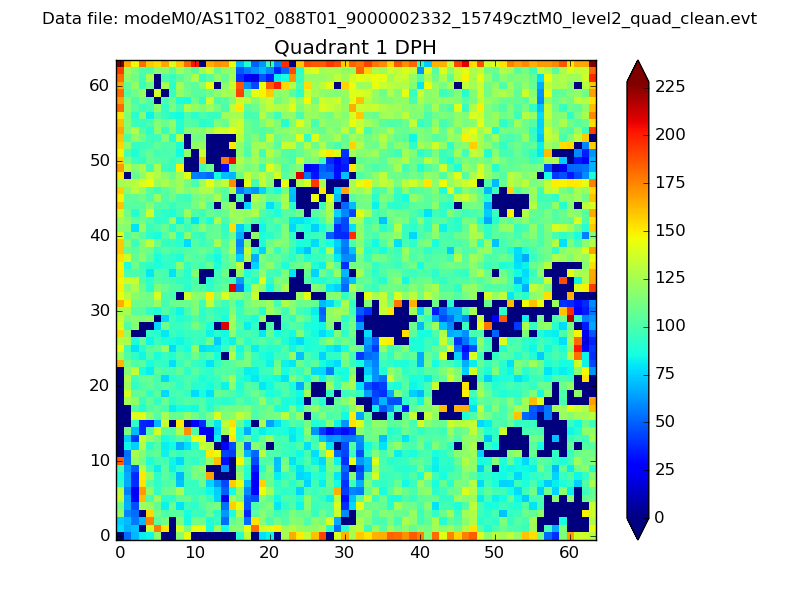 |
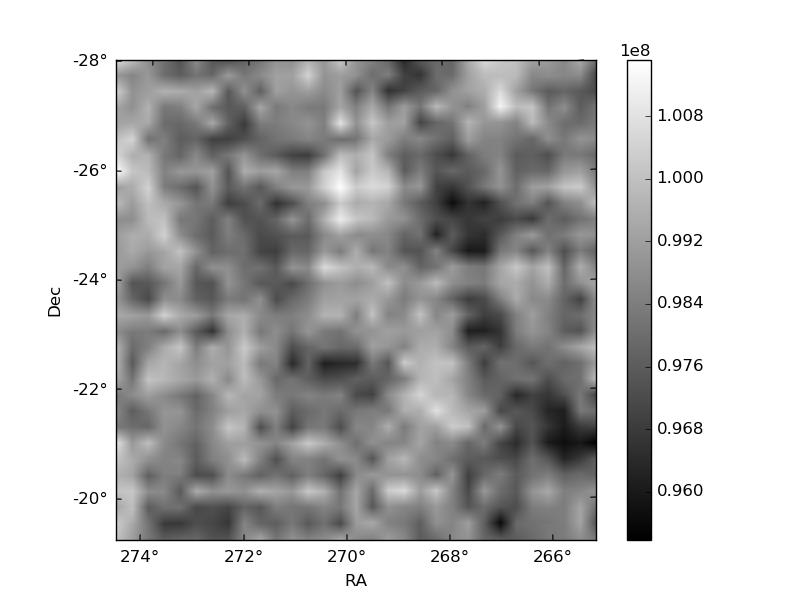
Quadrant B |
|---|---|---|---|
| Quadrant D | 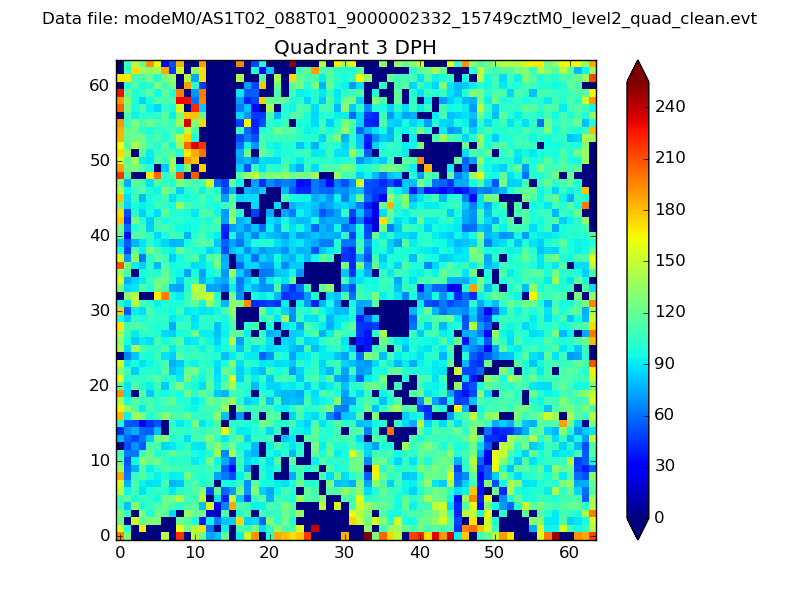 |
 |
Quadrant C |
| Plot type | Count rate plots | Images |
|---|---|---|
| Comparison with Poisson distribution Blue bars denote a histogram of data divided into 1 sec bins. Red curve is a Poisson curve with rate = median count rate of data. |
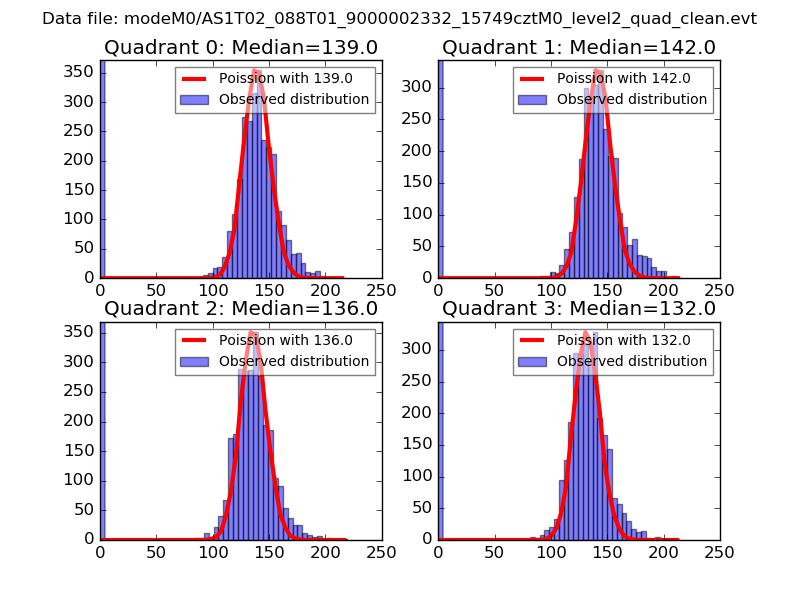 |
 |
| Quadrant-wise count rates Data is divided into 100 sec bins |
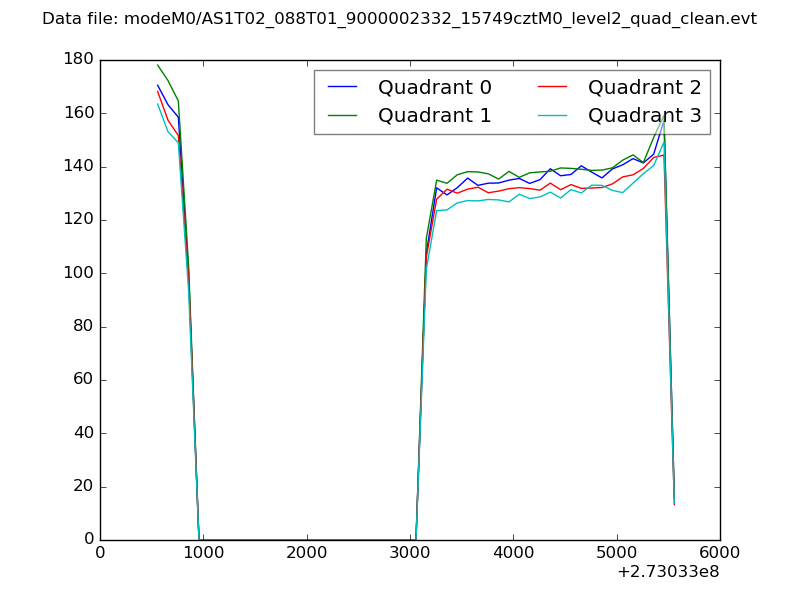 |
|
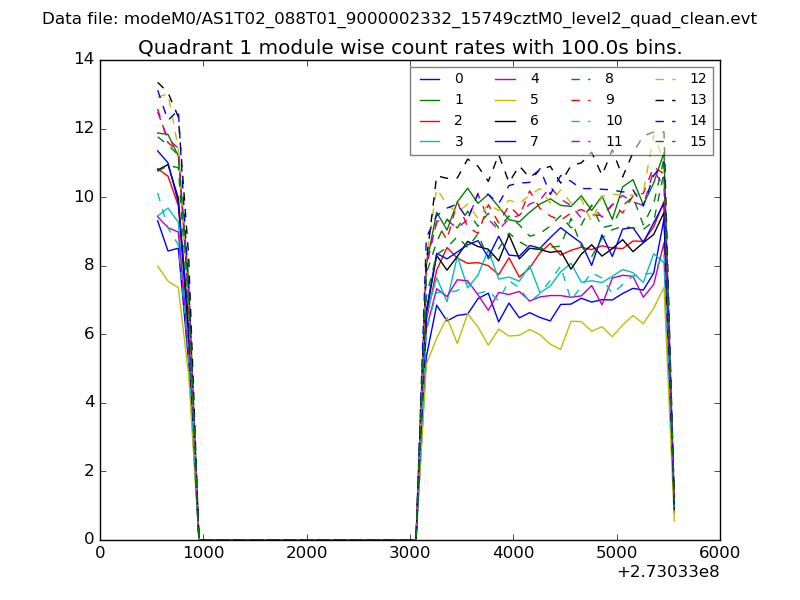
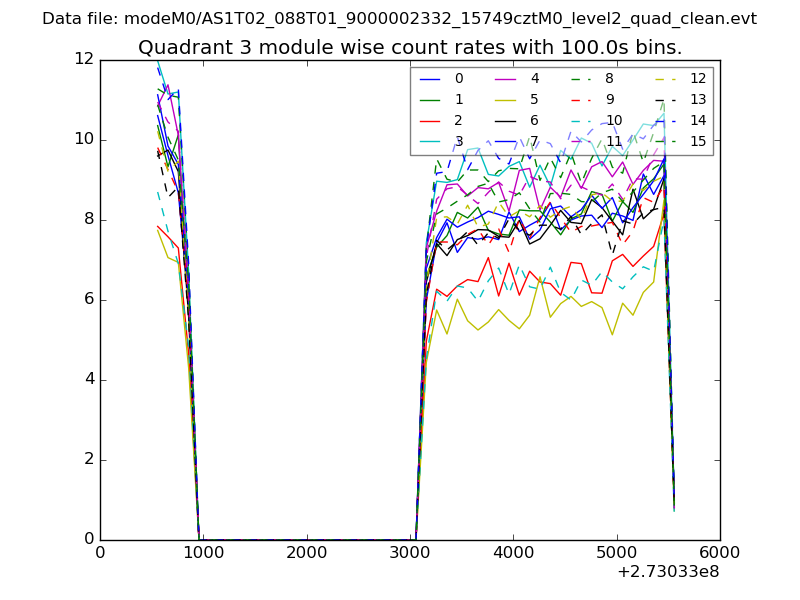
| Module-wise count rates for Quadrant A Data is divided into 100 sec bins |
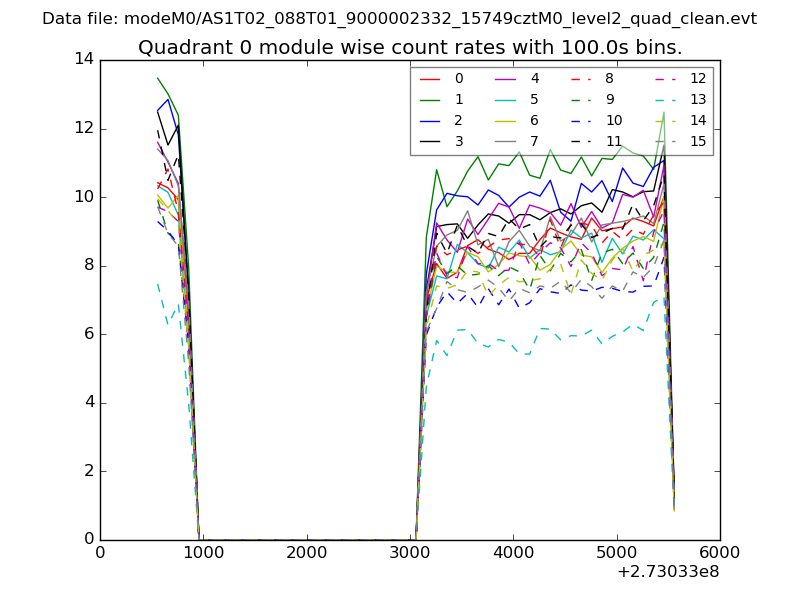 |
 |
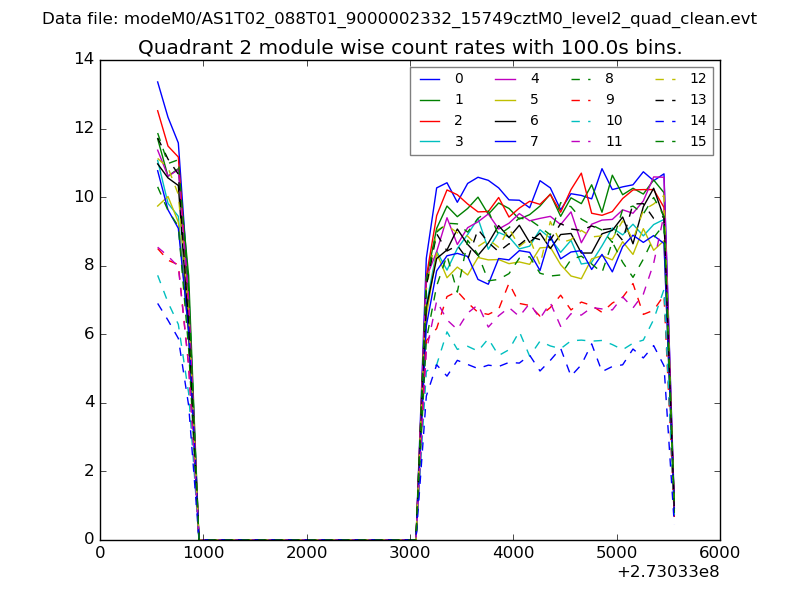
| Module-wise count rates for Quadrant B Data is divided into 100 sec bins |
 |
 |
| Module-wise count rates for Quadrant C Data is divided into 100 sec bins |
 |
 |
| Module-wise count rates for Quadrant D Data is divided into 100 sec bins |
 |
 |
| Parameter | Plot |
|---|---|
| CZT HV Monitor |  |
| D_VDD | 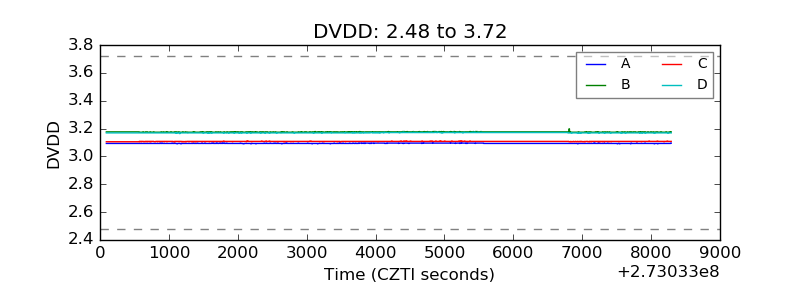 |
| Temperature 1 |  |
| Veto HV Monitor | 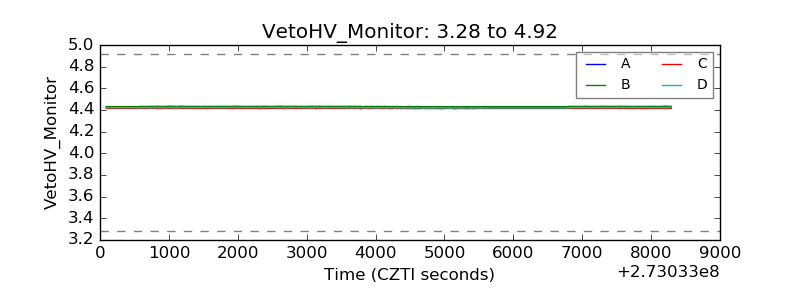 |
| Veto LLD | 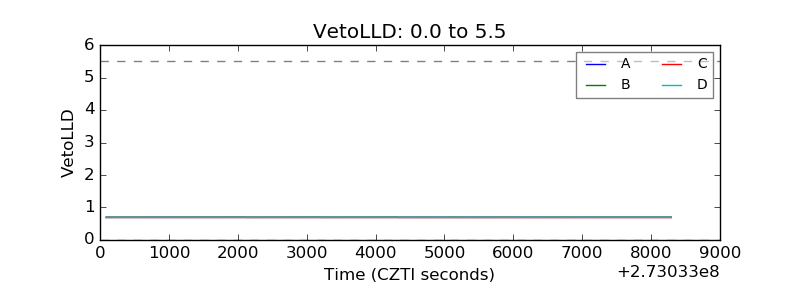 |
| Alpha Counter | 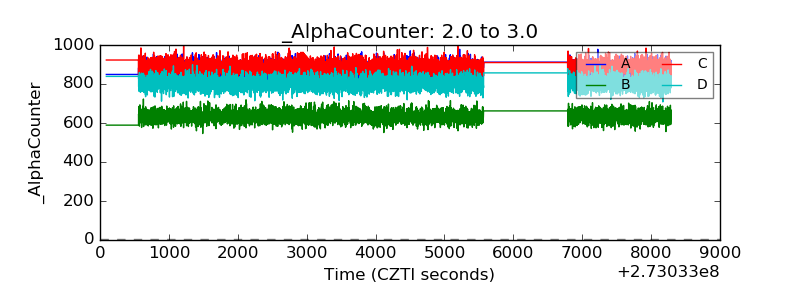 |
| _CPM_Rate | 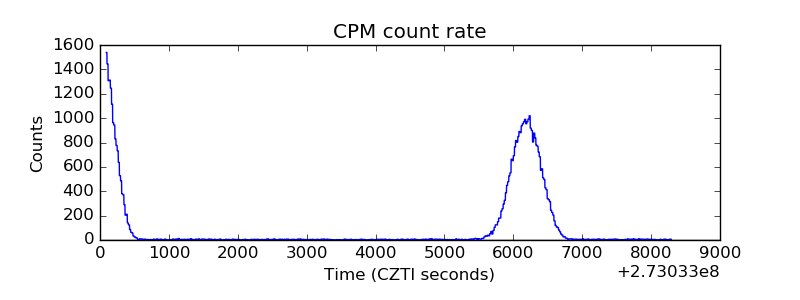 |
| CZT Counter | 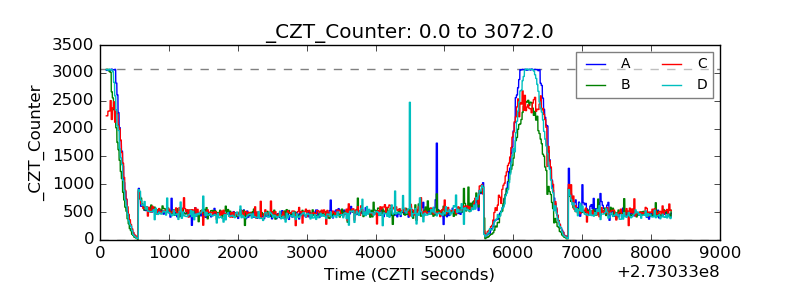 |
| +2.5 Volts monitor |  |
| +5 Volts monitor | 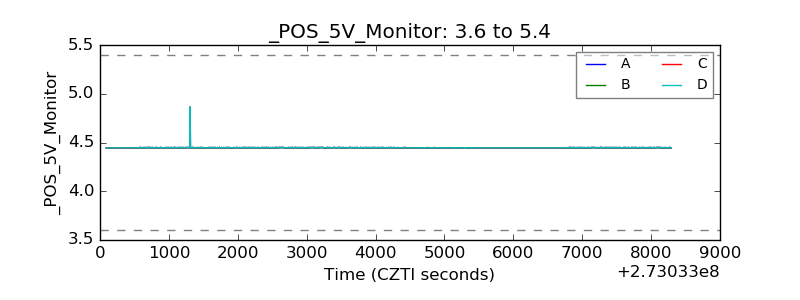 |
| _ROLL_ROT |  |
| _Roll_DEC | 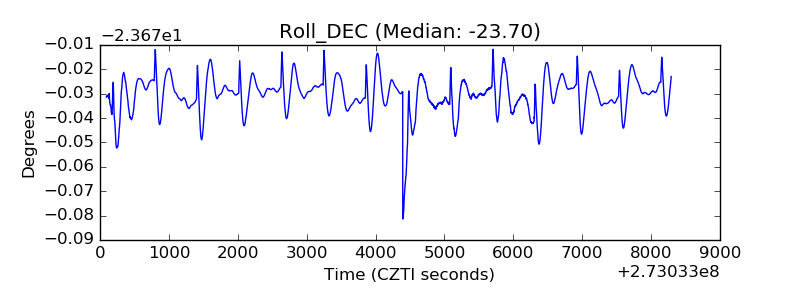 |
| _Roll_RA | 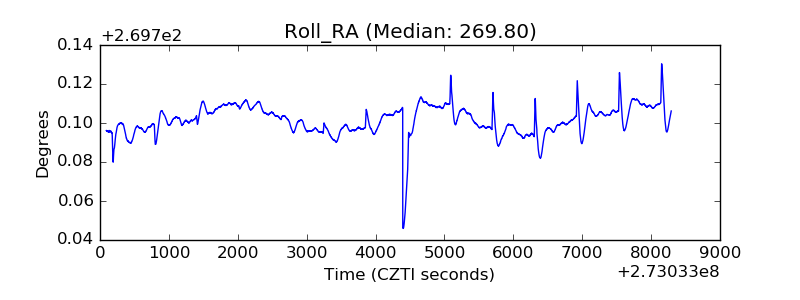 |
| Veto Counter |  |