| Param | Original file | Final file |
|---|---|---|
| Filename | modeM0/AS1T02_088T01_9000002332_15750cztM0_level2.evt | modeM0/AS1T02_088T01_9000002332_15750cztM0_level2_quad_clean.evt |
| Size (bytes) | 457,205,760 | 67,737,600 |
| Size | 436.0 MB | 64.6 MB |
| Events in quadrant A | 3,324,203 | 403,272 |
| Events in quadrant B | 3,473,388 | 406,537 |
| Events in quadrant C | 3,361,153 | 391,549 |
| Events in quadrant D | 3,236,504 | 386,641 |
| Mode M9 | |||
|---|---|---|---|
| Quadrant | BADHDUFLAG | Total packets | Discarded packets |
| A | 0 | 14 | 0 |
| B | 0 | 14 | 0 |
| C | 0 | 14 | 0 |
| D | 0 | 15 | 0 |
| Mode SS | |||
|---|---|---|---|
| Quadrant | BADHDUFLAG | Total packets | Discarded packets |
| A | 0 | 136 | 0 |
| B | 0 | 136 | 0 |
| C | 0 | 136 | 0 |
| D | 0 | 136 | 0 |
| Mode M0 | |||
|---|---|---|---|
| Quadrant | BADHDUFLAG | Total packets | Discarded packets |
| A | 0 | 14094 | 3 |
| B | 0 | 14261 | 2 |
| C | 0 | 13868 | 2 |
| D | 0 | 14043 | 2 |
| Quadrant | Total seconds | Saturated seconds | Saturation percentage |
|---|---|---|---|
| A | 6635 | 99 | 1.492087% |
| B | 6635 | 118 | 1.778448% |
| C | 6635 | 141 | 2.125094% |
| D | 6635 | 83 | 1.250942% |
Noise dominated data is calculated using 1-second bins in cleaned event files. If a bin has >2000 counts, and if more than 50% of those come from <1% of pixels, then it is considered to be noise-dominated and hence unusable.
| Quadrant | # 1 sec bins | Bins with >0 counts | Bins with >2000 counts | High rate bins dominated by noise | Noise dominated (total time) | Noise dominated (detector-on time) | Marked lightcurve |
|---|---|---|---|---|---|---|---|
| A | 7606 | 6637 | 1 | 1 | 0.01% | 0.02% | 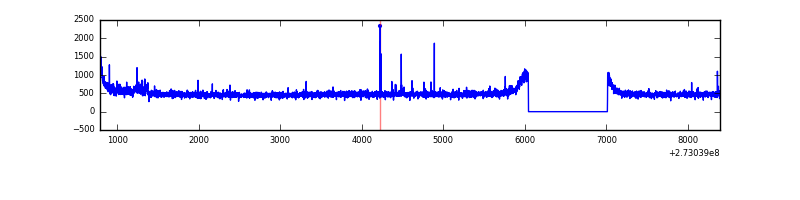 |
| B | 7606 | 6636 | 5 | 5 | 0.07% | 0.08% | 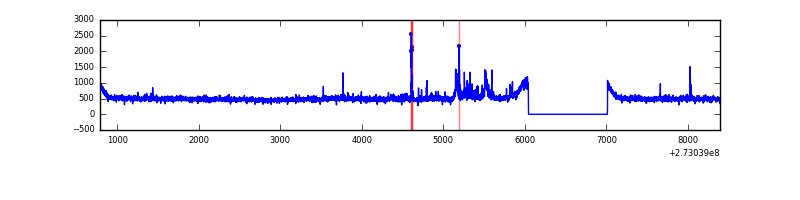 |
| C | 7606 | 6636 | 2 | 2 | 0.03% | 0.03% | 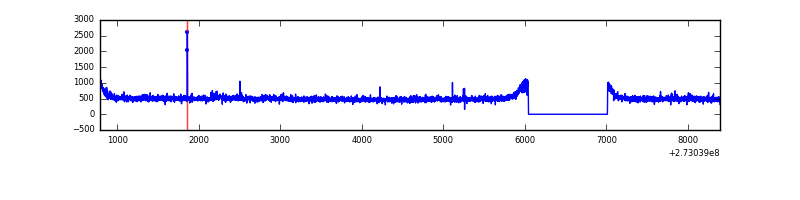 |
| D | 7606 | 6637 | 4 | 4 | 0.05% | 0.06% | 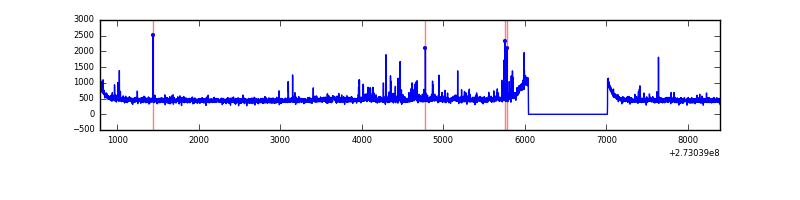 |
Top three noisy pixels from each quadrant. If the there are fewer than three noisy pixels in the level2.evt file, extra rows are filled as -1
| Pixel properties | Quadrant properties | ||||||
|---|---|---|---|---|---|---|---|
| Quadrant | DetID | PixID | Counts | Sigma | Mean | Median | Sigma |
| A | 3 | 80 | 81337 | 475.73 | 835 | 817 | 169.3 |
| A | 15 | 239 | 13643 | 75.78 | 835 | 817 | 169.3 |
| A | 4 | 2 | 7418 | 39.0 | 835 | 817 | 169.3 |
| B | 3 | 209 | 54899 | 335.58 | 839 | 820 | 161.1 |
| B | 4 | 216 | 37081 | 225.02 | 839 | 820 | 161.1 |
| B | 4 | 173 | 35143 | 212.99 | 839 | 820 | 161.1 |
| C | 14 | 238 | 123694 | 648.0 | 803 | 810 | 189.6 |
| C | 3 | 233 | 84988 | 443.89 | 803 | 810 | 189.6 |
| C | 10 | 187 | 11276 | 55.19 | 803 | 810 | 189.6 |
| D | 1 | 52 | 131138 | 655.13 | 812 | 788 | 199.0 |
| D | 2 | 234 | 25624 | 124.82 | 812 | 788 | 199.0 |
| D | 10 | 70 | 13700 | 64.89 | 812 | 788 | 199.0 |
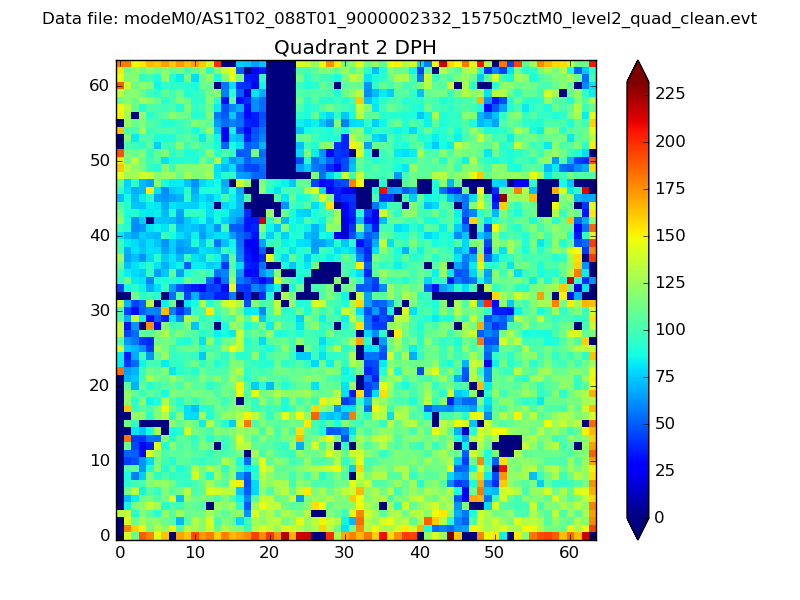
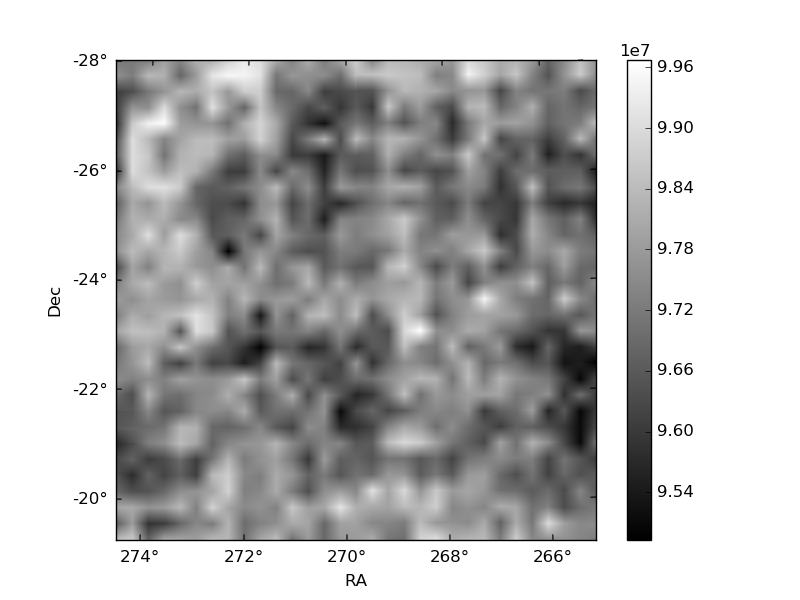
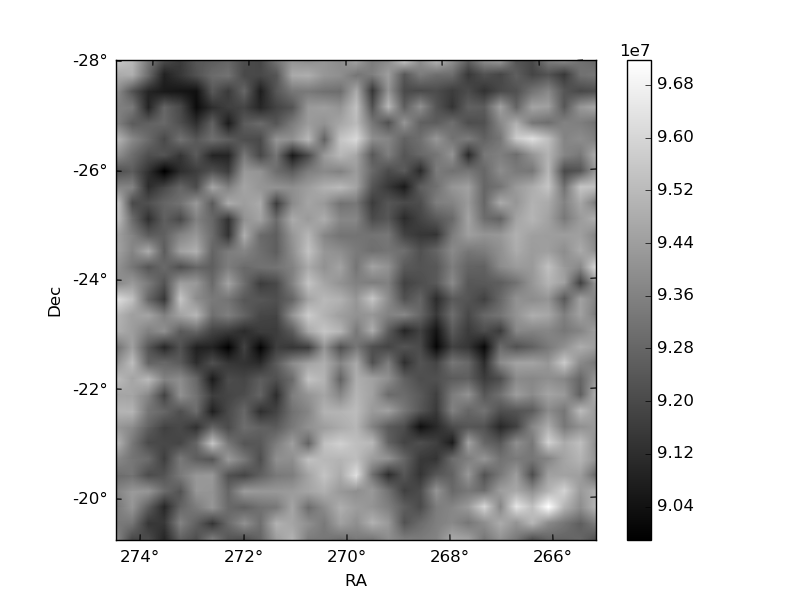
Histogram calculated using DETX and DETY for each event in the final _common_clean file
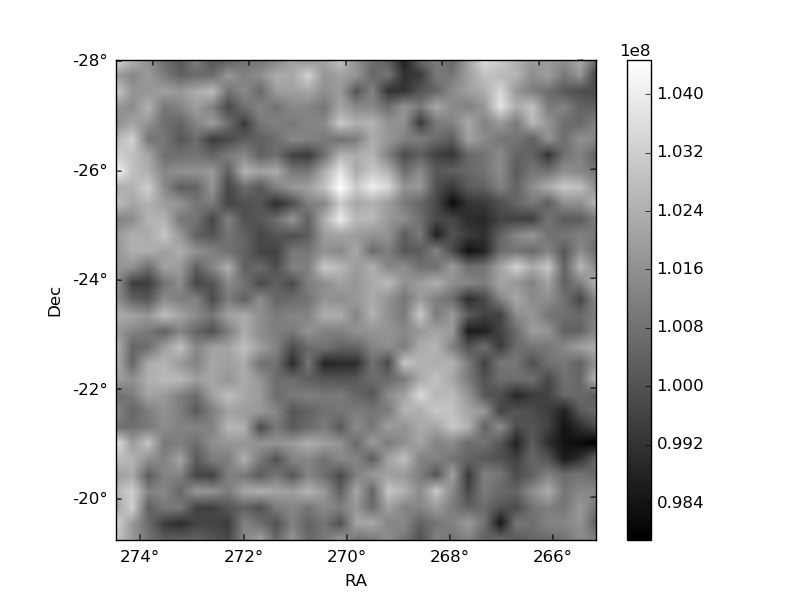
| Quadrant A | 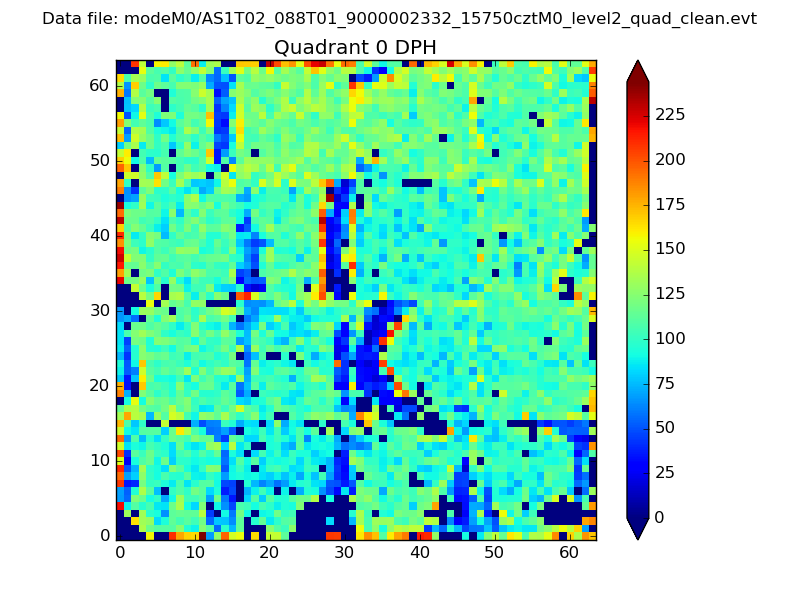 |
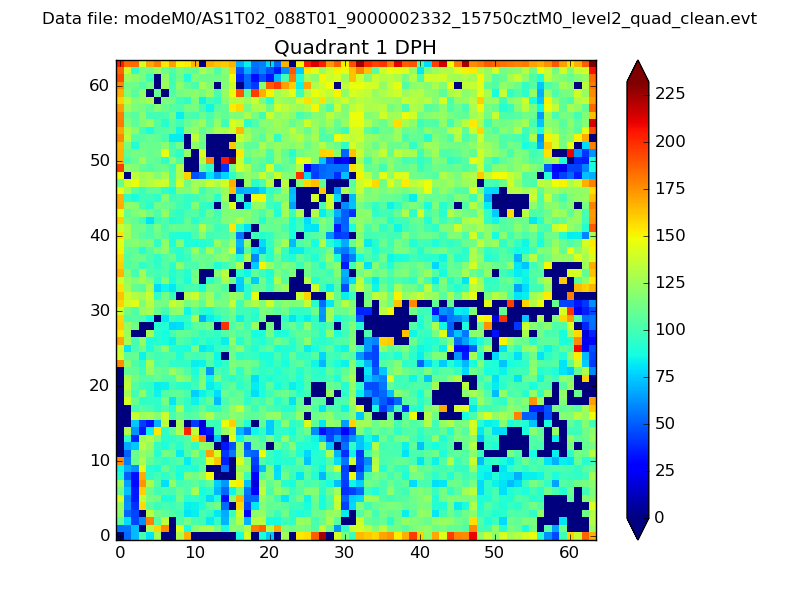 |
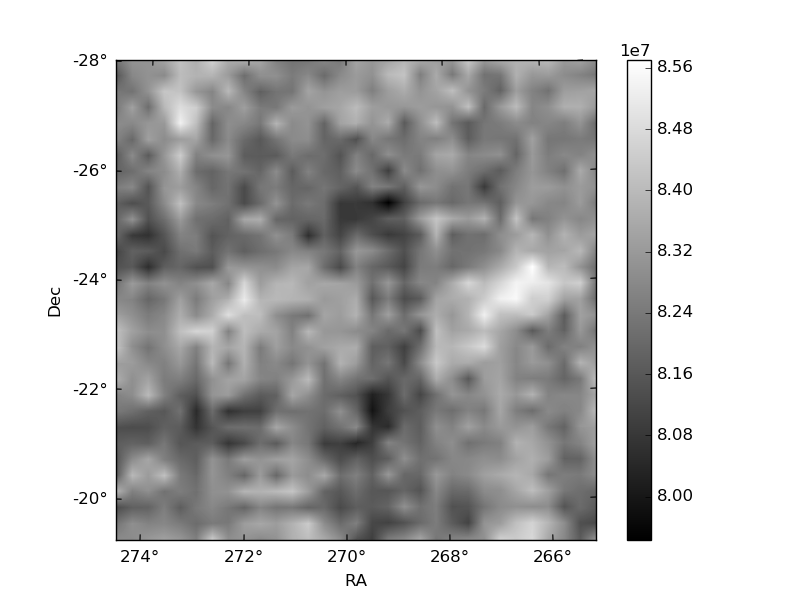
Quadrant B |
|---|---|---|---|
| Quadrant D | 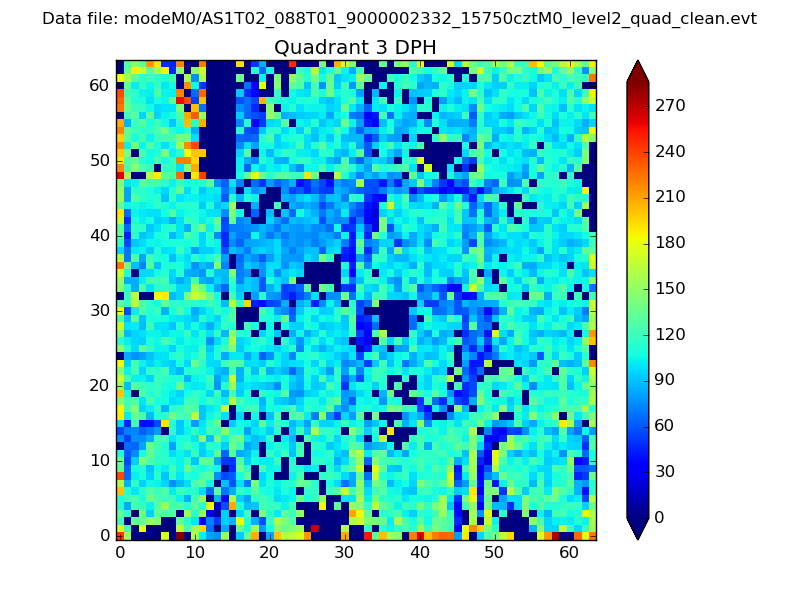 |
 |
Quadrant C |
| Plot type | Count rate plots | Images |
|---|---|---|
| Comparison with Poisson distribution Blue bars denote a histogram of data divided into 1 sec bins. Red curve is a Poisson curve with rate = median count rate of data. |
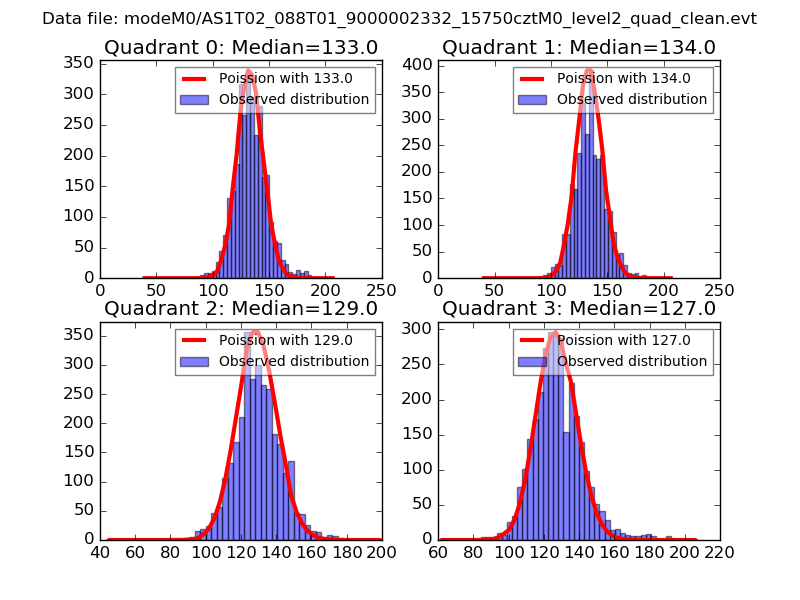 |
 |
| Quadrant-wise count rates Data is divided into 100 sec bins |
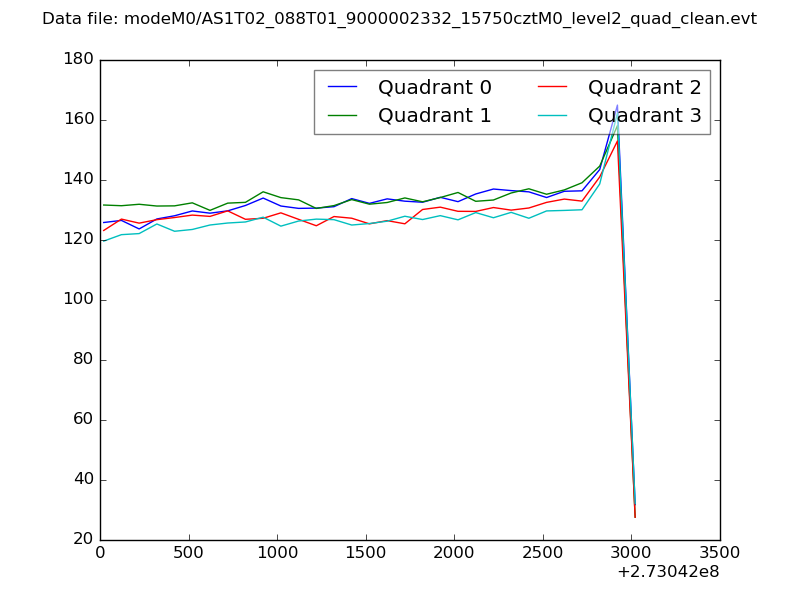 |
|
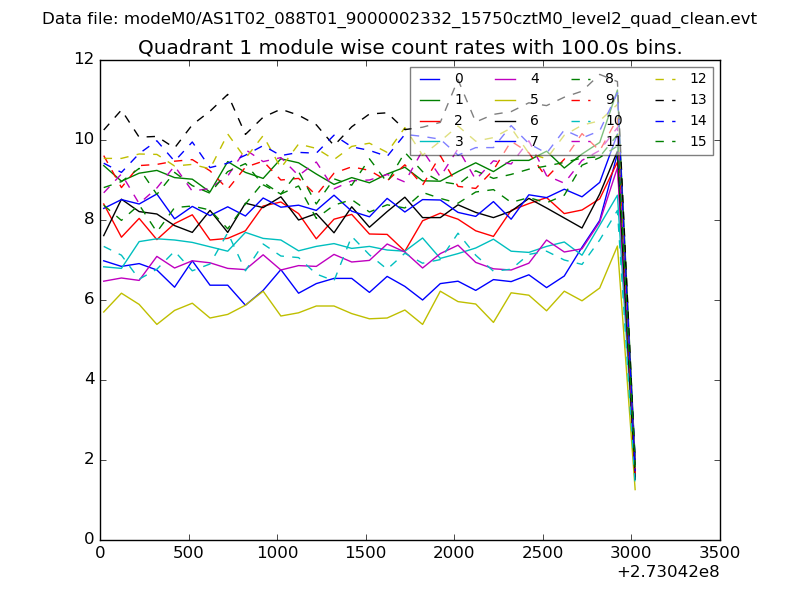
| Module-wise count rates for Quadrant A Data is divided into 100 sec bins |
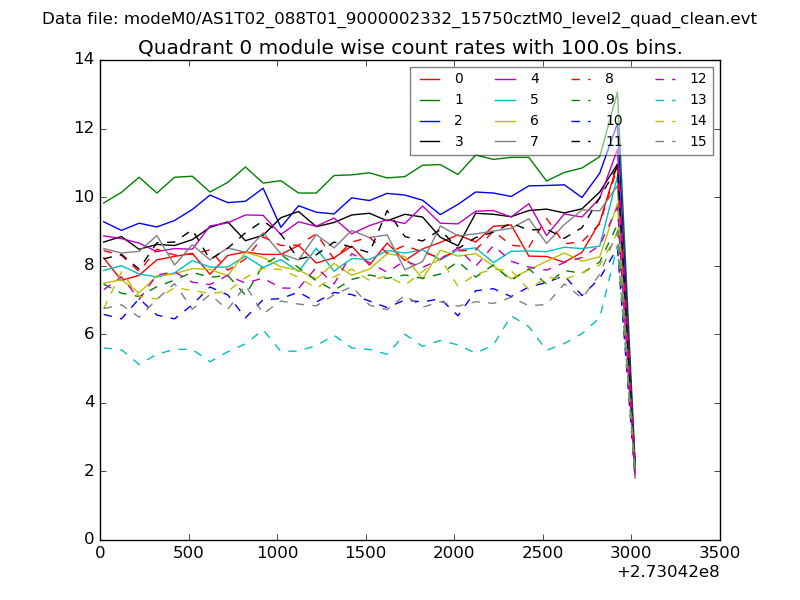 |
 |
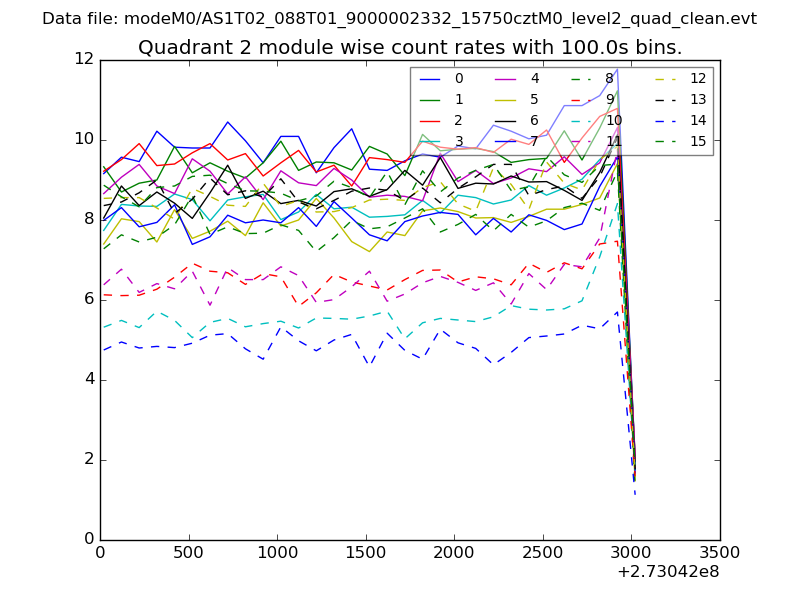
| Module-wise count rates for Quadrant B Data is divided into 100 sec bins |
 |
 |
| Module-wise count rates for Quadrant C Data is divided into 100 sec bins |
 |
 |
| Module-wise count rates for Quadrant D Data is divided into 100 sec bins |
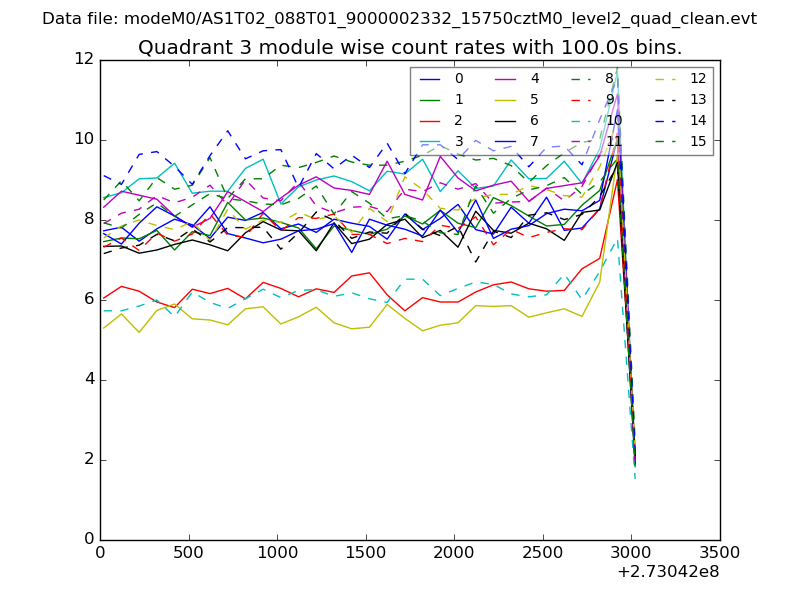 |
 |
| Parameter | Plot |
|---|---|
| CZT HV Monitor | 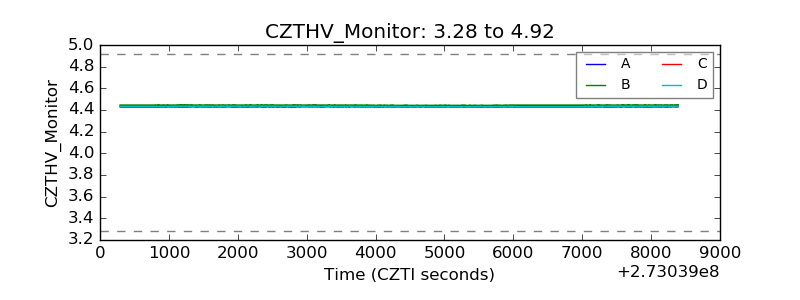 |
| D_VDD | 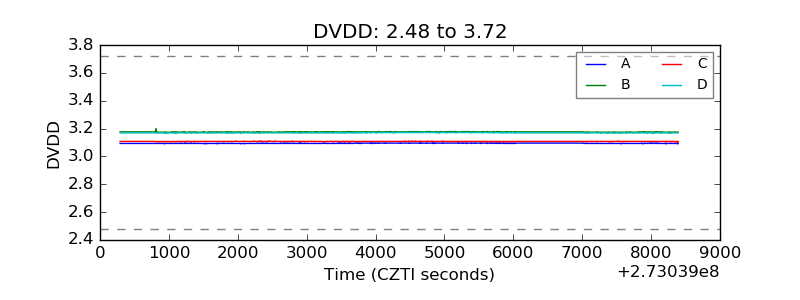 |
| Temperature 1 | 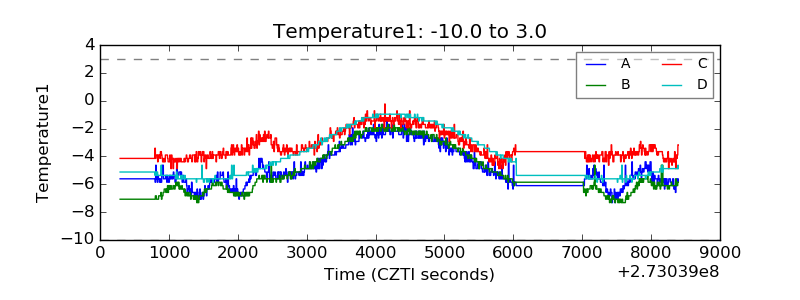 |
| Veto HV Monitor | 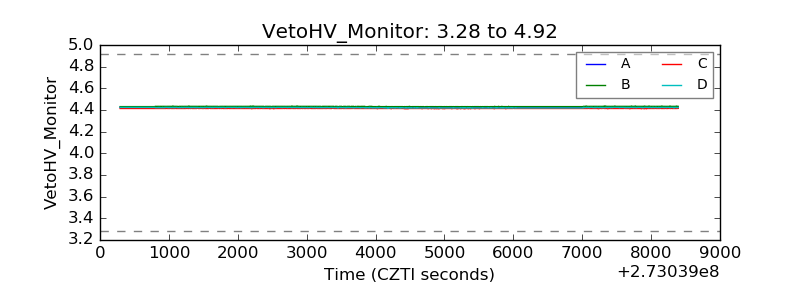 |
| Veto LLD | 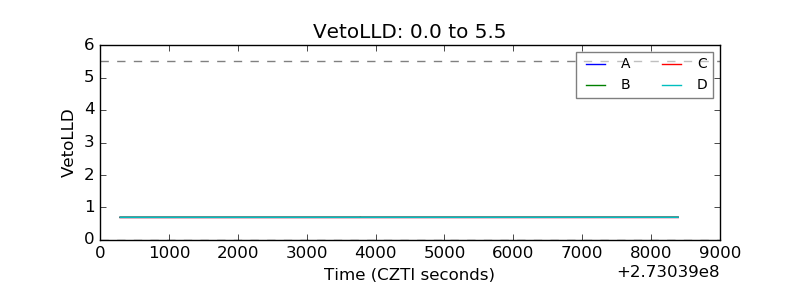 |
| Alpha Counter | 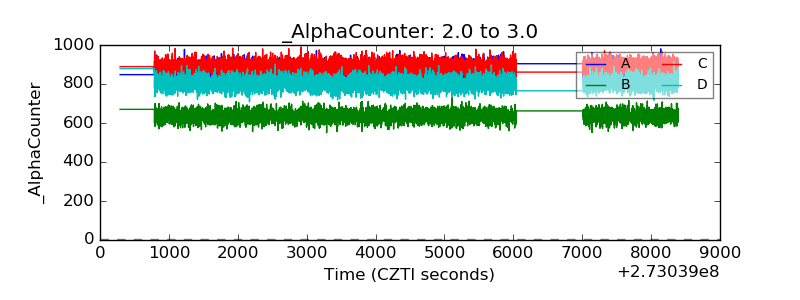 |
| _CPM_Rate | 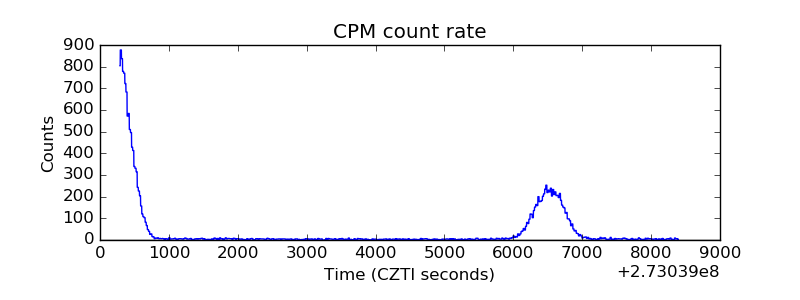 |
| CZT Counter |  |
| +2.5 Volts monitor |  |
| +5 Volts monitor | 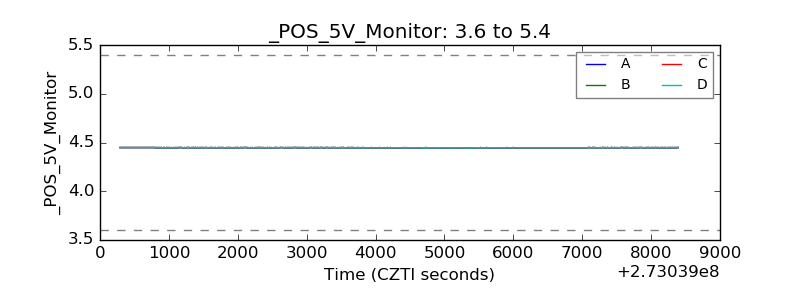 |
| _ROLL_ROT | 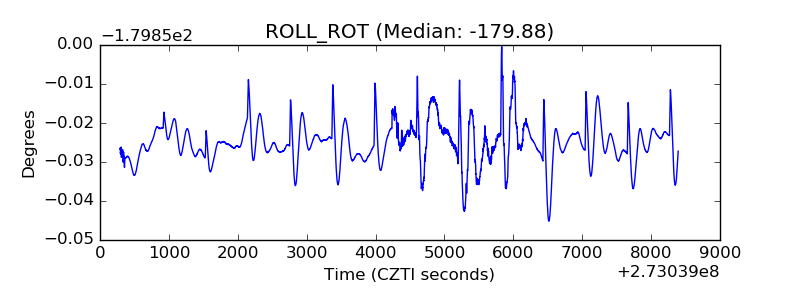 |
| _Roll_DEC | 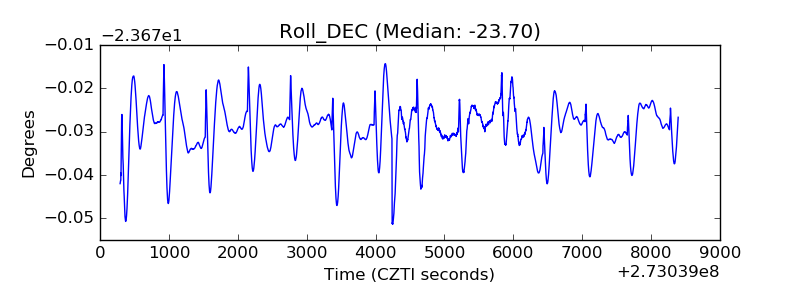 |
| _Roll_RA |  |
| Veto Counter | 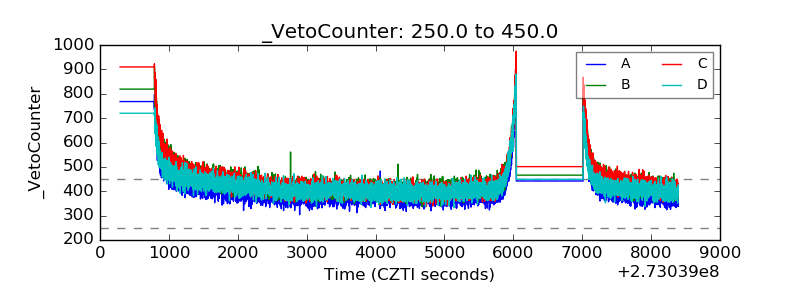 |