| Param | Original file | Final file |
|---|---|---|
| Filename | modeM0/AS1T02_088T01_9000002332_15751cztM0_level2.evt | modeM0/AS1T02_088T01_9000002332_15751cztM0_level2_quad_clean.evt |
| Size (bytes) | 475,606,080 | 76,440,960 |
| Size | 453.6 MB | 72.9 MB |
| Events in quadrant A | 3,484,138 | 459,408 |
| Events in quadrant B | 3,588,330 | 465,974 |
| Events in quadrant C | 3,520,536 | 449,655 |
| Events in quadrant D | 3,323,899 | 441,056 |
| Mode M9 | |||
|---|---|---|---|
| Quadrant | BADHDUFLAG | Total packets | Discarded packets |
| A | 0 | 7 | 0 |
| B | 0 | 7 | 0 |
| C | 0 | 7 | 0 |
| D | 0 | 8 | 0 |
| Mode SS | |||
|---|---|---|---|
| Quadrant | BADHDUFLAG | Total packets | Discarded packets |
| A | 0 | 146 | 0 |
| B | 0 | 146 | 0 |
| C | 0 | 146 | 0 |
| D | 0 | 146 | 0 |
| Mode M0 | |||
|---|---|---|---|
| Quadrant | BADHDUFLAG | Total packets | Discarded packets |
| A | 0 | 14917 | 4 |
| B | 0 | 14994 | 3 |
| C | 0 | 14906 | 3 |
| D | 0 | 14902 | 3 |
| Quadrant | Total seconds | Saturated seconds | Saturation percentage |
|---|---|---|---|
| A | 7155 | 205 | 2.865129% |
| B | 7155 | 231 | 3.228512% |
| C | 7155 | 243 | 3.396226% |
| D | 7155 | 172 | 2.403913% |
Noise dominated data is calculated using 1-second bins in cleaned event files. If a bin has >2000 counts, and if more than 50% of those come from <1% of pixels, then it is considered to be noise-dominated and hence unusable.
| Quadrant | # 1 sec bins | Bins with >0 counts | Bins with >2000 counts | High rate bins dominated by noise | Noise dominated (total time) | Noise dominated (detector-on time) | Marked lightcurve |
|---|---|---|---|---|---|---|---|
| A | 7681 | 7158 | 0 | 0 | 0.00% | 0.00% | 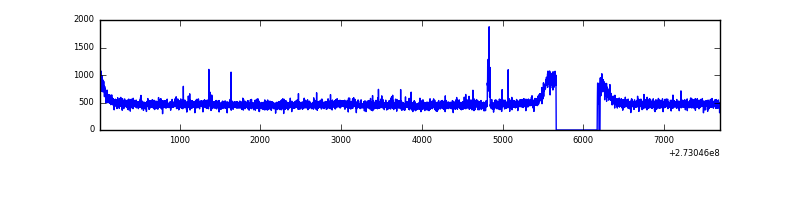 |
| B | 7681 | 7158 | 7 | 7 | 0.09% | 0.10% | 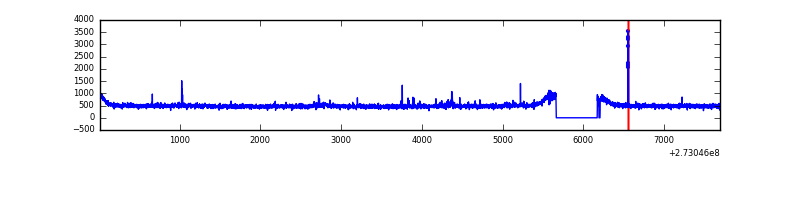 |
| C | 7681 | 7158 | 0 | 0 | 0.00% | 0.00% | 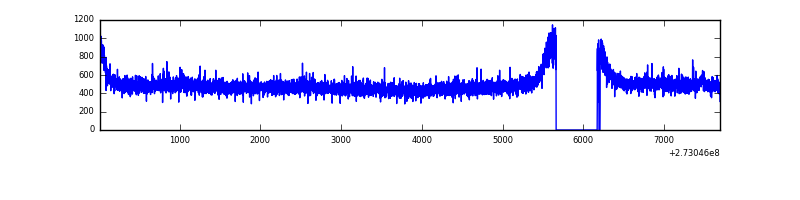 |
| D | 7681 | 7158 | 2 | 2 | 0.03% | 0.03% | 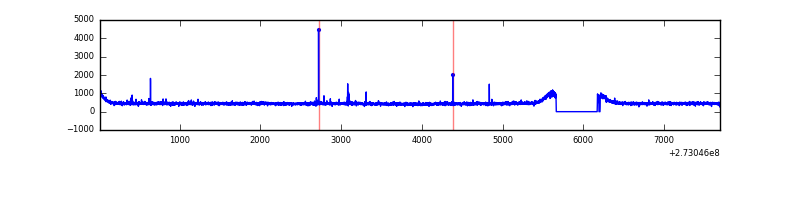 |
Top three noisy pixels from each quadrant. If the there are fewer than three noisy pixels in the level2.evt file, extra rows are filled as -1
| Pixel properties | Quadrant properties | ||||||
|---|---|---|---|---|---|---|---|
| Quadrant | DetID | PixID | Counts | Sigma | Mean | Median | Sigma |
| A | 3 | 80 | 34894 | 188.42 | 891 | 872 | 180.6 |
| A | 15 | 174 | 18689 | 98.67 | 891 | 872 | 180.6 |
| A | 0 | 226 | 7693 | 37.78 | 891 | 872 | 180.6 |
| B | 0 | 189 | 28929 | 161.34 | 892 | 871 | 173.9 |
| B | 3 | 64 | 27604 | 153.72 | 892 | 871 | 173.9 |
| B | 12 | 111 | 20813 | 114.67 | 892 | 871 | 173.9 |
| C | 14 | 238 | 129706 | 633.83 | 859 | 865 | 203.3 |
| C | 3 | 233 | 32032 | 153.33 | 859 | 865 | 203.3 |
| C | 13 | 61 | 5914 | 24.84 | 859 | 865 | 203.3 |
| D | 2 | 234 | 26544 | 119.92 | 867 | 839 | 214.3 |
| D | 1 | 52 | 22686 | 101.92 | 867 | 839 | 214.3 |
| D | 10 | 70 | 14599 | 64.2 | 867 | 839 | 214.3 |
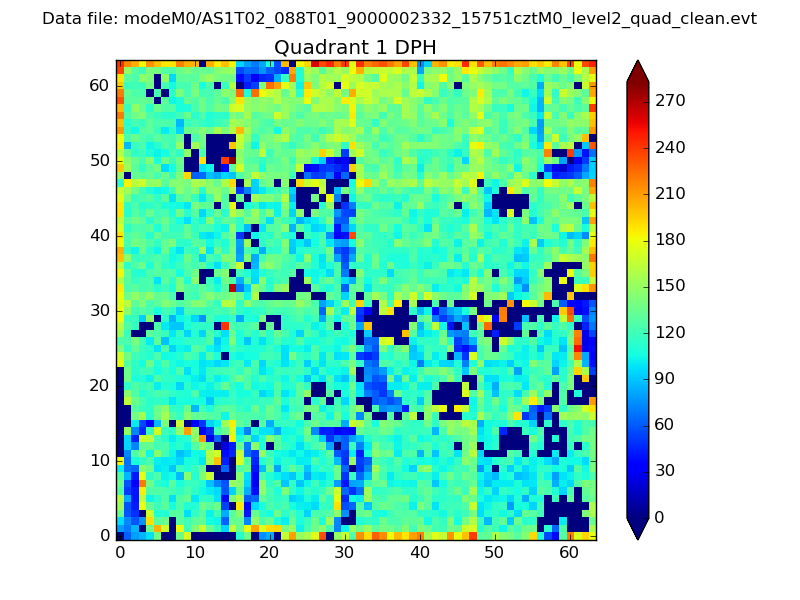
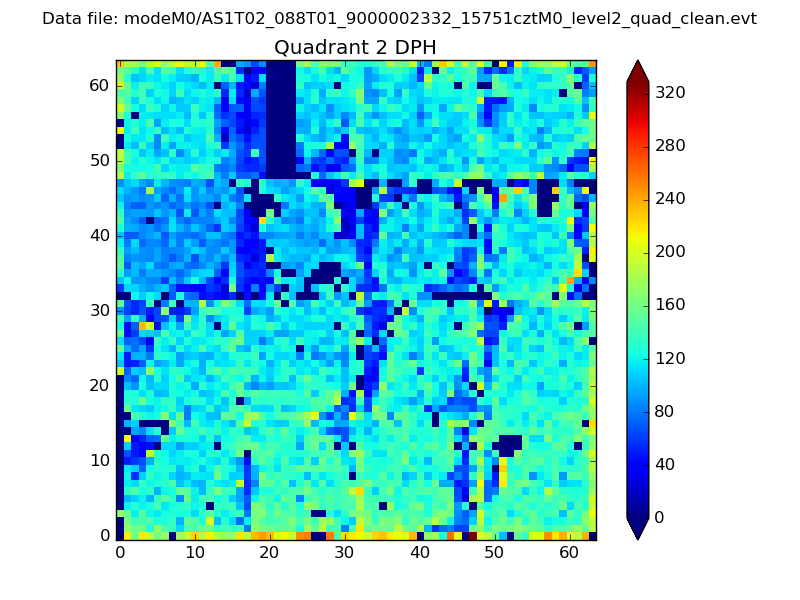
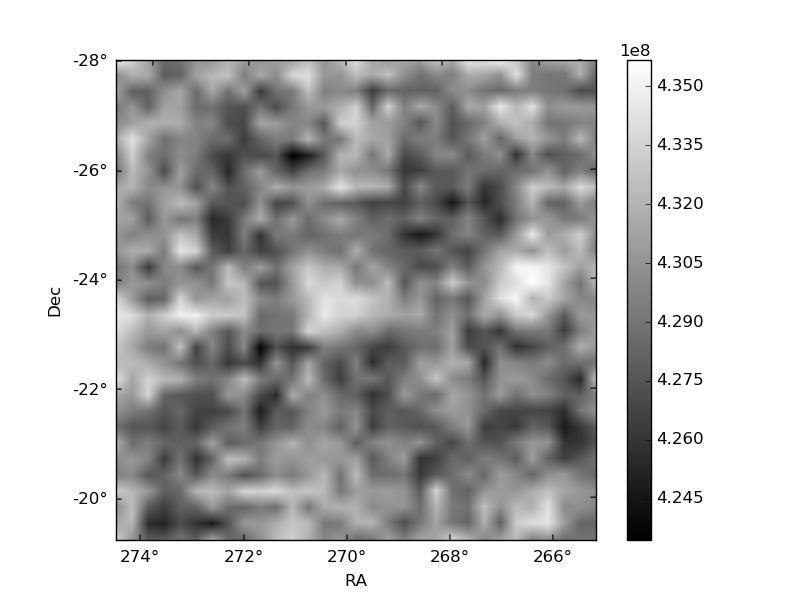
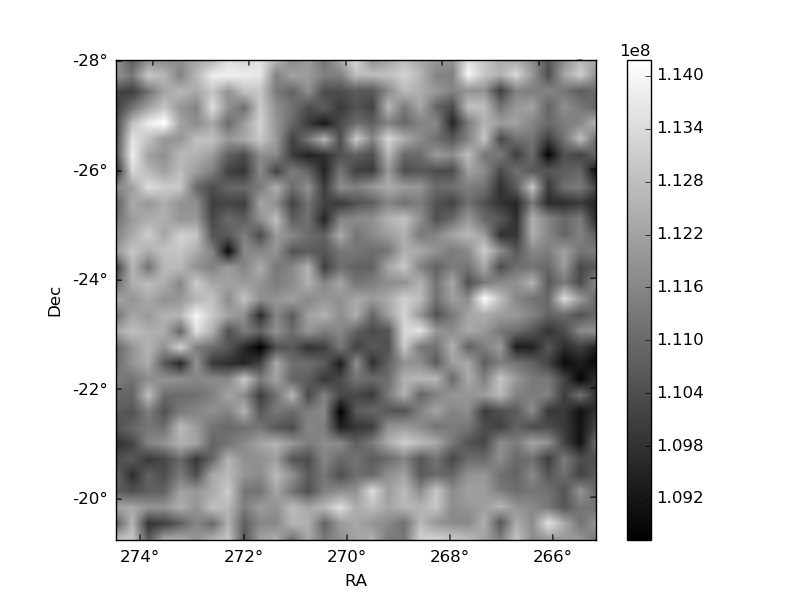
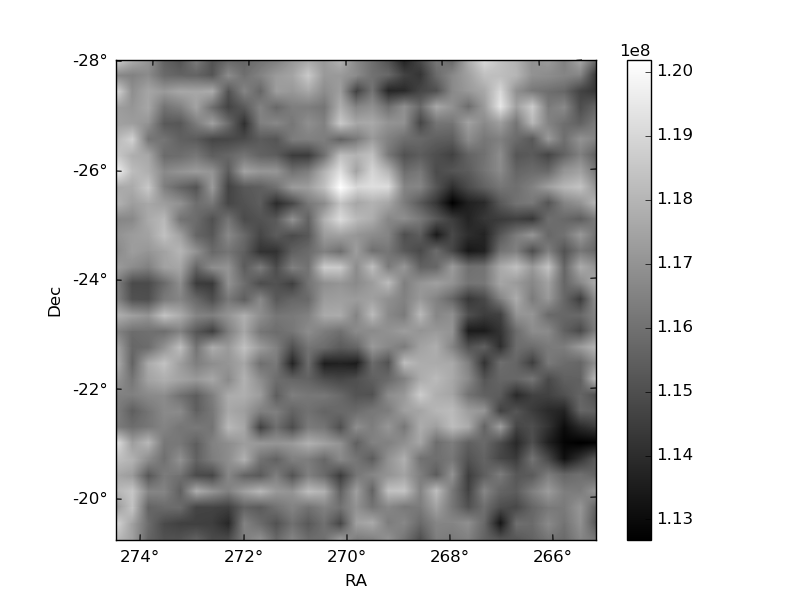
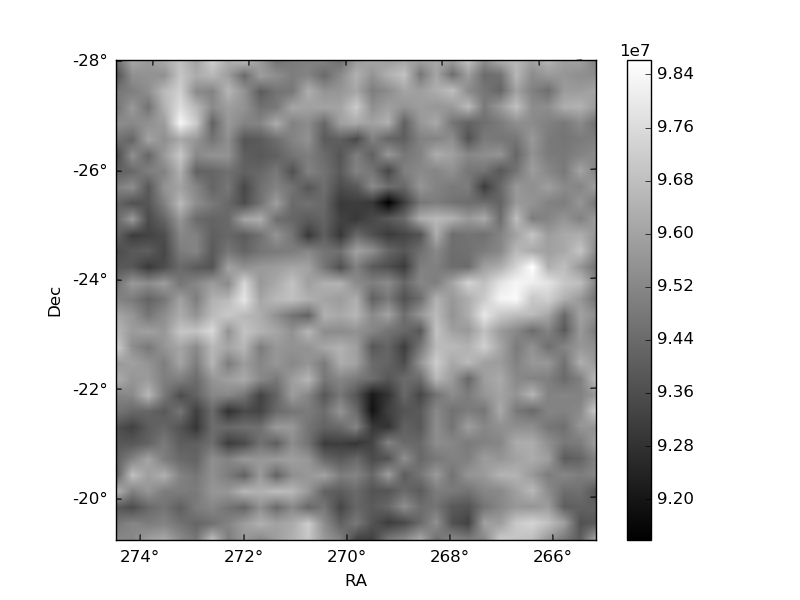
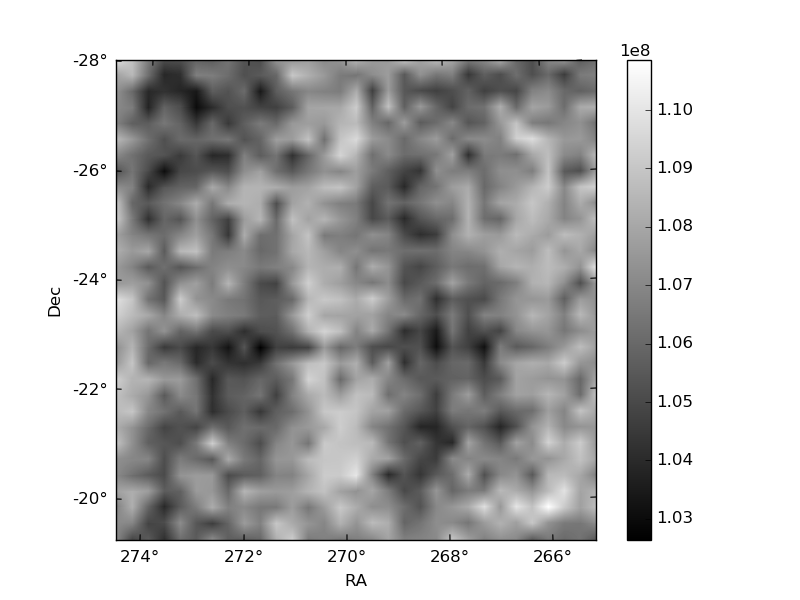
Histogram calculated using DETX and DETY for each event in the final _common_clean file
| Quadrant A | 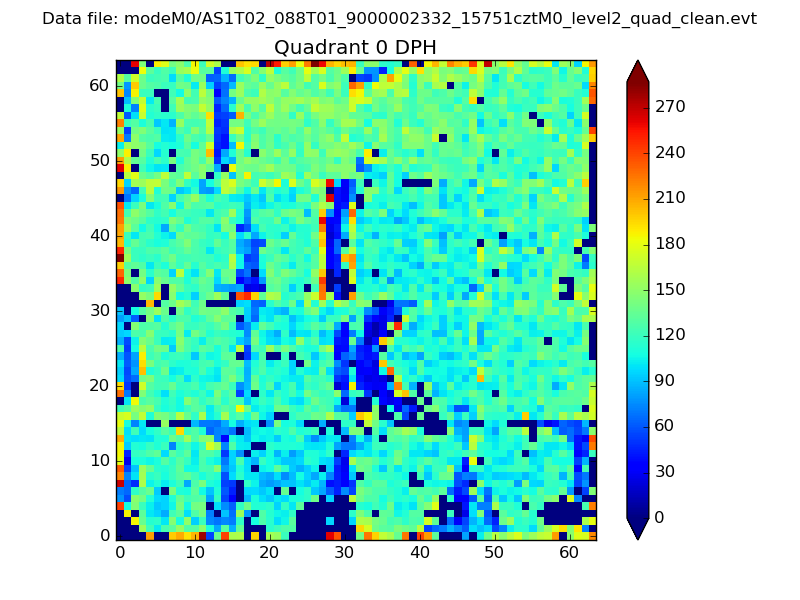 |
 |
Quadrant B |
|---|---|---|---|
| Quadrant D |  |
 |
Quadrant C |
| Plot type | Count rate plots | Images |
|---|---|---|
| Comparison with Poisson distribution Blue bars denote a histogram of data divided into 1 sec bins. Red curve is a Poisson curve with rate = median count rate of data. |
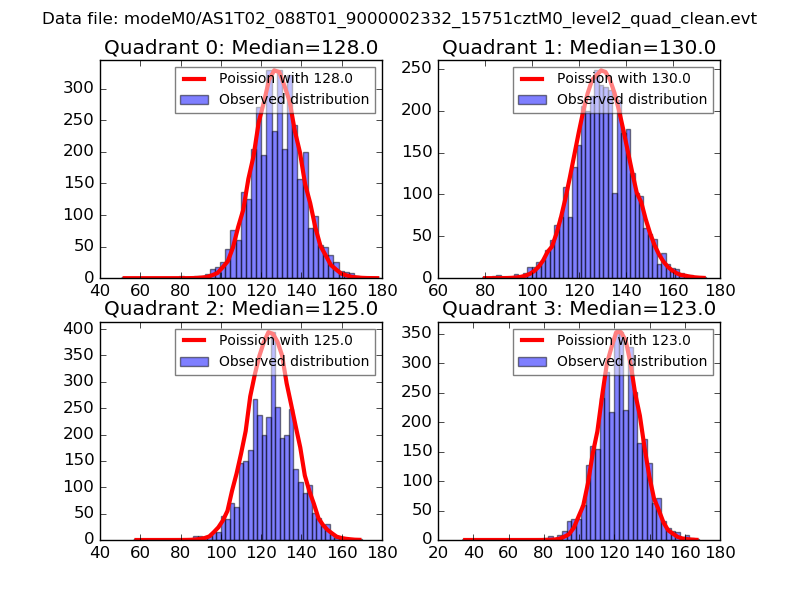 |
 |
| Quadrant-wise count rates Data is divided into 100 sec bins |
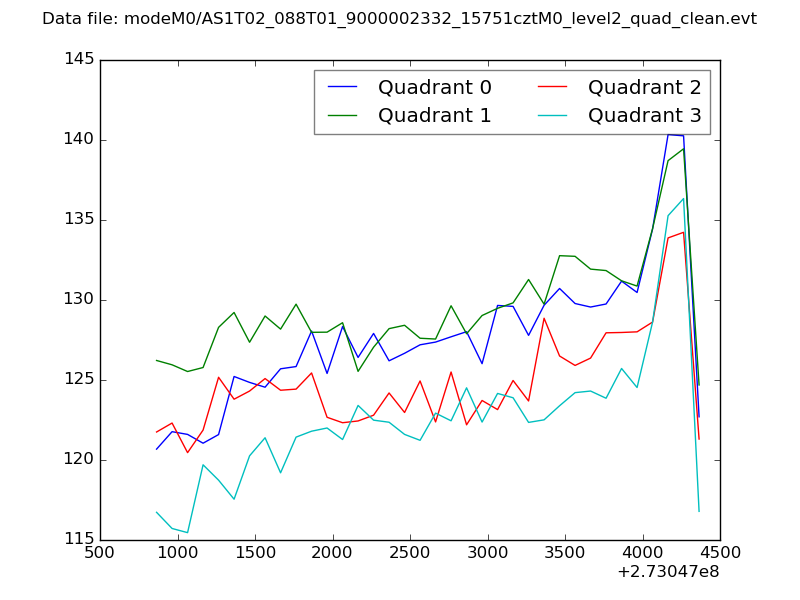 |
|
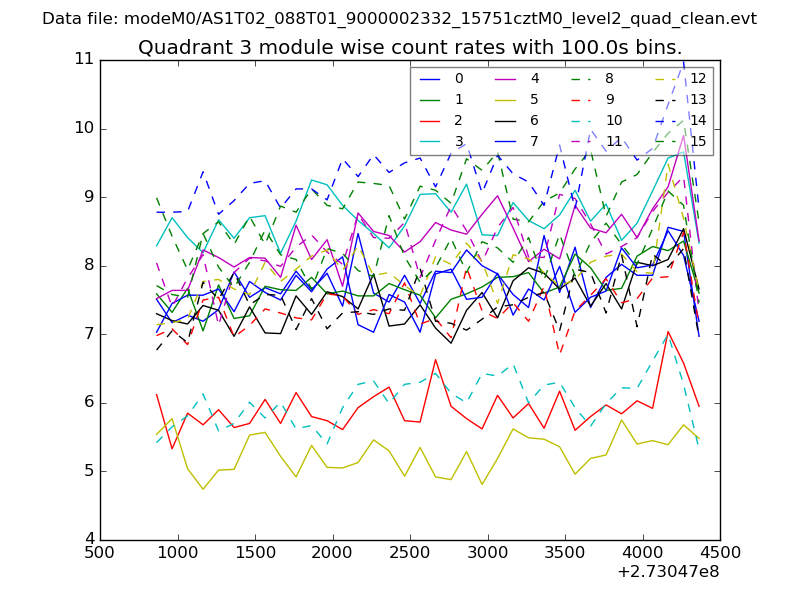
| Module-wise count rates for Quadrant A Data is divided into 100 sec bins |
 |
 |
| Module-wise count rates for Quadrant B Data is divided into 100 sec bins |
 |
 |
| Module-wise count rates for Quadrant C Data is divided into 100 sec bins |
 |
 |
| Module-wise count rates for Quadrant D Data is divided into 100 sec bins |
 |
 |
| Parameter | Plot |
|---|---|
| CZT HV Monitor | 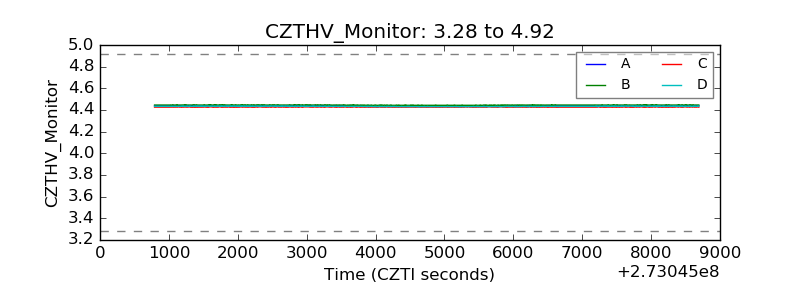 |
| D_VDD | 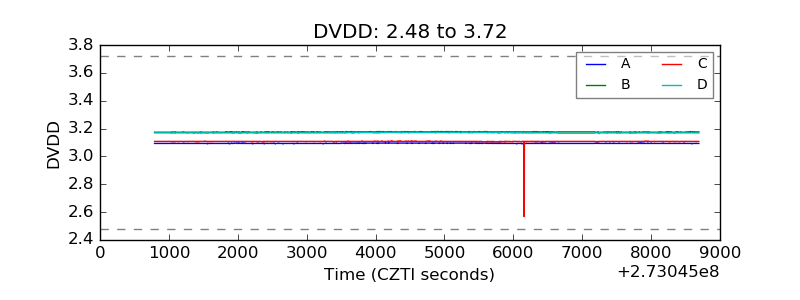 |
| Temperature 1 | 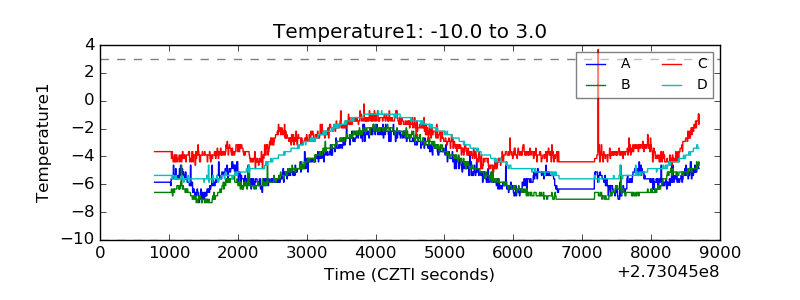 |
| Veto HV Monitor | 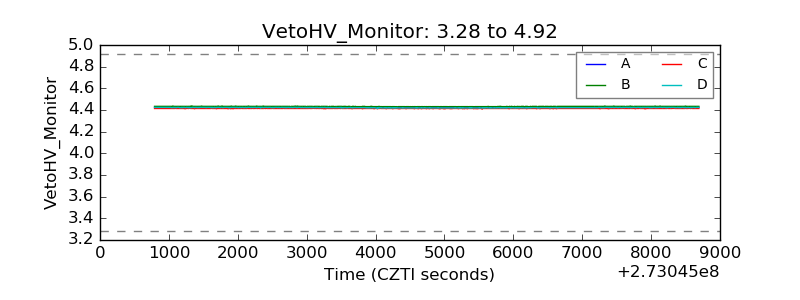 |
| Veto LLD | 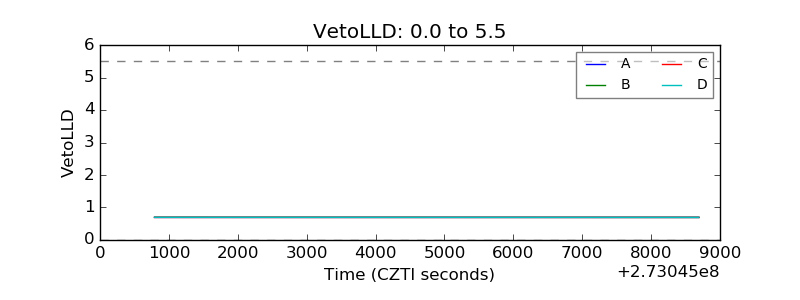 |
| Alpha Counter | 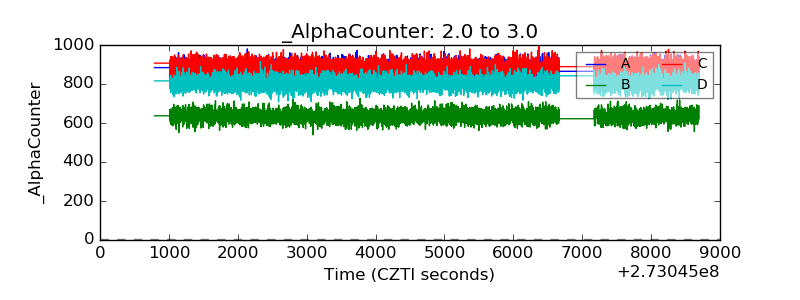 |
| _CPM_Rate | 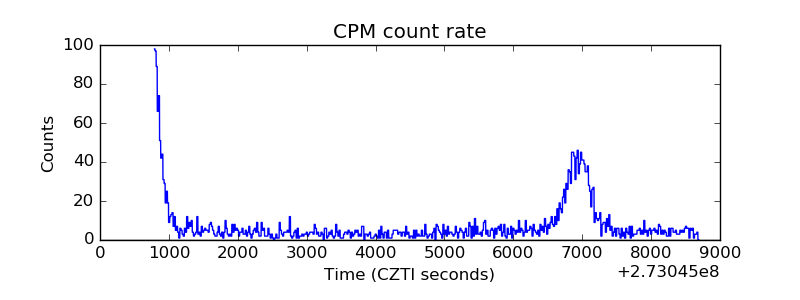 |
| CZT Counter | 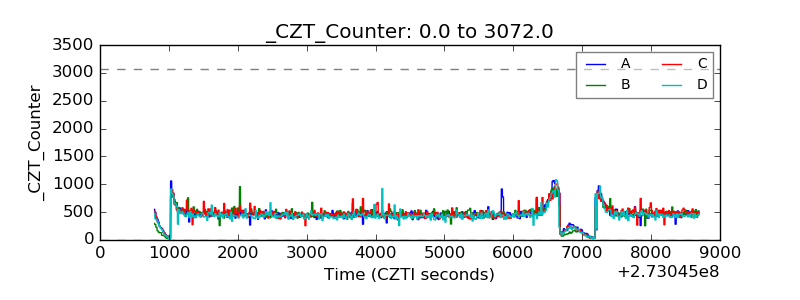 |
| +2.5 Volts monitor |  |
| +5 Volts monitor | 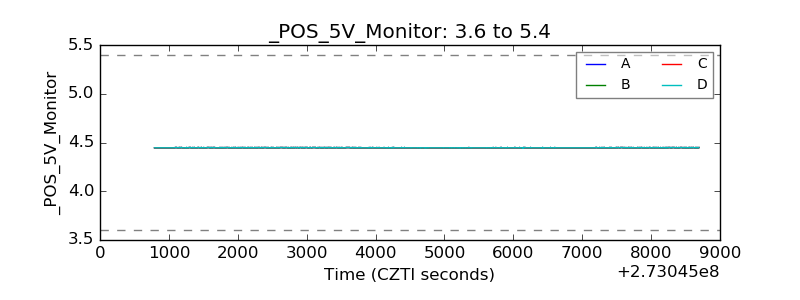 |
| _ROLL_ROT | 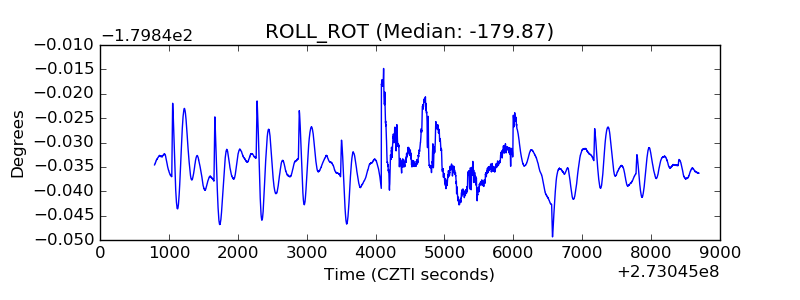 |
| _Roll_DEC | 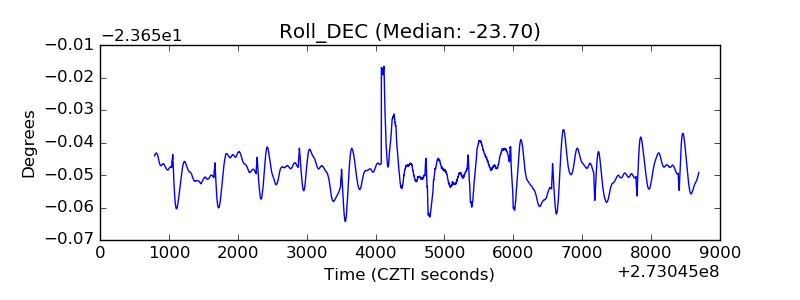 |
| _Roll_RA | 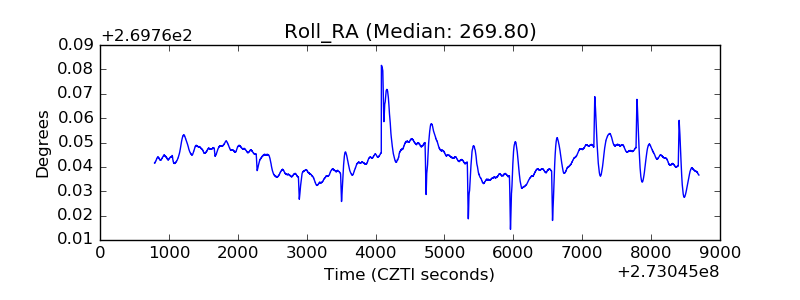 |
| Veto Counter | 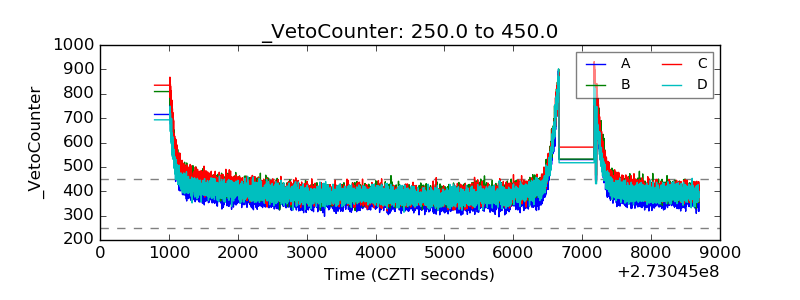 |