| Param | Original file | Final file |
|---|---|---|
| Filename | modeM0/AS1T02_088T01_9000002332_15753cztM0_level2.evt | modeM0/AS1T02_088T01_9000002332_15753cztM0_level2_quad_clean.evt |
| Size (bytes) | 545,503,680 | 90,604,800 |
| Size | 520.2 MB | 86.4 MB |
| Events in quadrant A | 4,016,096 | 552,830 |
| Events in quadrant B | 4,116,694 | 559,299 |
| Events in quadrant C | 3,960,697 | 541,994 |
| Events in quadrant D | 3,879,311 | 529,383 |
| Mode M9 | |||
|---|---|---|---|
| Quadrant | BADHDUFLAG | Total packets | Discarded packets |
| A | 0 | 2 | 0 |
| B | 0 | 2 | 0 |
| C | 0 | 2 | 0 |
| D | 0 | 2 | 0 |
| Mode SS | |||
|---|---|---|---|
| Quadrant | BADHDUFLAG | Total packets | Discarded packets |
| A | 0 | 168 | 0 |
| B | 0 | 168 | 0 |
| C | 0 | 168 | 0 |
| D | 0 | 168 | 0 |
| Mode M0 | |||
|---|---|---|---|
| Quadrant | BADHDUFLAG | Total packets | Discarded packets |
| A | 0 | 17253 | 5 |
| B | 0 | 17195 | 4 |
| C | 0 | 16986 | 4 |
| D | 0 | 17058 | 4 |
| Quadrant | Total seconds | Saturated seconds | Saturation percentage |
|---|---|---|---|
| A | 8050 | 441 | 5.478261% |
| B | 8050 | 443 | 5.503106% |
| C | 8050 | 433 | 5.378882% |
| D | 8050 | 362 | 4.496894% |
Noise dominated data is calculated using 1-second bins in cleaned event files. If a bin has >2000 counts, and if more than 50% of those come from <1% of pixels, then it is considered to be noise-dominated and hence unusable.
| Quadrant | # 1 sec bins | Bins with >0 counts | Bins with >2000 counts | High rate bins dominated by noise | Noise dominated (total time) | Noise dominated (detector-on time) | Marked lightcurve |
|---|---|---|---|---|---|---|---|
| A | 8386 | 8056 | 5 | 5 | 0.06% | 0.06% | 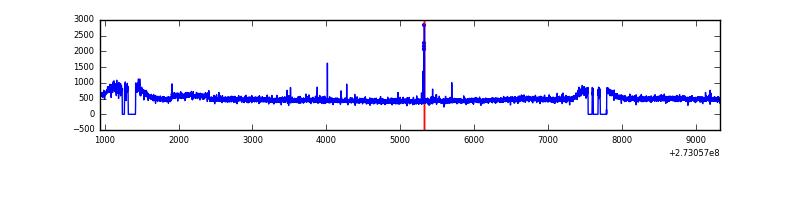 |
| B | 8386 | 8055 | 1 | 1 | 0.01% | 0.01% | 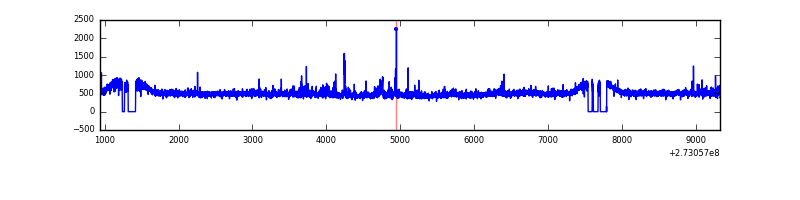 |
| C | 8386 | 8055 | 0 | 0 | 0.00% | 0.00% | 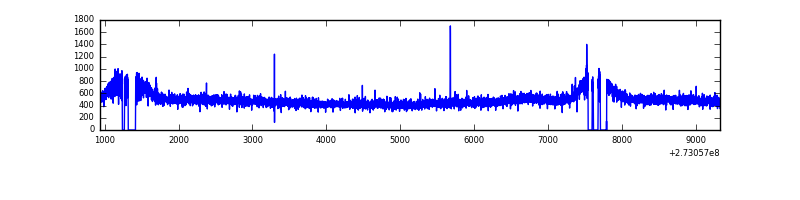 |
| D | 8386 | 8056 | 4 | 4 | 0.05% | 0.05% | 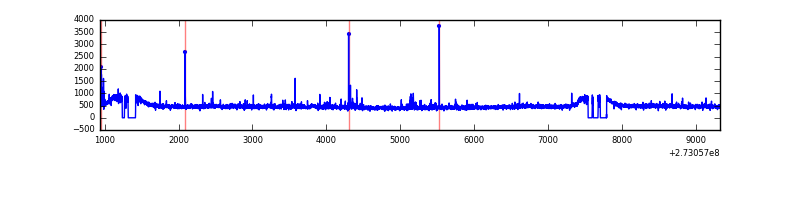 |
Top three noisy pixels from each quadrant. If the there are fewer than three noisy pixels in the level2.evt file, extra rows are filled as -1
| Pixel properties | Quadrant properties | ||||||
|---|---|---|---|---|---|---|---|
| Quadrant | DetID | PixID | Counts | Sigma | Mean | Median | Sigma |
| A | 15 | 239 | 108195 | 516.23 | 1009 | 984 | 207.7 |
| A | 15 | 69 | 16021 | 72.4 | 1009 | 984 | 207.7 |
| A | 0 | 226 | 9039 | 38.79 | 1009 | 984 | 207.7 |
| B | 3 | 209 | 51601 | 257.28 | 1008 | 979 | 196.8 |
| B | 12 | 111 | 23391 | 113.91 | 1008 | 979 | 196.8 |
| B | 11 | 111 | 20297 | 98.18 | 1008 | 979 | 196.8 |
| C | 14 | 238 | 145342 | 634.1 | 970 | 974 | 227.7 |
| C | 4 | 238 | 12246 | 49.51 | 970 | 974 | 227.7 |
| C | 10 | 187 | 8224 | 31.84 | 970 | 974 | 227.7 |
| D | 1 | 52 | 96776 | 393.67 | 989 | 955 | 243.4 |
| D | 2 | 234 | 31456 | 125.31 | 989 | 955 | 243.4 |
| D | 10 | 70 | 17109 | 66.37 | 989 | 955 | 243.4 |
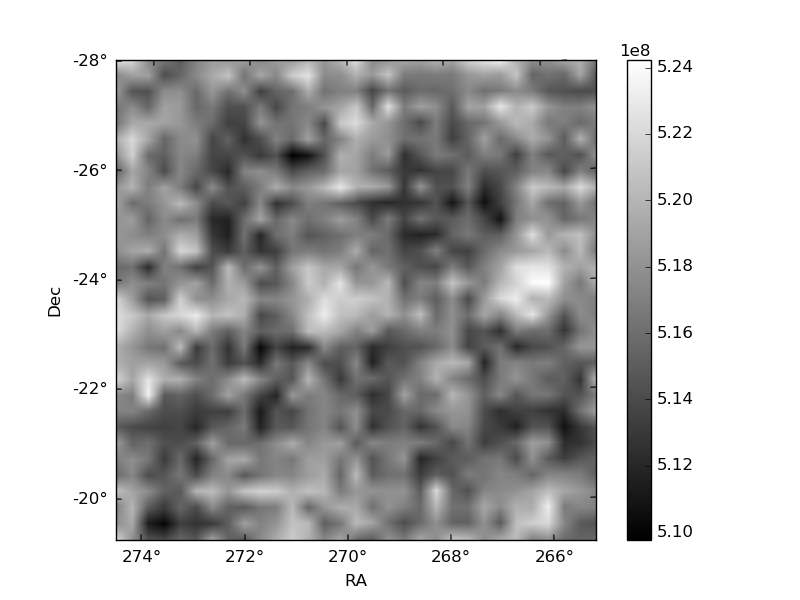
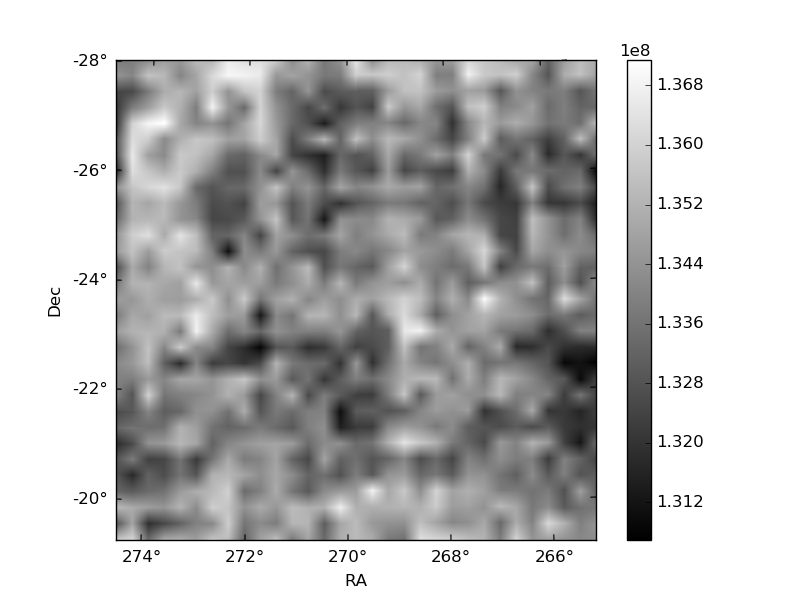
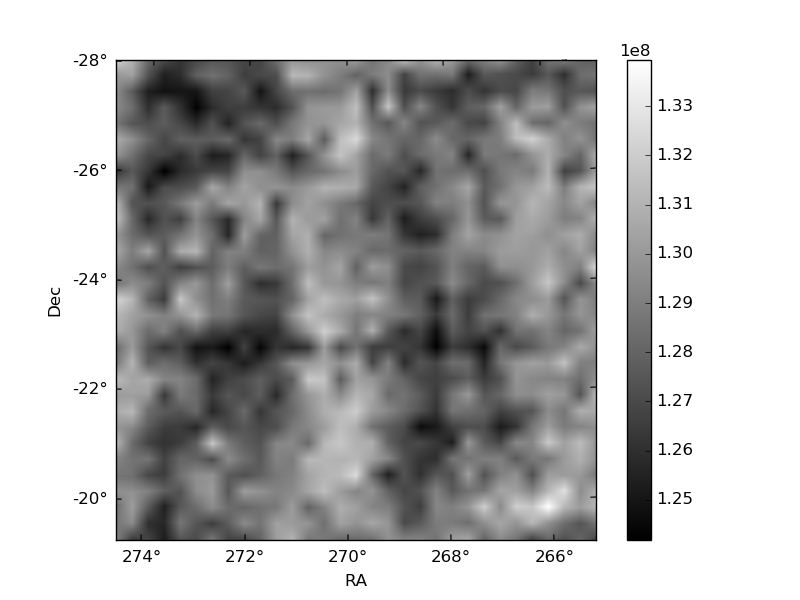
Histogram calculated using DETX and DETY for each event in the final _common_clean file
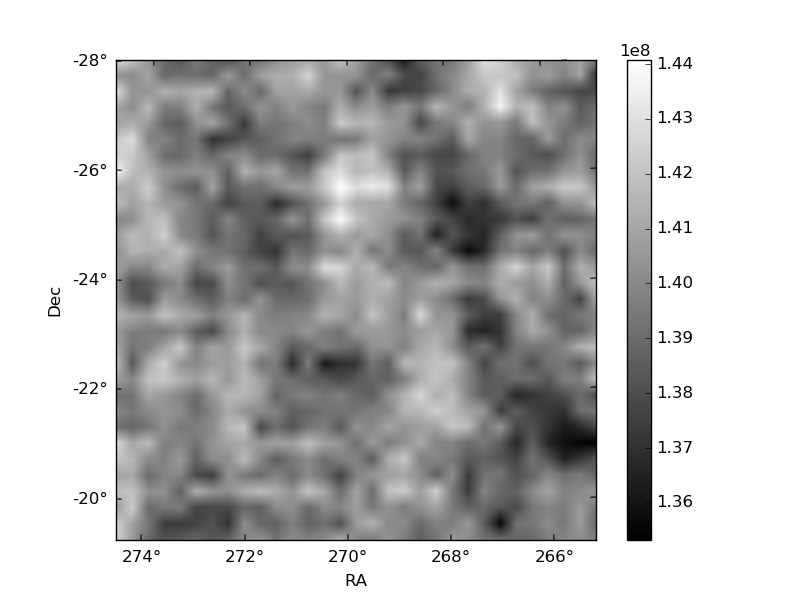
| Quadrant A | 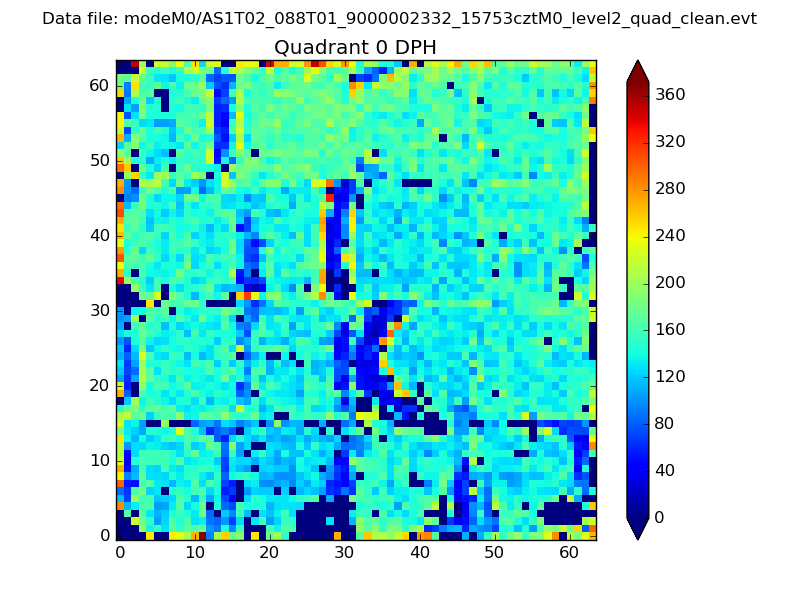 |
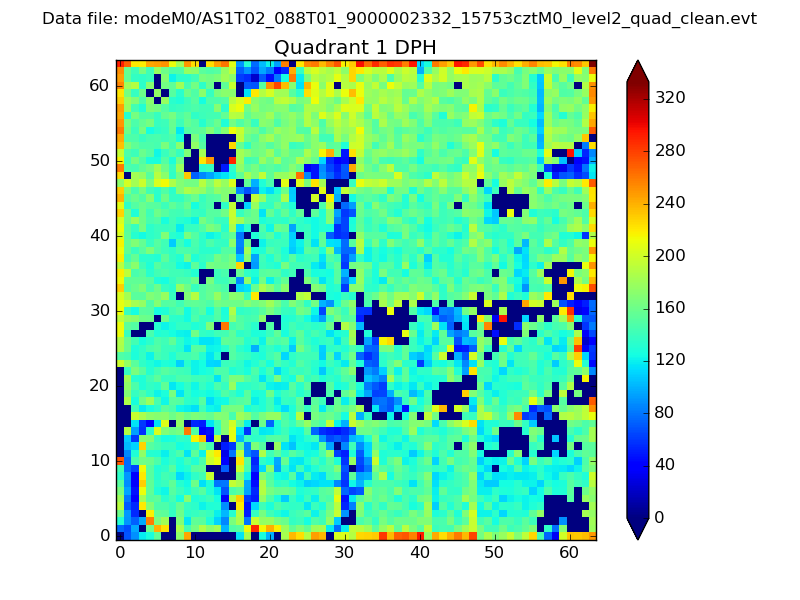 |
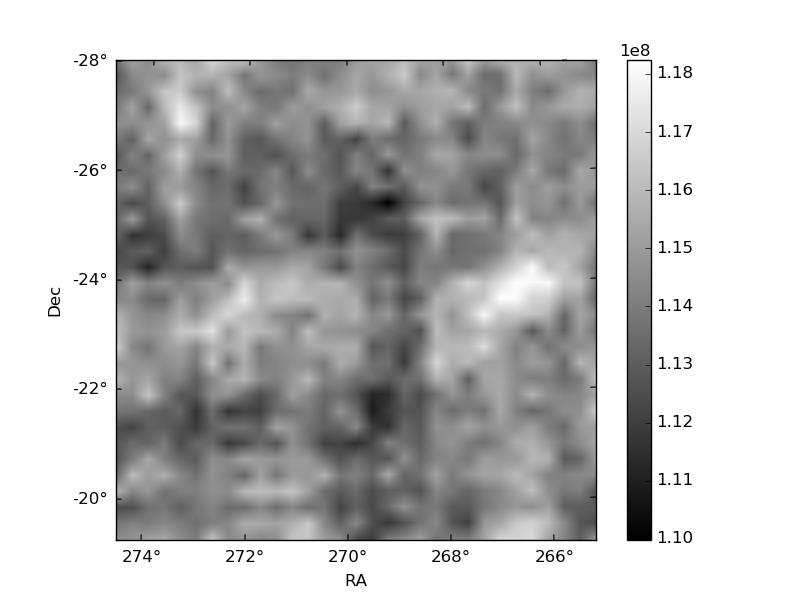
Quadrant B |
|---|---|---|---|
| Quadrant D |  |
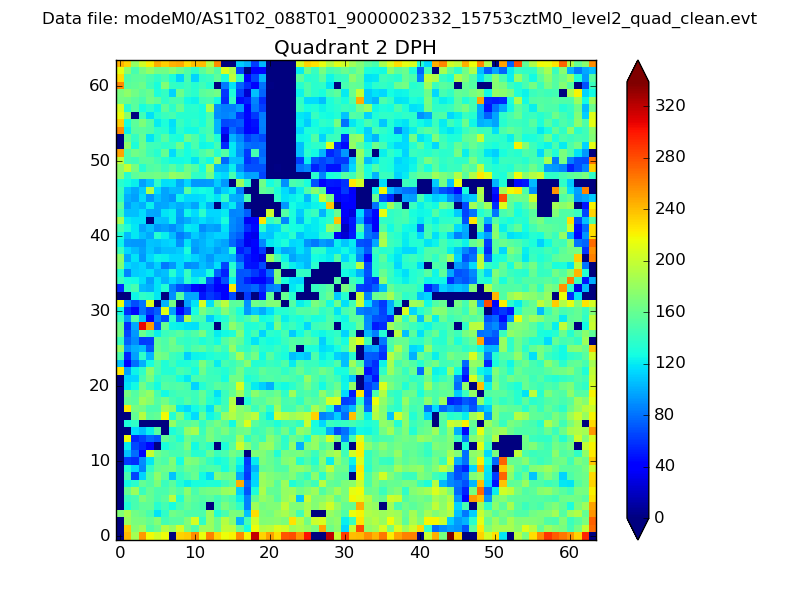 |
Quadrant C |
| Plot type | Count rate plots | Images |
|---|---|---|
| Comparison with Poisson distribution Blue bars denote a histogram of data divided into 1 sec bins. Red curve is a Poisson curve with rate = median count rate of data. |
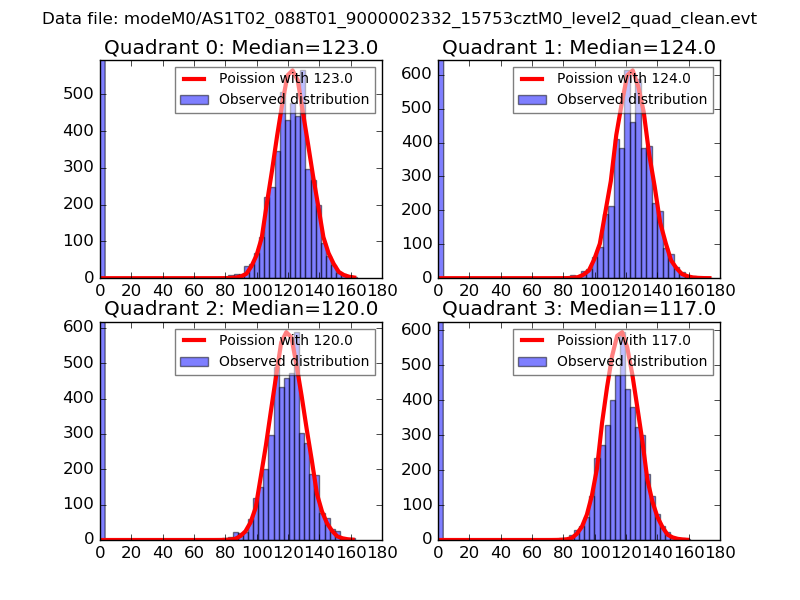 |
 |
| Quadrant-wise count rates Data is divided into 100 sec bins |
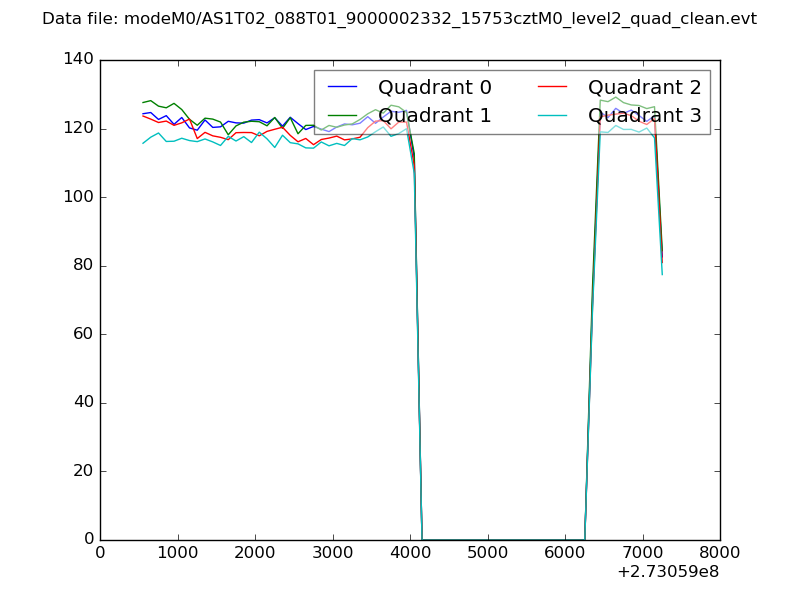 |
|
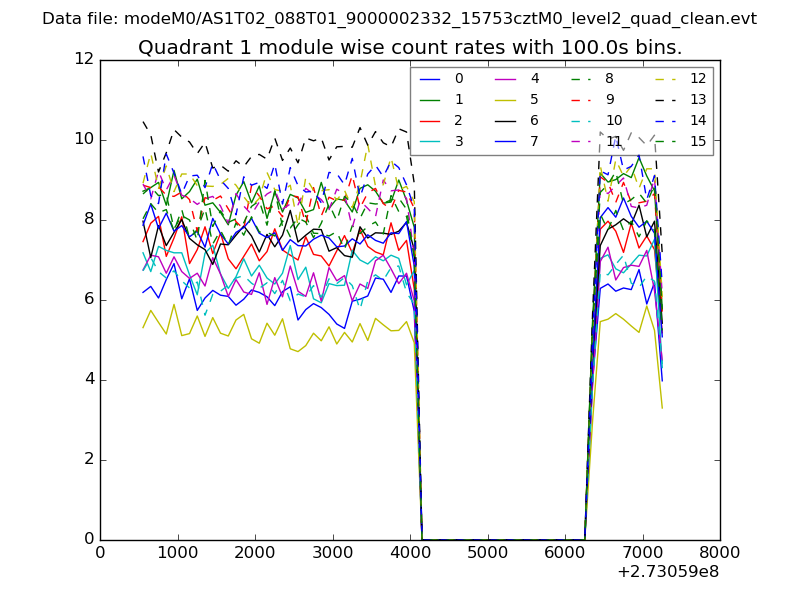
| Module-wise count rates for Quadrant A Data is divided into 100 sec bins |
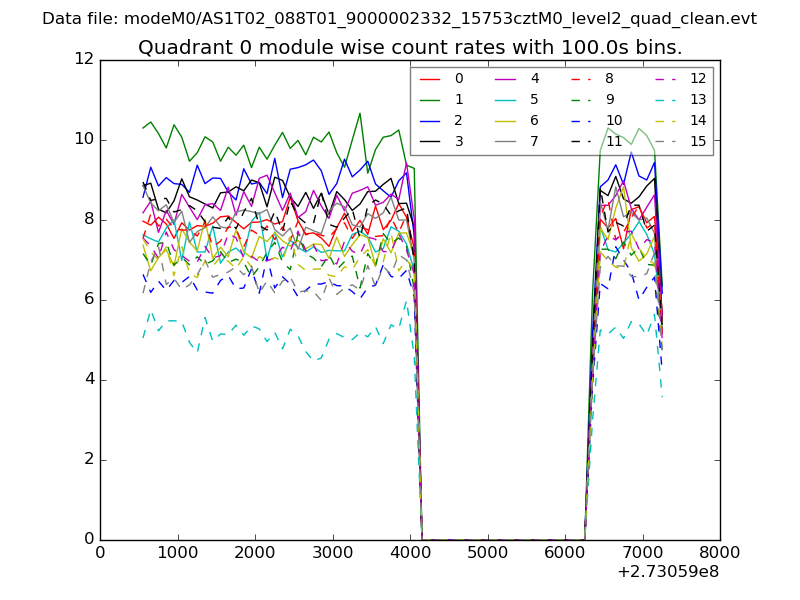 |
 |
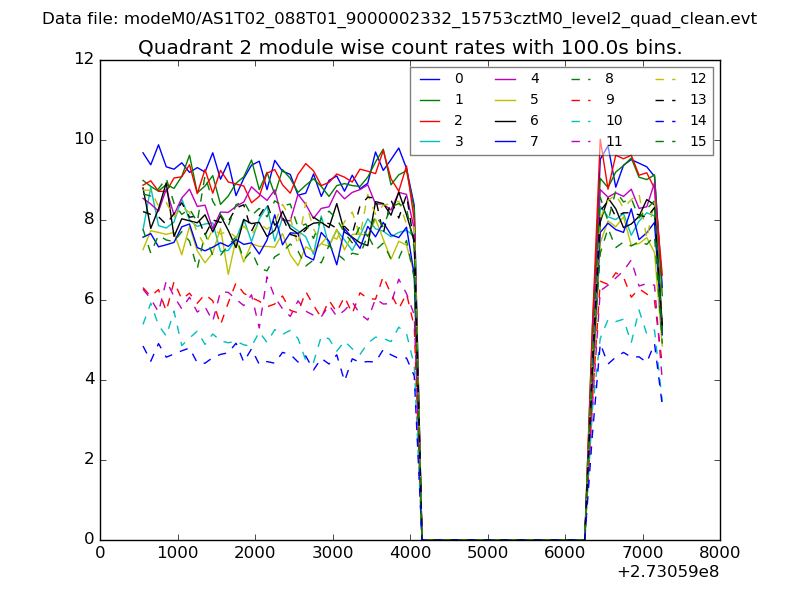
| Module-wise count rates for Quadrant B Data is divided into 100 sec bins |
 |
 |
| Module-wise count rates for Quadrant C Data is divided into 100 sec bins |
 |
 |
| Module-wise count rates for Quadrant D Data is divided into 100 sec bins |
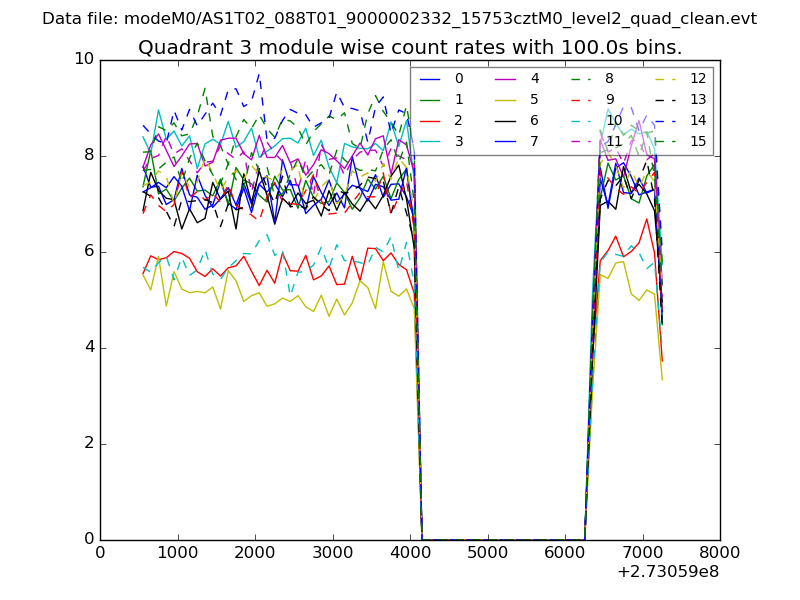 |
 |
| Parameter | Plot |
|---|---|
| CZT HV Monitor | 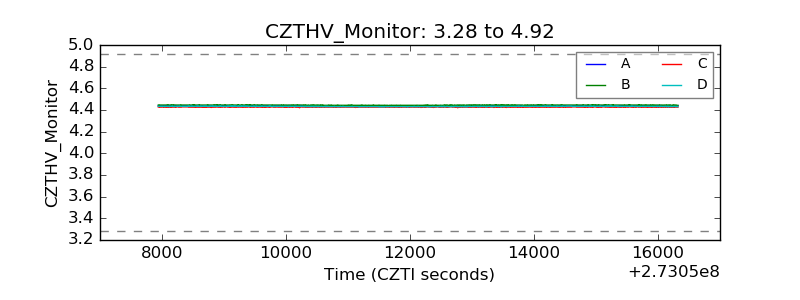 |
| D_VDD | 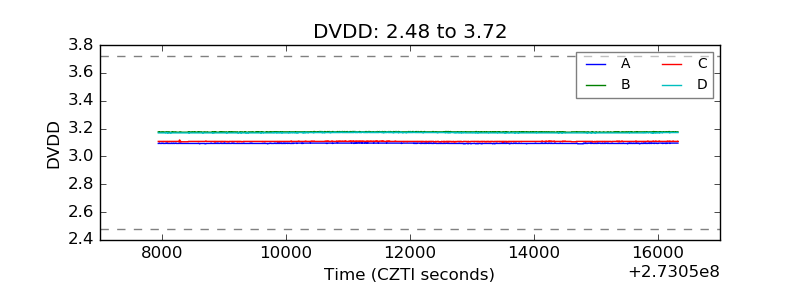 |
| Temperature 1 | 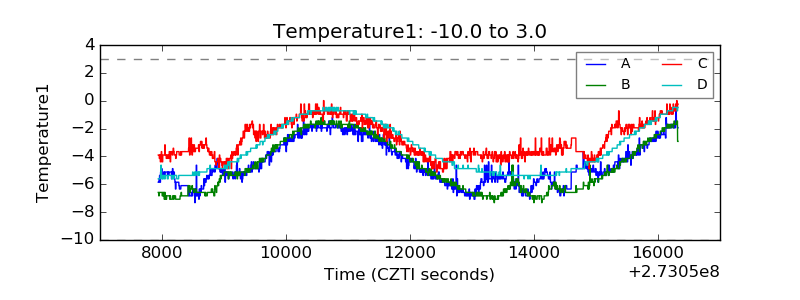 |
| Veto HV Monitor | 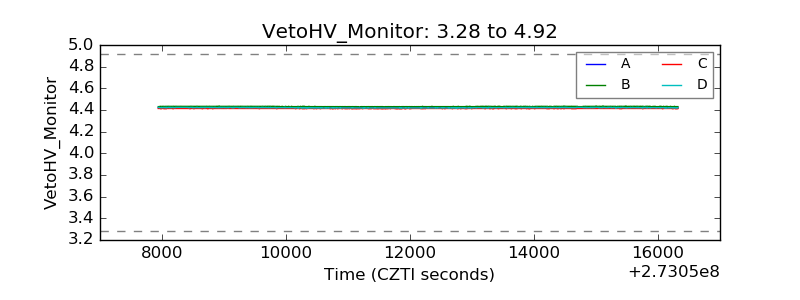 |
| Veto LLD | 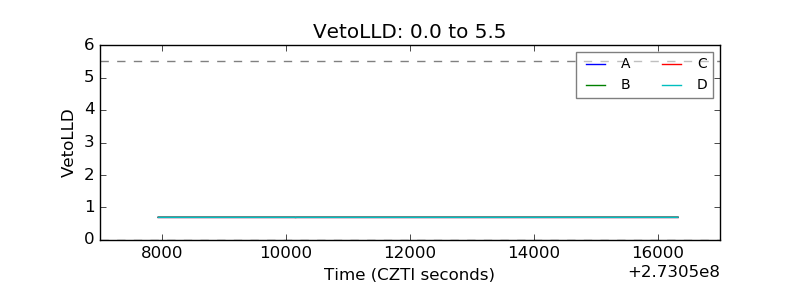 |
| Alpha Counter | 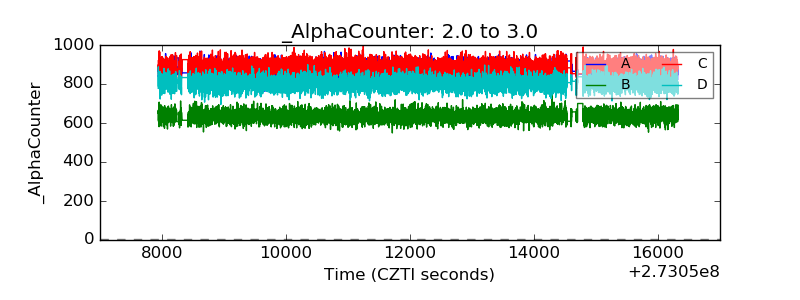 |
| _CPM_Rate | 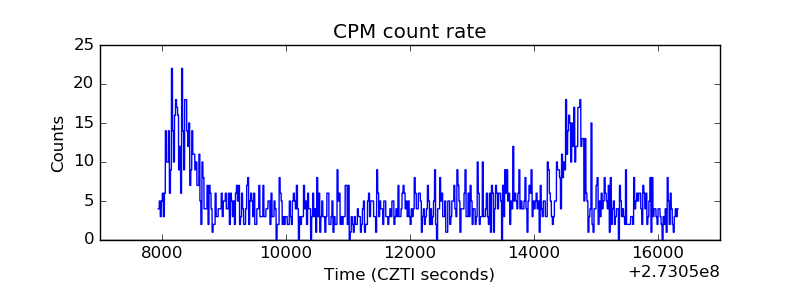 |
| CZT Counter | 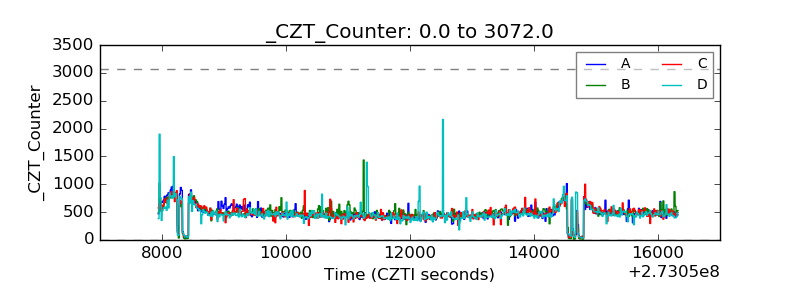 |
| +2.5 Volts monitor |  |
| +5 Volts monitor | 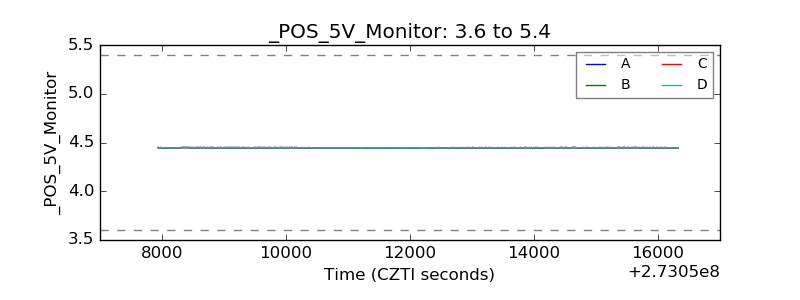 |
| _ROLL_ROT | 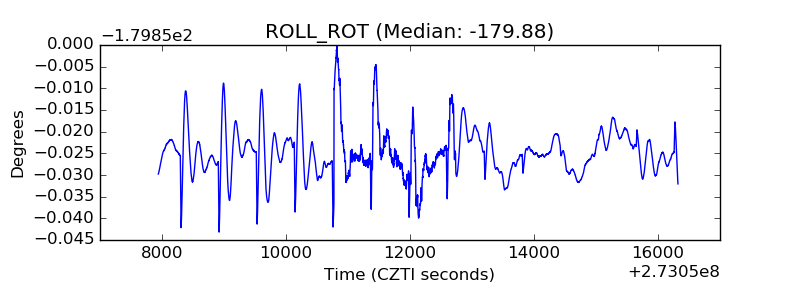 |
| _Roll_DEC | 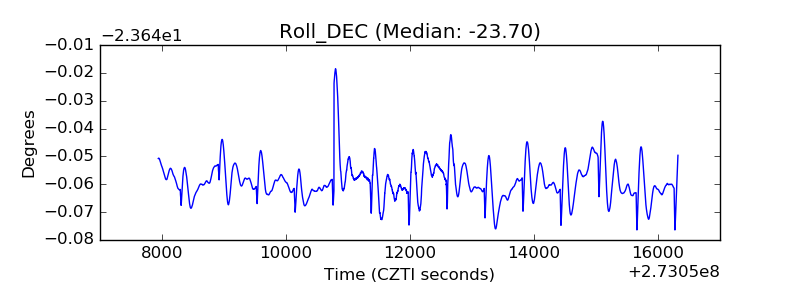 |
| _Roll_RA | 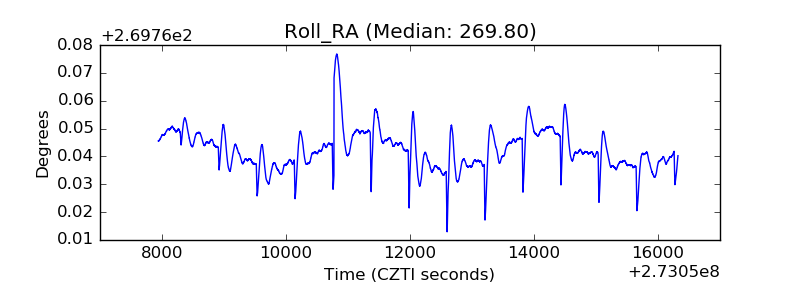 |
| Veto Counter | 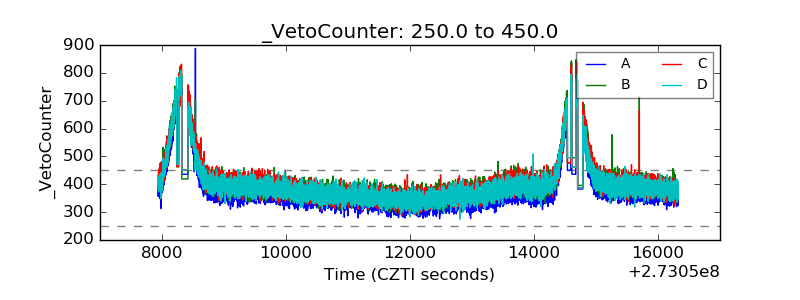 |