| Param | Original file | Final file |
|---|---|---|
| Filename | modeM0/AS1T02_088T01_9000002332_15756cztM0_level2.evt | modeM0/AS1T02_088T01_9000002332_15756cztM0_level2_quad_clean.evt |
| Size (bytes) | 1,190,286,720 | 230,106,240 |
| Size | 1.1 GB | 219.4 MB |
| Events in quadrant A | 8,636,809 | 1,451,196 |
| Events in quadrant B | 9,349,859 | 1,464,003 |
| Events in quadrant C | 8,464,985 | 1,421,620 |
| Events in quadrant D | 8,382,155 | 1,395,615 |
| Mode M9 | |||
|---|---|---|---|
| Quadrant | BADHDUFLAG | Total packets | Discarded packets |
| A | 0 | 18 | 0 |
| B | 0 | 18 | 0 |
| C | 0 | 18 | 0 |
| D | 0 | 18 | 0 |
| Mode SS | |||
|---|---|---|---|
| Quadrant | BADHDUFLAG | Total packets | Discarded packets |
| A | 0 | 364 | 0 |
| B | 0 | 364 | 0 |
| C | 0 | 364 | 0 |
| D | 0 | 364 | 0 |
| Mode M0 | |||
|---|---|---|---|
| Quadrant | BADHDUFLAG | Total packets | Discarded packets |
| A | 0 | 37498 | 4 |
| B | 0 | 38853 | 3 |
| C | 0 | 37083 | 3 |
| D | 0 | 37424 | 3 |
| Quadrant | Total seconds | Saturated seconds | Saturation percentage |
|---|---|---|---|
| A | 17948 | 255 | 1.420771% |
| B | 17948 | 204 | 1.136617% |
| C | 17948 | 224 | 1.248050% |
| D | 17948 | 159 | 0.885893% |
Noise dominated data is calculated using 1-second bins in cleaned event files. If a bin has >2000 counts, and if more than 50% of those come from <1% of pixels, then it is considered to be noise-dominated and hence unusable.
| Quadrant | # 1 sec bins | Bins with >0 counts | Bins with >2000 counts | High rate bins dominated by noise | Noise dominated (total time) | Noise dominated (detector-on time) | Marked lightcurve |
|---|---|---|---|---|---|---|---|
| A | 19729 | 17952 | 32 | 32 | 0.16% | 0.18% | 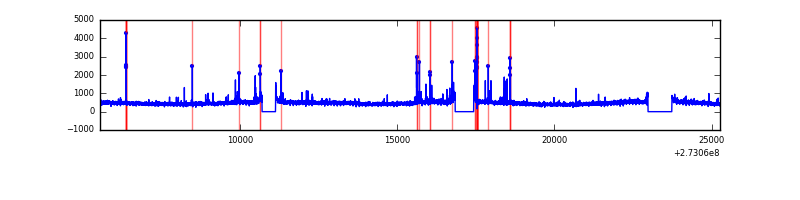 |
| B | 19729 | 17952 | 23 | 23 | 0.12% | 0.13% | 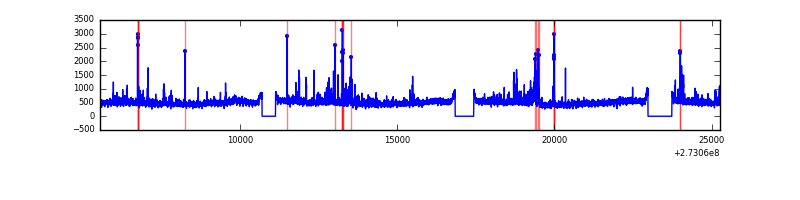 |
| C | 19729 | 17952 | 1 | 1 | 0.01% | 0.01% | 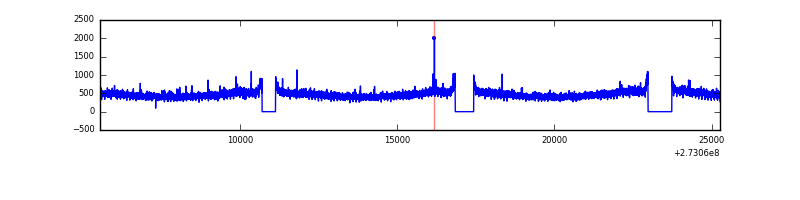 |
| D | 19729 | 17952 | 42 | 42 | 0.21% | 0.23% | 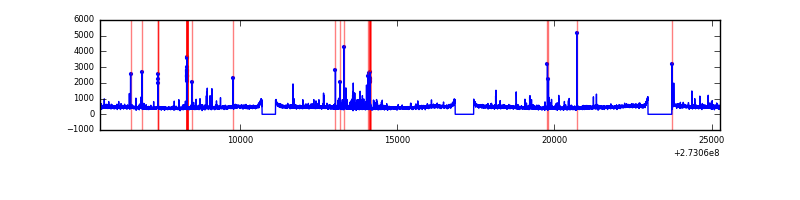 |
Top three noisy pixels from each quadrant. If the there are fewer than three noisy pixels in the level2.evt file, extra rows are filled as -1
| Pixel properties | Quadrant properties | ||||||
|---|---|---|---|---|---|---|---|
| Quadrant | DetID | PixID | Counts | Sigma | Mean | Median | Sigma |
| A | 9 | 143 | 236476 | 542.43 | 2148 | 2103 | 432.1 |
| A | 15 | 239 | 125217 | 284.94 | 2148 | 2103 | 432.1 |
| A | 0 | 226 | 18982 | 39.06 | 2148 | 2103 | 432.1 |
| B | 4 | 251 | 411609 | 999.02 | 2144 | 2095 | 409.9 |
| B | 4 | 216 | 122865 | 294.62 | 2144 | 2095 | 409.9 |
| B | 3 | 209 | 99332 | 237.21 | 2144 | 2095 | 409.9 |
| C | 14 | 238 | 312035 | 643.96 | 2053 | 2061 | 481.4 |
| C | 3 | 233 | 121880 | 248.92 | 2053 | 2061 | 481.4 |
| C | 10 | 187 | 19720 | 36.69 | 2053 | 2061 | 481.4 |
| D | 1 | 52 | 194966 | 343.82 | 2072 | 2026 | 561.2 |
| D | 2 | 234 | 76786 | 133.22 | 2072 | 2026 | 561.2 |
| D | 13 | 172 | 61053 | 105.19 | 2072 | 2026 | 561.2 |
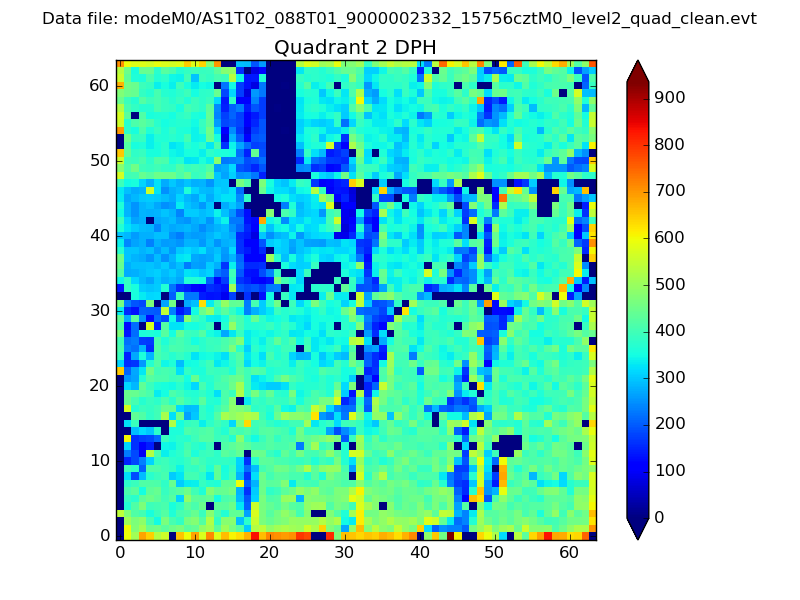
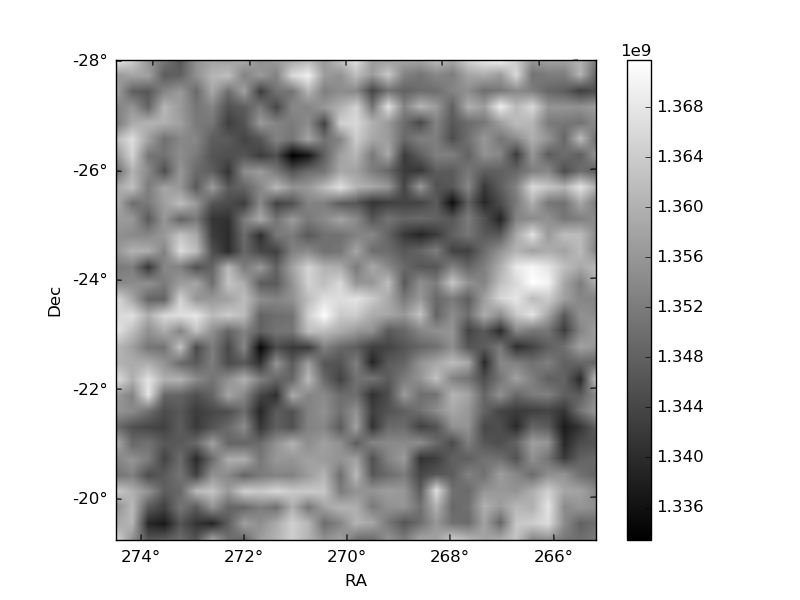
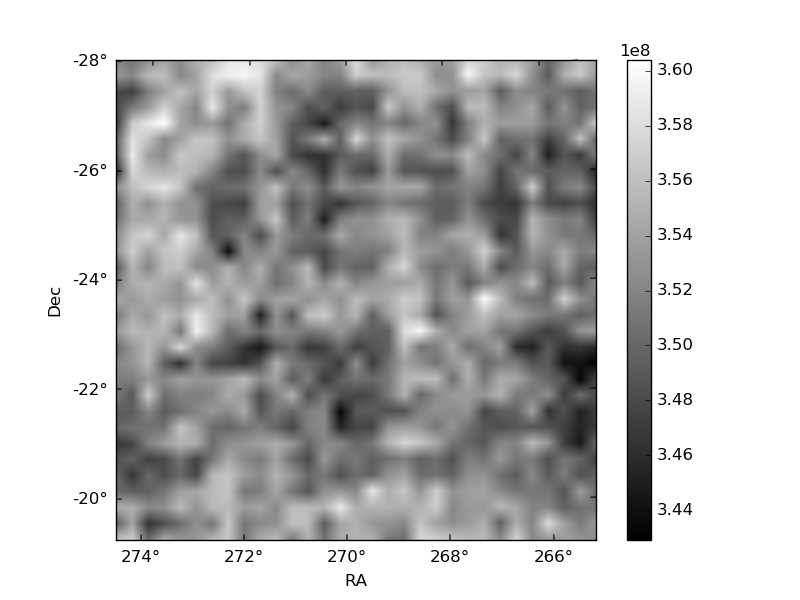
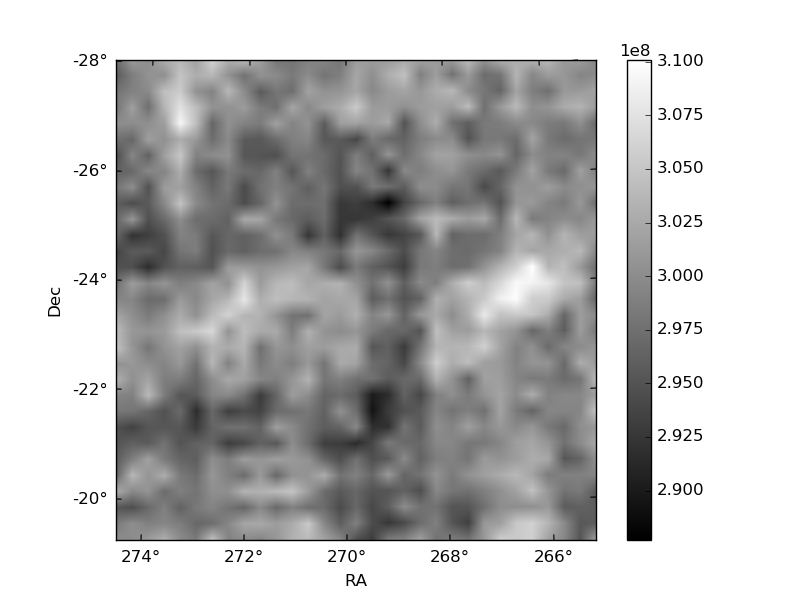
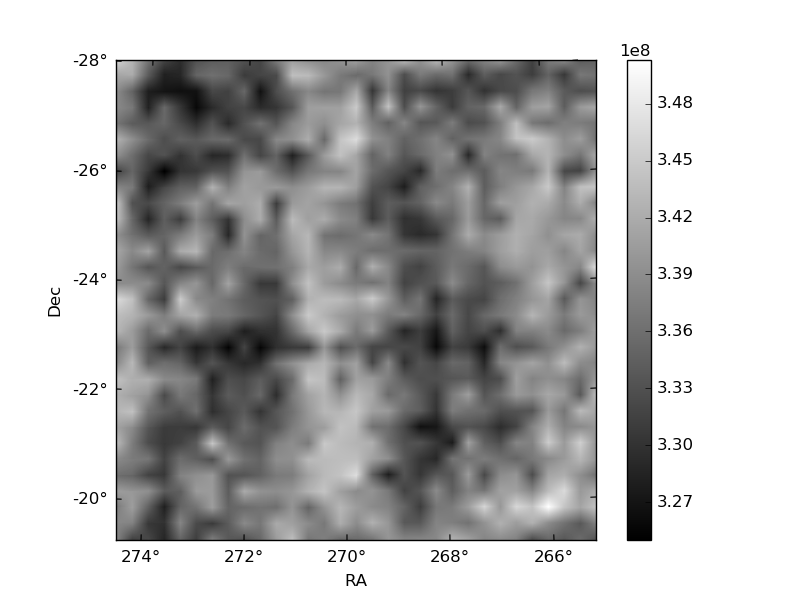
Histogram calculated using DETX and DETY for each event in the final _common_clean file
| Quadrant A | 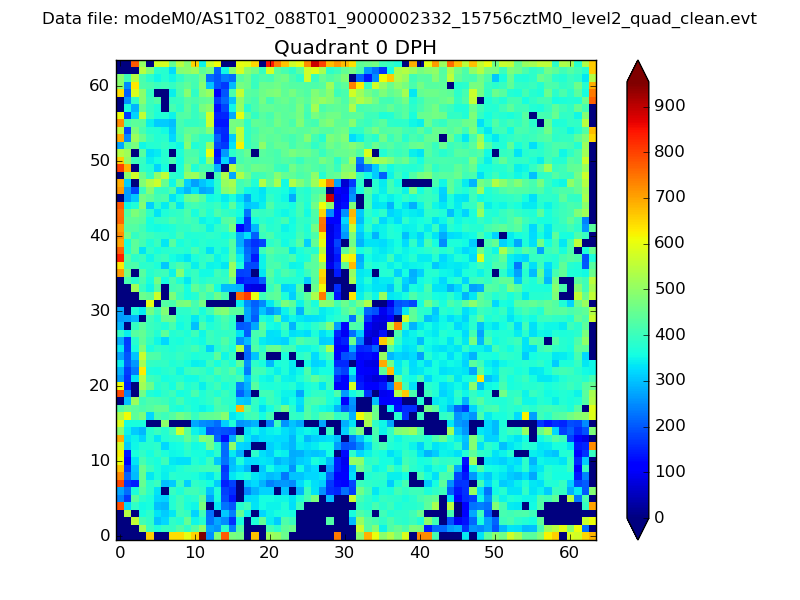 |
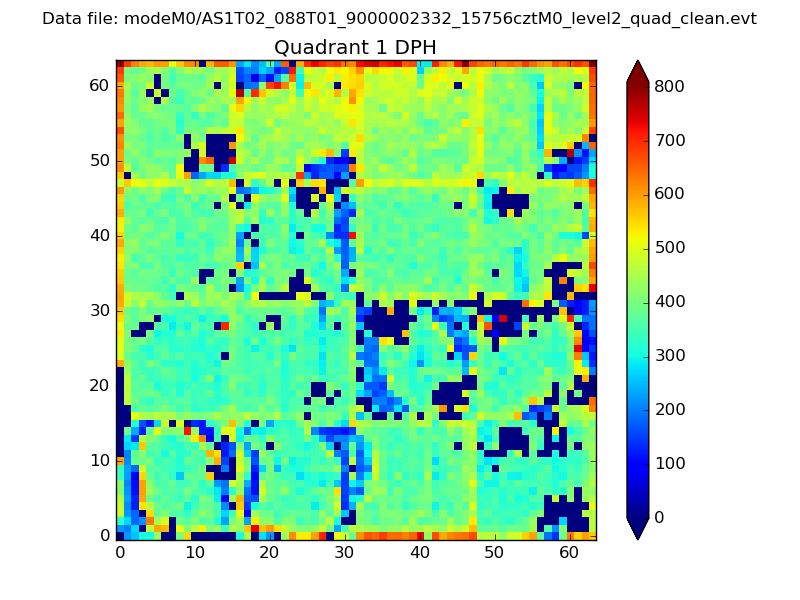 |
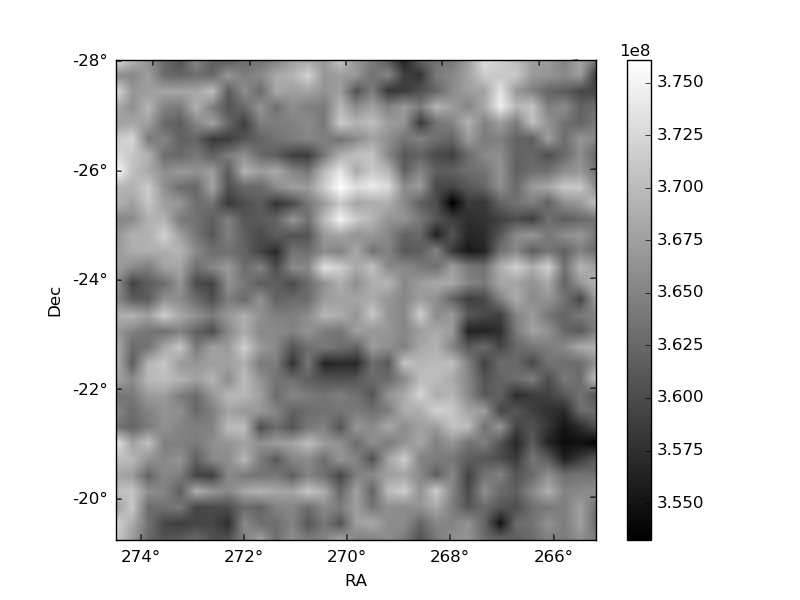
Quadrant B |
|---|---|---|---|
| Quadrant D | 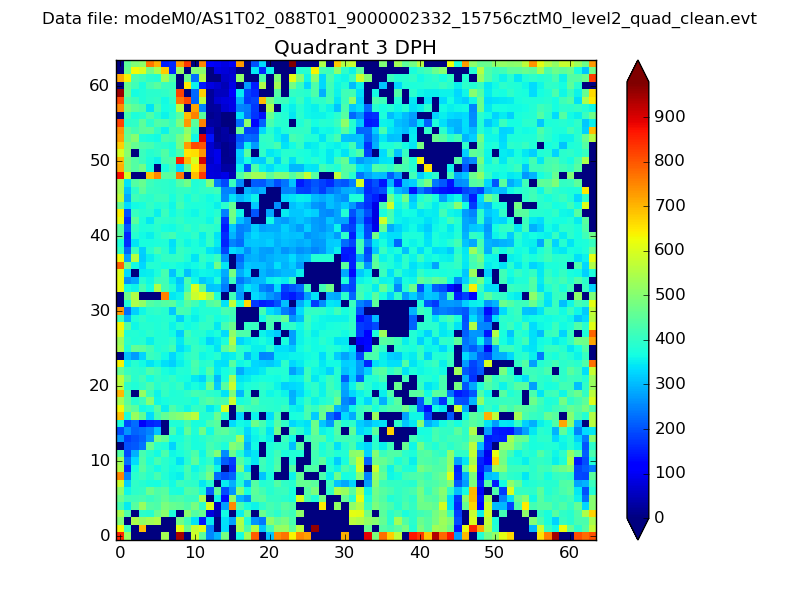 |
 |
Quadrant C |
| Plot type | Count rate plots | Images |
|---|---|---|
| Comparison with Poisson distribution Blue bars denote a histogram of data divided into 1 sec bins. Red curve is a Poisson curve with rate = median count rate of data. |
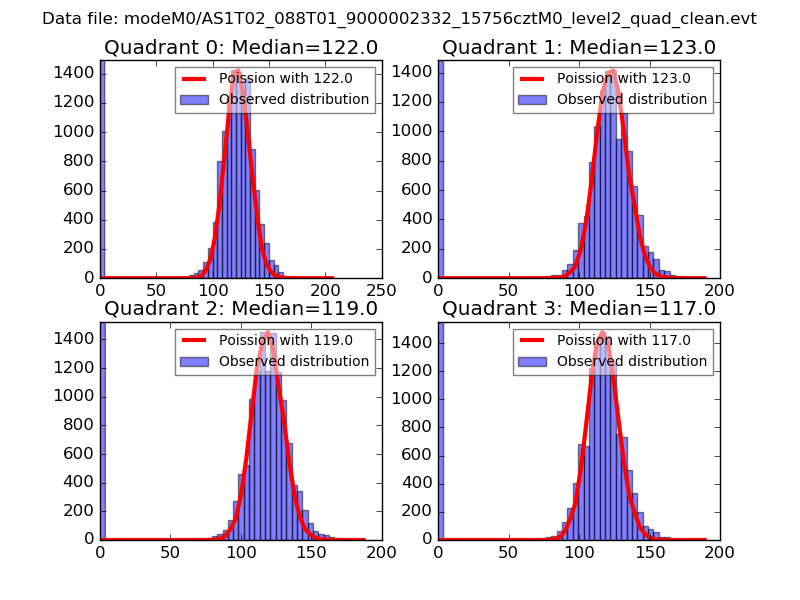 |
 |
| Quadrant-wise count rates Data is divided into 100 sec bins |
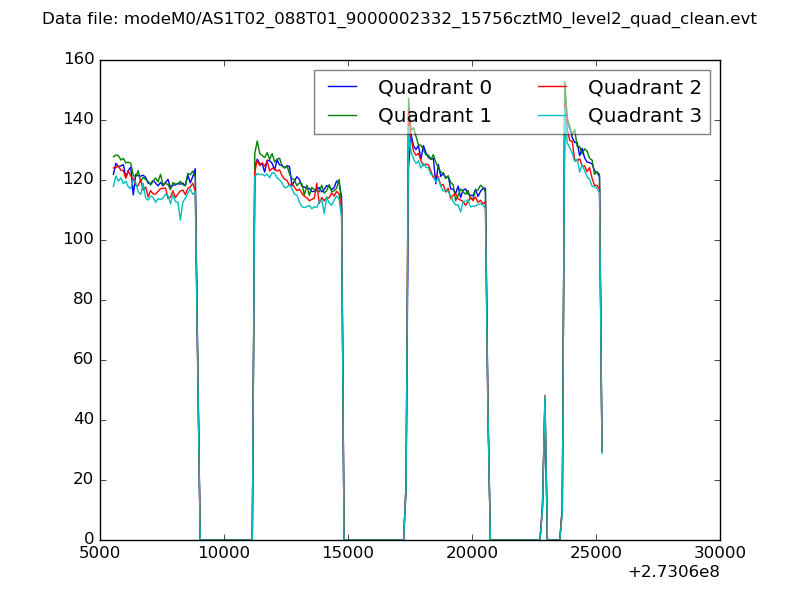 |
|
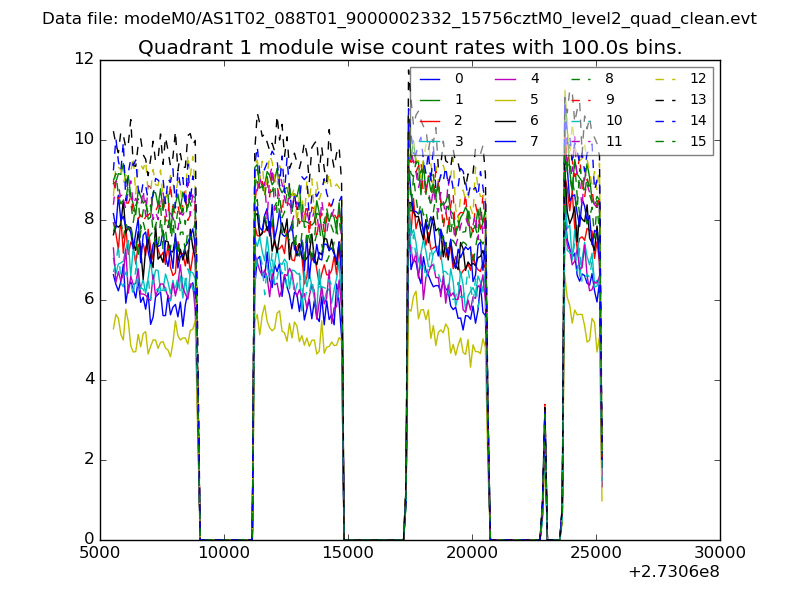
| Module-wise count rates for Quadrant A Data is divided into 100 sec bins |
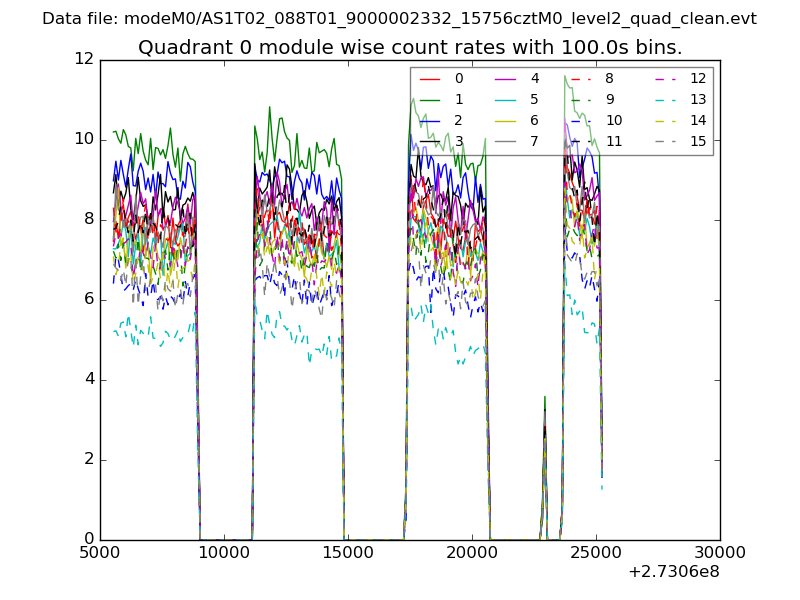 |
 |
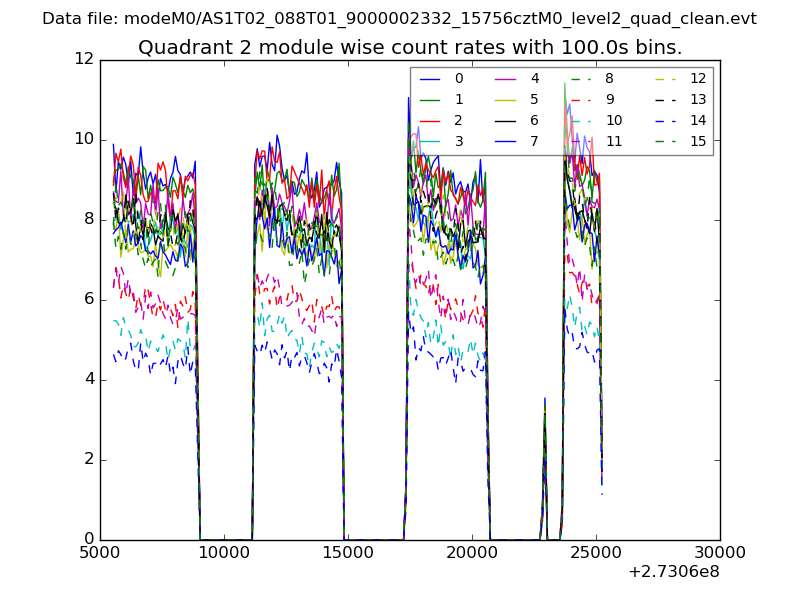
| Module-wise count rates for Quadrant B Data is divided into 100 sec bins |
 |
 |
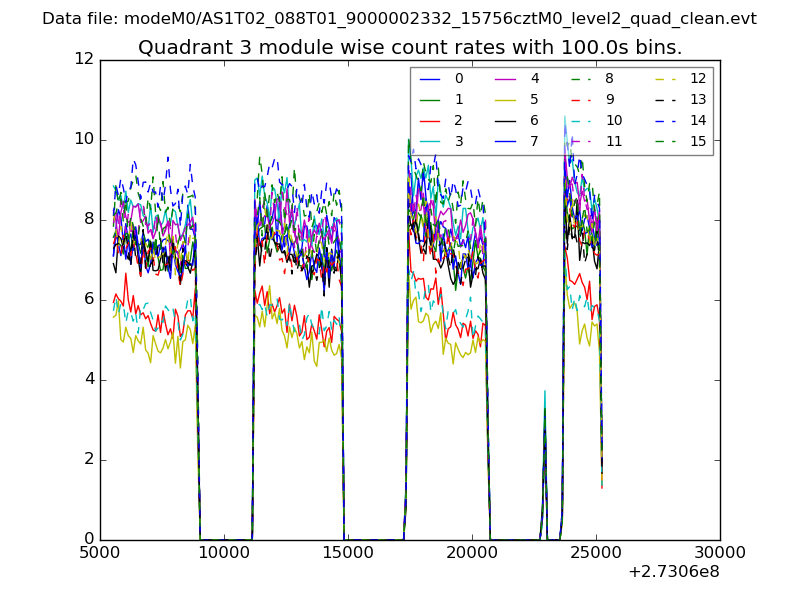
| Module-wise count rates for Quadrant C Data is divided into 100 sec bins |
 |
 |
| Module-wise count rates for Quadrant D Data is divided into 100 sec bins |
 |
 |
| Parameter | Plot |
|---|---|
| CZT HV Monitor | 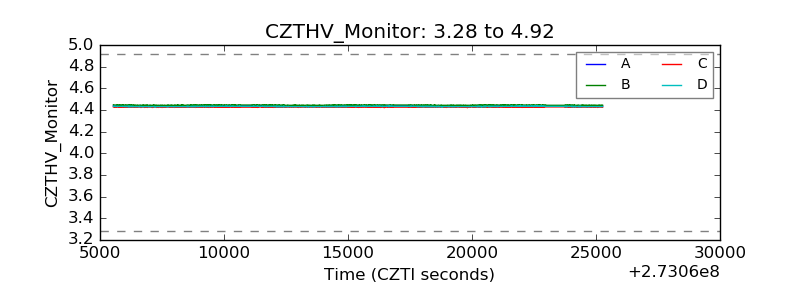 |
| D_VDD | 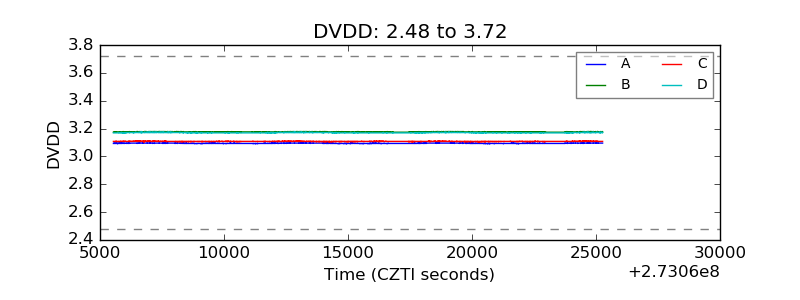 |
| Temperature 1 | 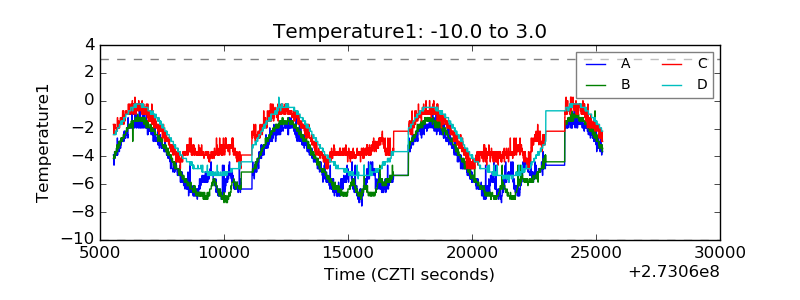 |
| Veto HV Monitor | 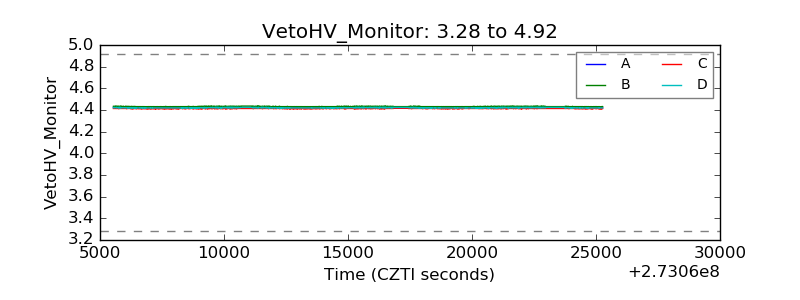 |
| Veto LLD | 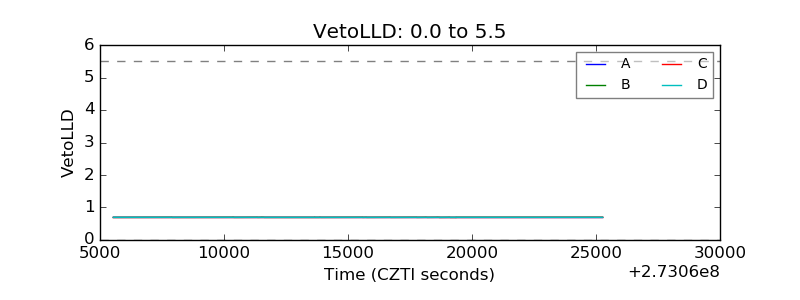 |
| Alpha Counter | 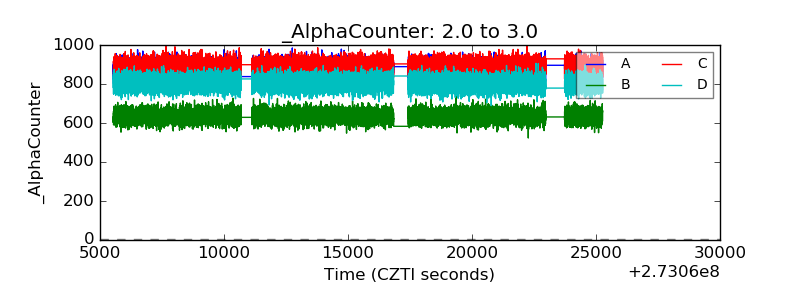 |
| _CPM_Rate | 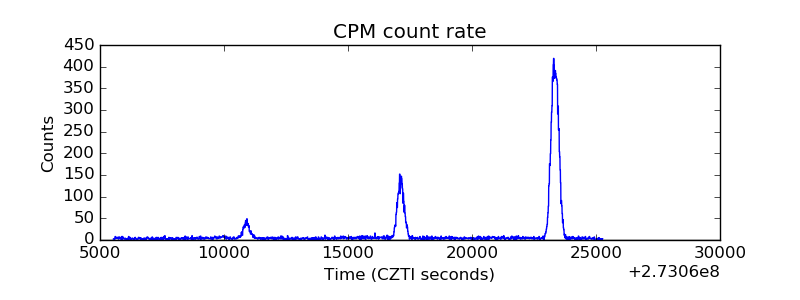 |
| CZT Counter |  |
| +2.5 Volts monitor |  |
| +5 Volts monitor |  |
| _ROLL_ROT | 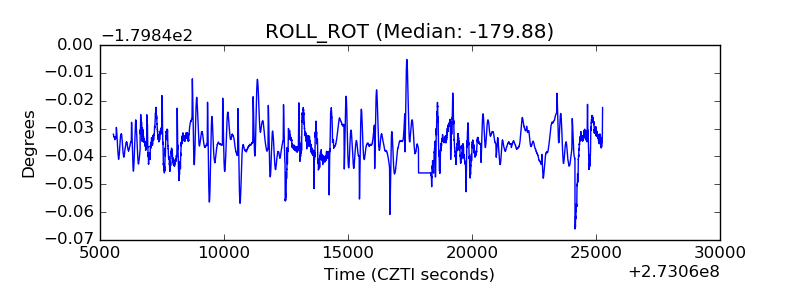 |
| _Roll_DEC | 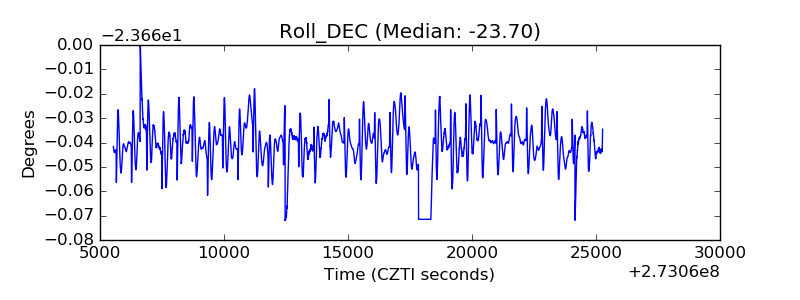 |
| _Roll_RA |  |
| Veto Counter | 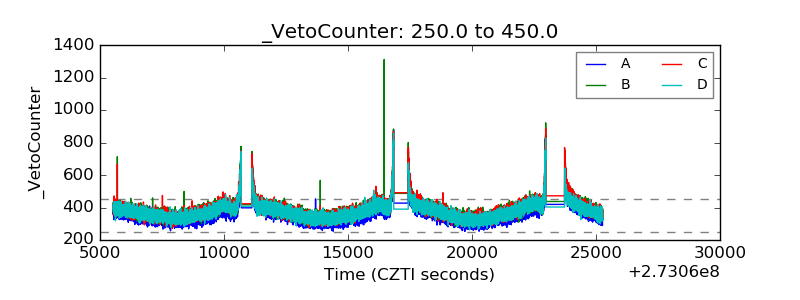 |