| Param | Original file | Final file |
|---|---|---|
| Filename | modeM0/AS1T02_088T01_9000002332_15757cztM0_level2.evt | modeM0/AS1T02_088T01_9000002332_15757cztM0_level2_quad_clean.evt |
| Size (bytes) | 435,113,280 | 85,475,520 |
| Size | 415.0 MB | 81.5 MB |
| Events in quadrant A | 3,078,926 | 542,558 |
| Events in quadrant B | 3,372,154 | 548,249 |
| Events in quadrant C | 3,175,448 | 527,199 |
| Events in quadrant D | 3,110,105 | 518,299 |
| Mode M9 | |||
|---|---|---|---|
| Quadrant | BADHDUFLAG | Total packets | Discarded packets |
| A | 0 | 9 | 0 |
| B | 0 | 9 | 0 |
| C | 0 | 9 | 0 |
| D | 0 | 9 | 0 |
| Mode SS | |||
|---|---|---|---|
| Quadrant | BADHDUFLAG | Total packets | Discarded packets |
| A | 0 | 132 | 0 |
| B | 0 | 132 | 0 |
| C | 0 | 132 | 0 |
| D | 0 | 132 | 0 |
| Mode M0 | |||
|---|---|---|---|
| Quadrant | BADHDUFLAG | Total packets | Discarded packets |
| A | 0 | 13459 | 2 |
| B | 0 | 14073 | 1 |
| C | 0 | 13573 | 1 |
| D | 0 | 13572 | 1 |
| Quadrant | Total seconds | Saturated seconds | Saturation percentage |
|---|---|---|---|
| A | 6481 | 40 | 0.617189% |
| B | 6481 | 54 | 0.833205% |
| C | 6481 | 54 | 0.833205% |
| D | 6481 | 18 | 0.277735% |
Noise dominated data is calculated using 1-second bins in cleaned event files. If a bin has >2000 counts, and if more than 50% of those come from <1% of pixels, then it is considered to be noise-dominated and hence unusable.
| Quadrant | # 1 sec bins | Bins with >0 counts | Bins with >2000 counts | High rate bins dominated by noise | Noise dominated (total time) | Noise dominated (detector-on time) | Marked lightcurve |
|---|---|---|---|---|---|---|---|
| A | 7417 | 6483 | 7 | 7 | 0.09% | 0.11% | 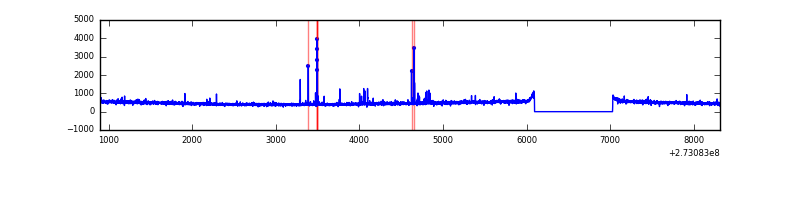 |
| B | 7417 | 6483 | 7 | 7 | 0.09% | 0.11% | 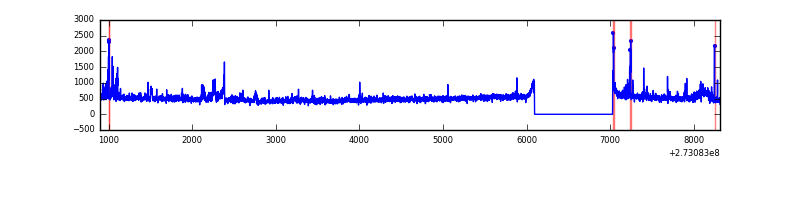 |
| C | 7417 | 6483 | 0 | 0 | 0.00% | 0.00% | 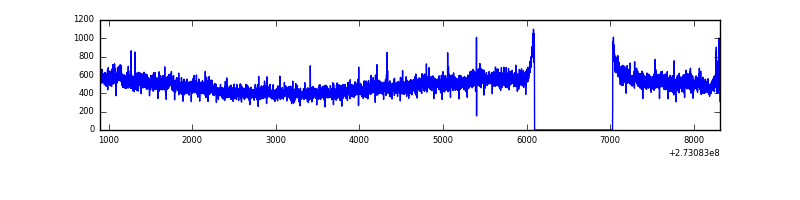 |
| D | 7417 | 6483 | 6 | 6 | 0.08% | 0.09% | 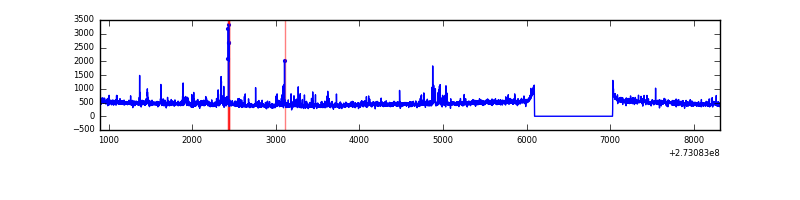 |
Top three noisy pixels from each quadrant. If the there are fewer than three noisy pixels in the level2.evt file, extra rows are filled as -1
| Pixel properties | Quadrant properties | ||||||
|---|---|---|---|---|---|---|---|
| Quadrant | DetID | PixID | Counts | Sigma | Mean | Median | Sigma |
| A | 9 | 143 | 69819 | 436.03 | 781 | 765 | 158.4 |
| A | 0 | 226 | 7000 | 39.37 | 781 | 765 | 158.4 |
| A | 12 | 194 | 5752 | 31.49 | 781 | 765 | 158.4 |
| B | 4 | 251 | 76818 | 506.0 | 778 | 759 | 150.3 |
| B | 4 | 216 | 50722 | 332.39 | 778 | 759 | 150.3 |
| B | 5 | 236 | 50051 | 327.93 | 778 | 759 | 150.3 |
| C | 3 | 233 | 135386 | 769.11 | 742 | 748 | 175.1 |
| C | 14 | 238 | 112800 | 640.09 | 742 | 748 | 175.1 |
| C | 7 | 247 | 18515 | 101.49 | 742 | 748 | 175.1 |
| D | 1 | 52 | 210196 | 1036.31 | 746 | 729 | 202.1 |
| D | 2 | 234 | 26583 | 127.91 | 746 | 729 | 202.1 |
| D | 2 | 120 | 24175 | 116.0 | 746 | 729 | 202.1 |
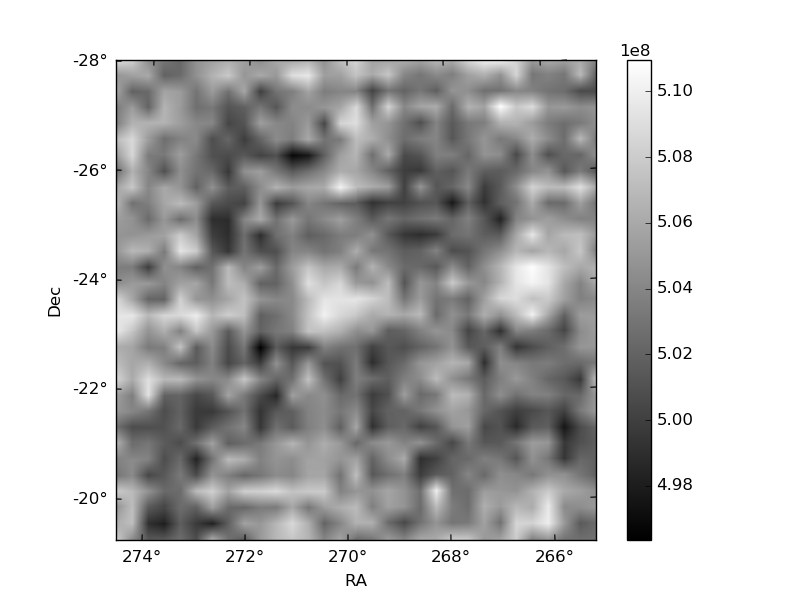
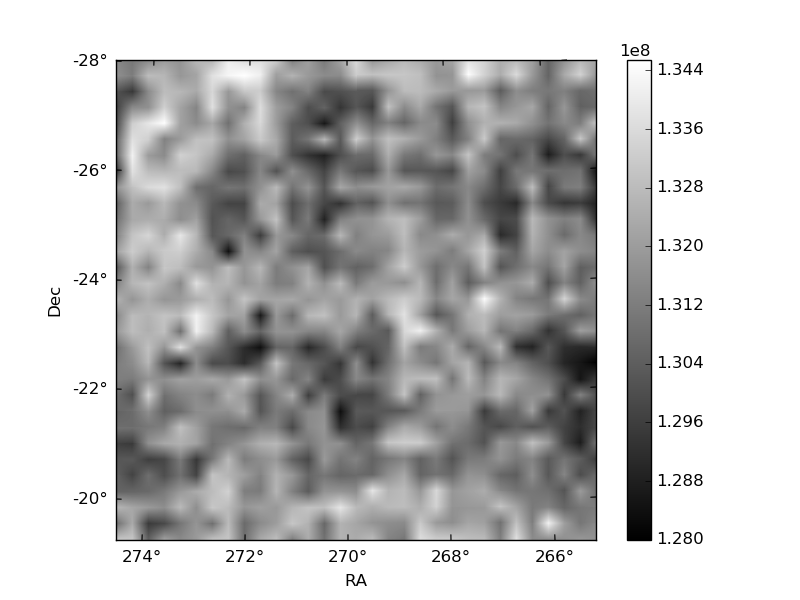
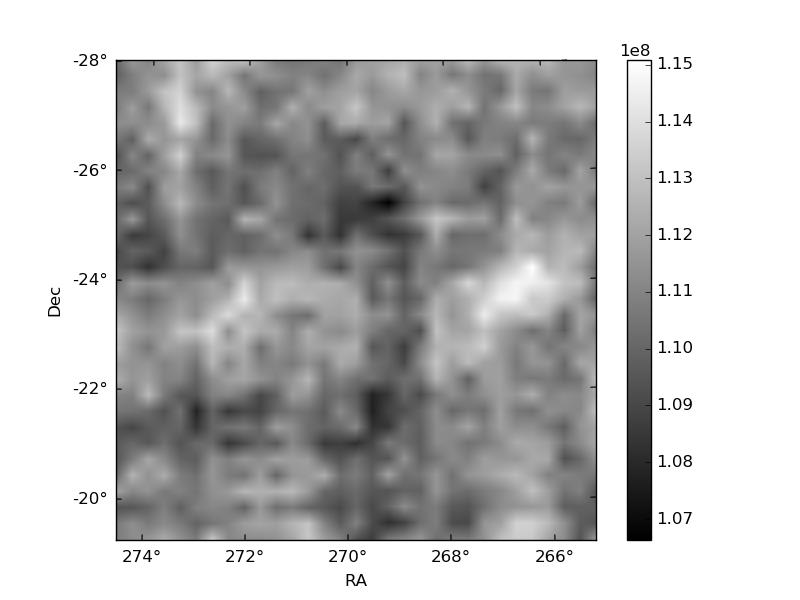
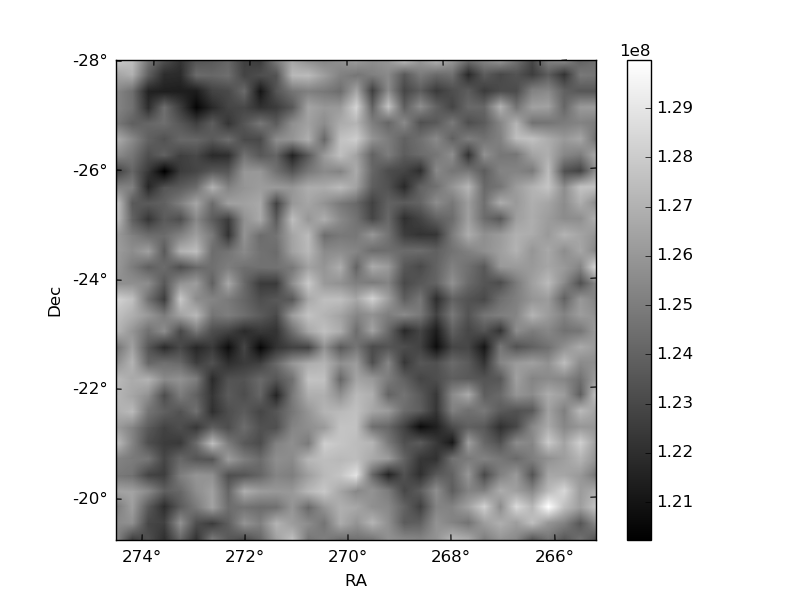
Histogram calculated using DETX and DETY for each event in the final _common_clean file
| Quadrant A | 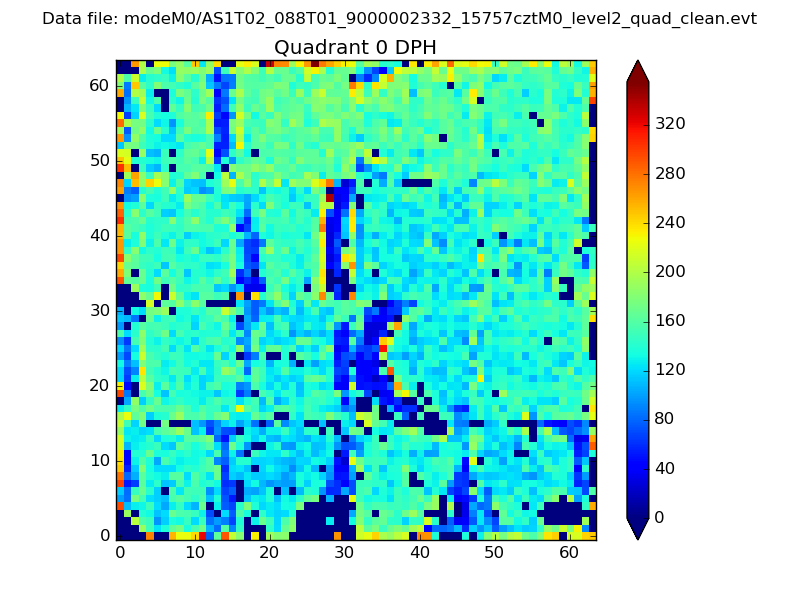 |
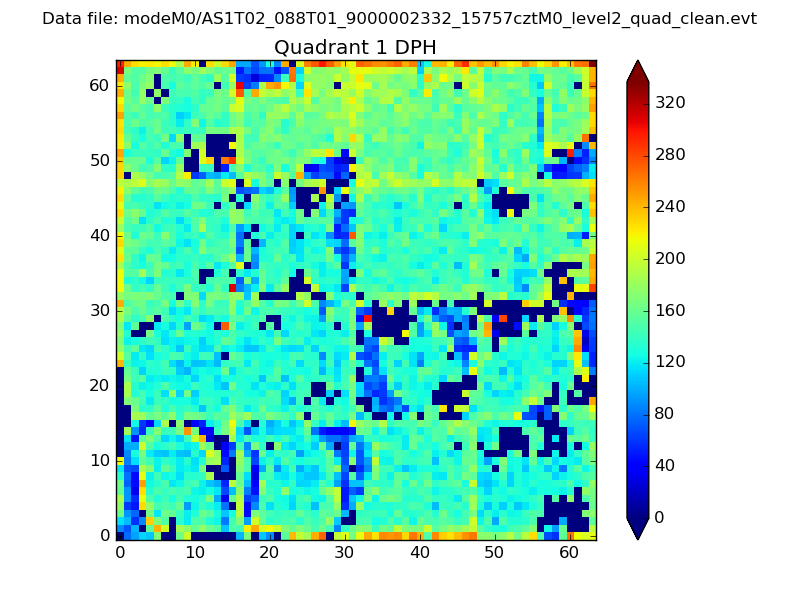 |
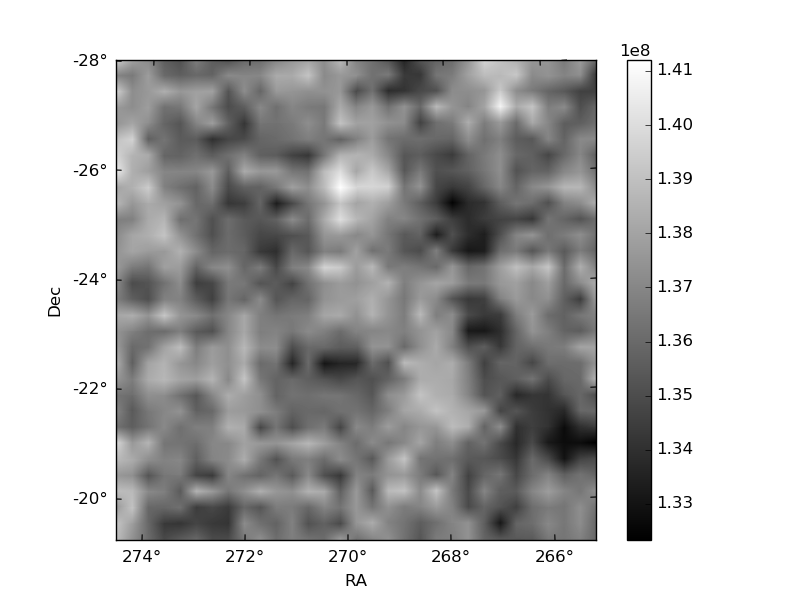
Quadrant B |
|---|---|---|---|
| Quadrant D | 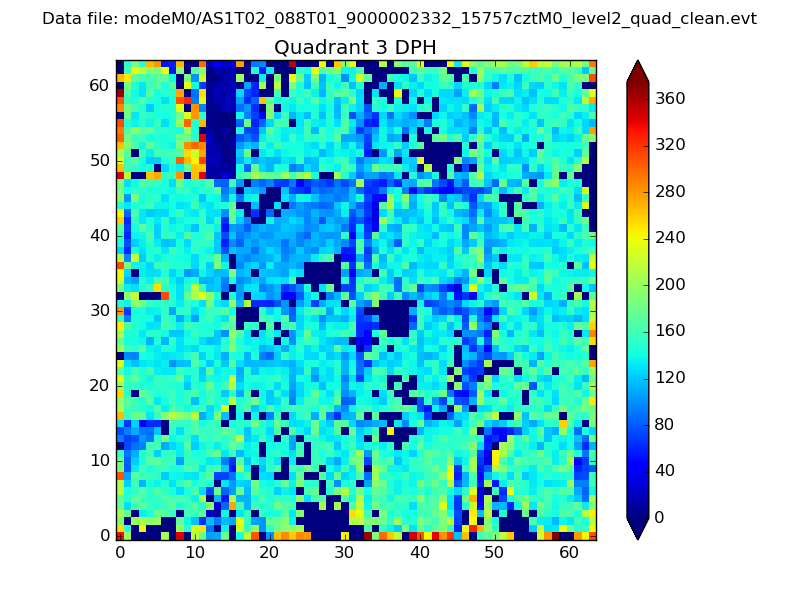 |
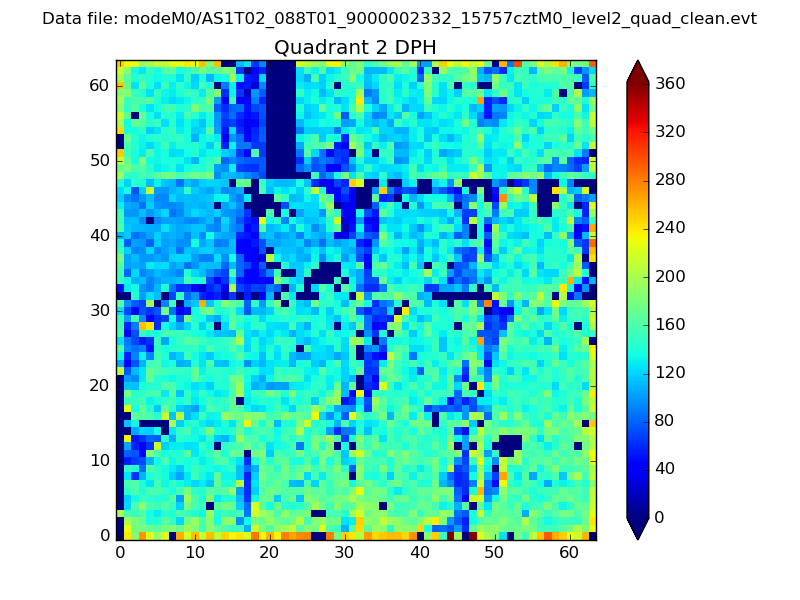 |
Quadrant C |
| Plot type | Count rate plots | Images |
|---|---|---|
| Comparison with Poisson distribution Blue bars denote a histogram of data divided into 1 sec bins. Red curve is a Poisson curve with rate = median count rate of data. |
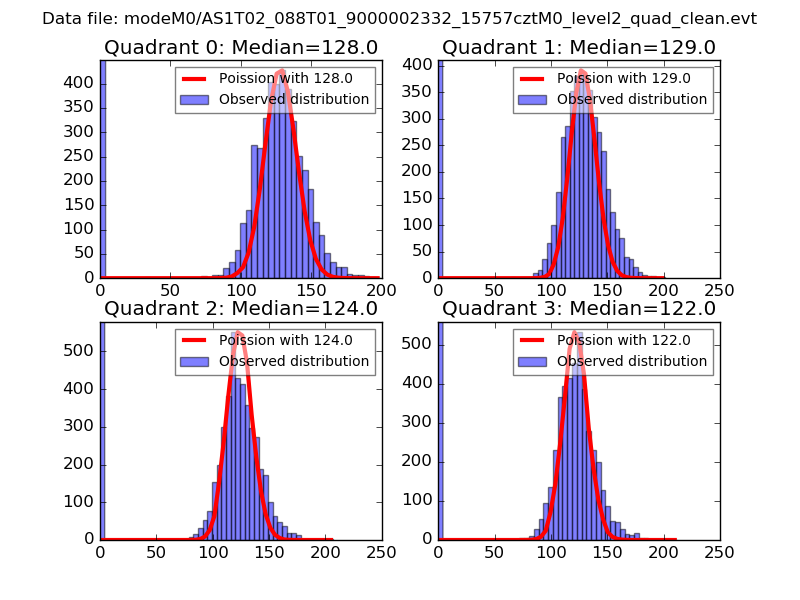 |
 |
| Quadrant-wise count rates Data is divided into 100 sec bins |
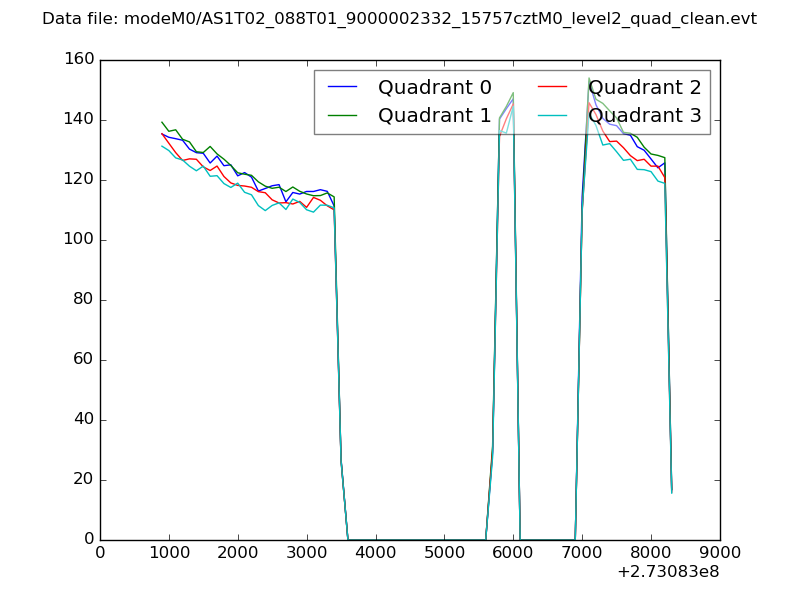 |
|
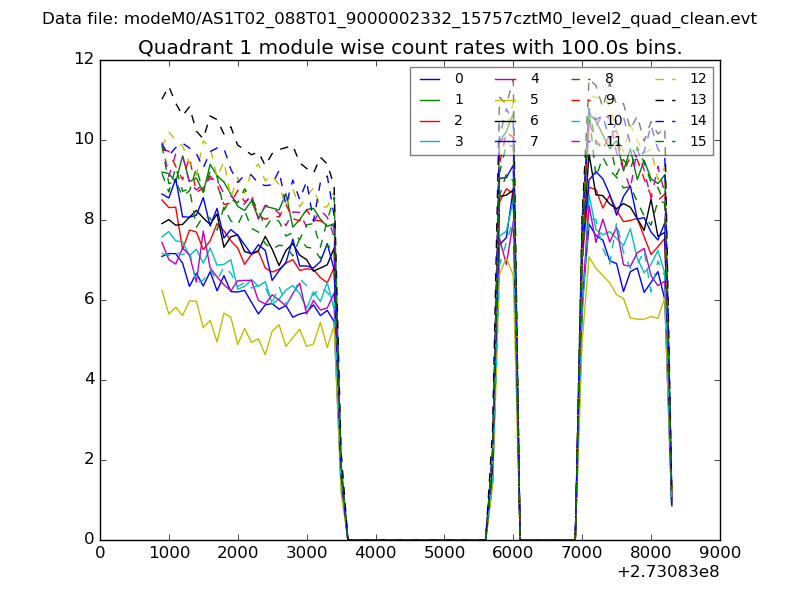
| Module-wise count rates for Quadrant A Data is divided into 100 sec bins |
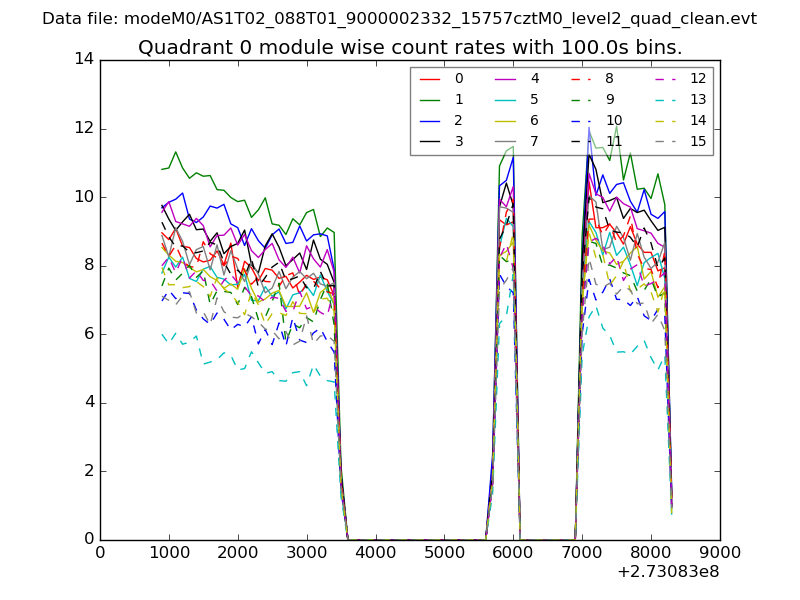 |
 |
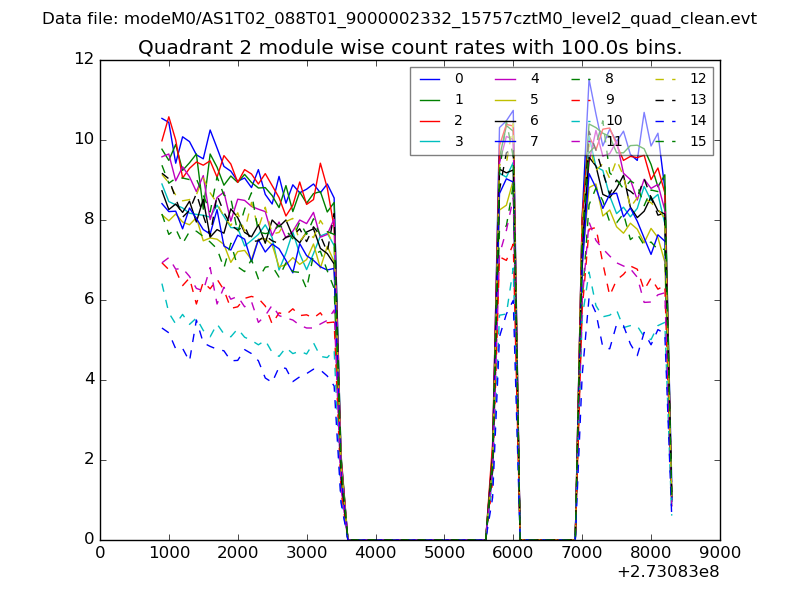
| Module-wise count rates for Quadrant B Data is divided into 100 sec bins |
 |
 |
| Module-wise count rates for Quadrant C Data is divided into 100 sec bins |
 |
 |
| Module-wise count rates for Quadrant D Data is divided into 100 sec bins |
 |
 |
| Parameter | Plot |
|---|---|
| CZT HV Monitor | 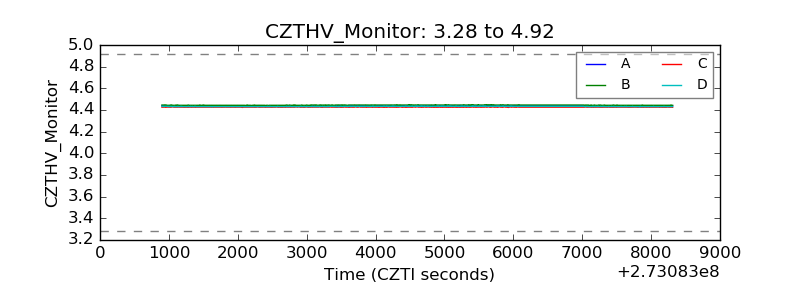 |
| D_VDD |  |
| Temperature 1 | 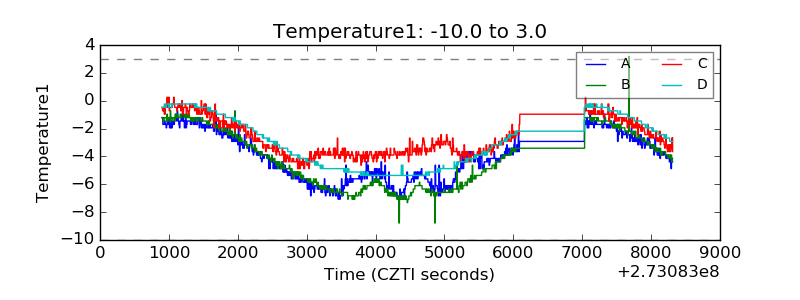 |
| Veto HV Monitor | 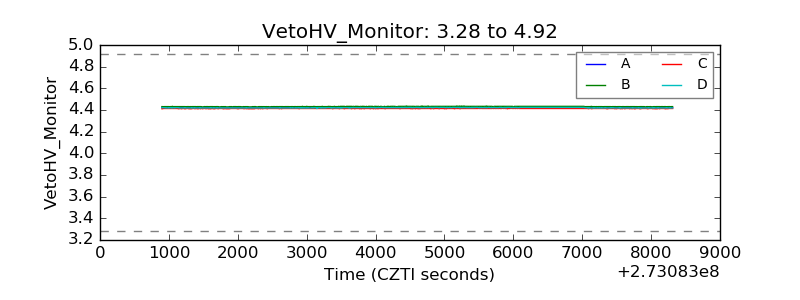 |
| Veto LLD | 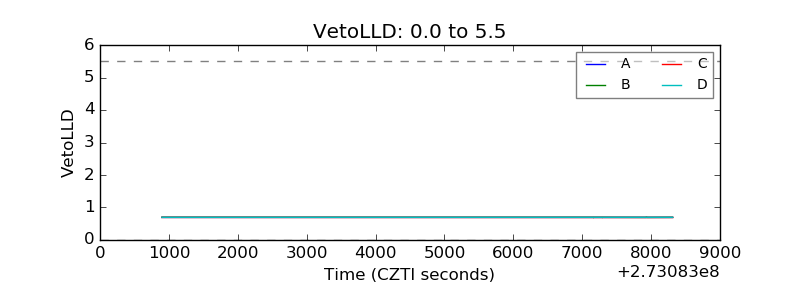 |
| Alpha Counter | 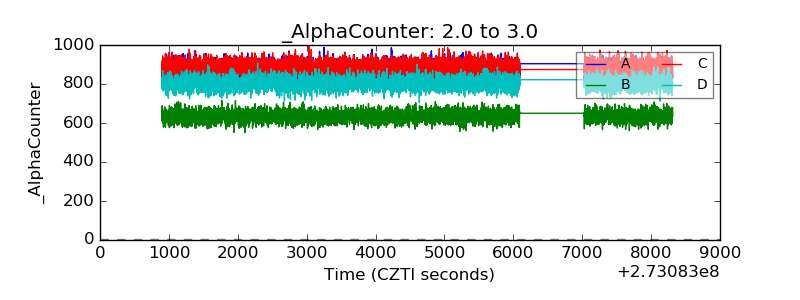 |
| _CPM_Rate | 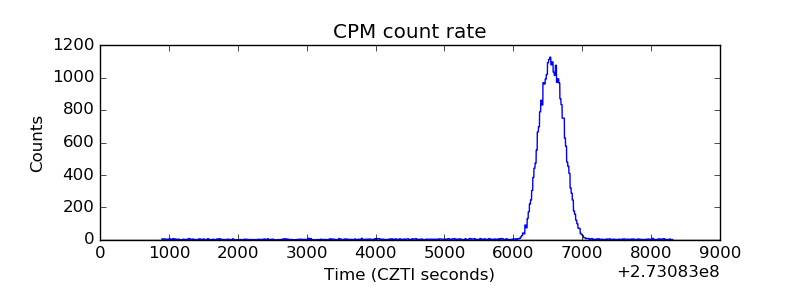 |
| CZT Counter | 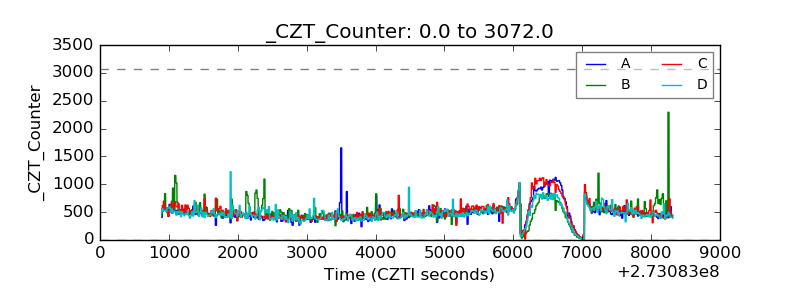 |
| +2.5 Volts monitor |  |
| +5 Volts monitor |  |
| _ROLL_ROT | 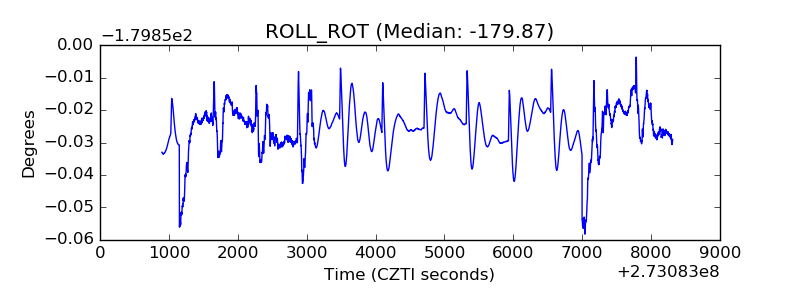 |
| _Roll_DEC | 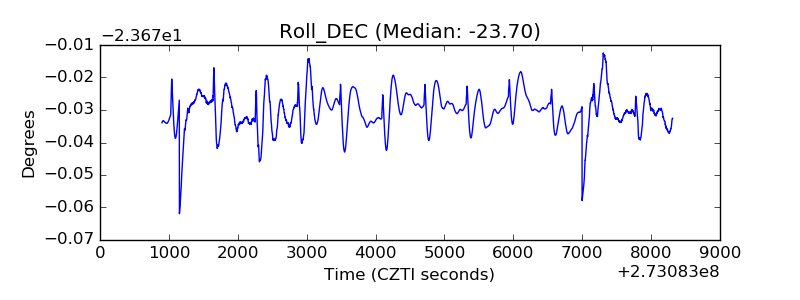 |
| _Roll_RA | 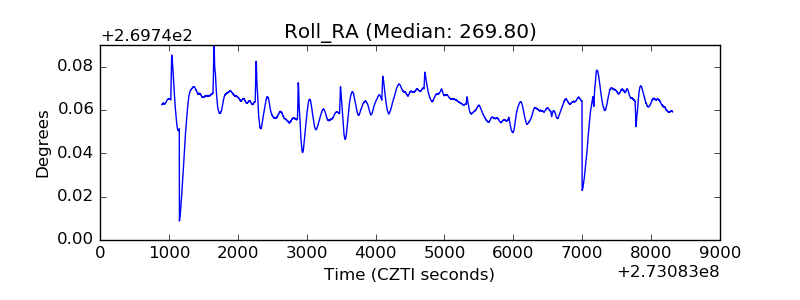 |
| Veto Counter | 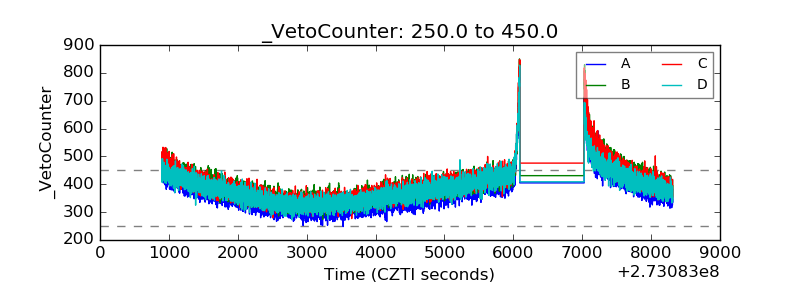 |