| Param | Original file | Final file |
|---|---|---|
| Filename | modeM0/AS1T02_088T01_9000002332_15758cztM0_level2.evt | modeM0/AS1T02_088T01_9000002332_15758cztM0_level2_quad_clean.evt |
| Size (bytes) | 437,423,040 | 89,951,040 |
| Size | 417.2 MB | 85.8 MB |
| Events in quadrant A | 3,139,625 | 575,334 |
| Events in quadrant B | 3,340,031 | 594,883 |
| Events in quadrant C | 3,210,854 | 560,552 |
| Events in quadrant D | 3,119,940 | 544,973 |
| Mode M9 | |||
|---|---|---|---|
| Quadrant | BADHDUFLAG | Total packets | Discarded packets |
| A | 0 | 19 | 0 |
| B | 0 | 19 | 0 |
| C | 0 | 19 | 0 |
| D | 0 | 19 | 0 |
| Mode SS | |||
|---|---|---|---|
| Quadrant | BADHDUFLAG | Total packets | Discarded packets |
| A | 0 | 130 | 0 |
| B | 0 | 130 | 0 |
| C | 0 | 130 | 0 |
| D | 0 | 130 | 0 |
| Mode M0 | |||
|---|---|---|---|
| Quadrant | BADHDUFLAG | Total packets | Discarded packets |
| A | 0 | 13673 | 3 |
| B | 0 | 14166 | 2 |
| C | 0 | 13657 | 2 |
| D | 0 | 13774 | 2 |
| Quadrant | Total seconds | Saturated seconds | Saturation percentage |
|---|---|---|---|
| A | 6427 | 63 | 0.980240% |
| B | 6427 | 68 | 1.058036% |
| C | 6427 | 92 | 1.431461% |
| D | 6427 | 52 | 0.809087% |
Noise dominated data is calculated using 1-second bins in cleaned event files. If a bin has >2000 counts, and if more than 50% of those come from <1% of pixels, then it is considered to be noise-dominated and hence unusable.
| Quadrant | # 1 sec bins | Bins with >0 counts | Bins with >2000 counts | High rate bins dominated by noise | Noise dominated (total time) | Noise dominated (detector-on time) | Marked lightcurve |
|---|---|---|---|---|---|---|---|
| A | 7513 | 6429 | 2 | 2 | 0.03% | 0.03% | 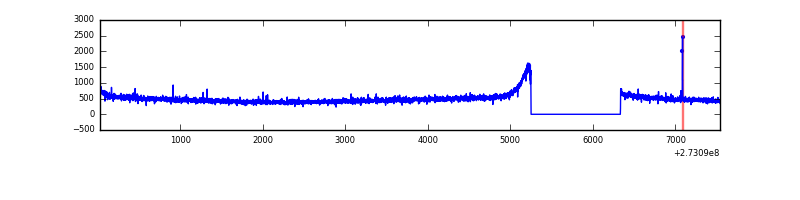 |
| B | 7513 | 6429 | 6 | 6 | 0.08% | 0.09% | 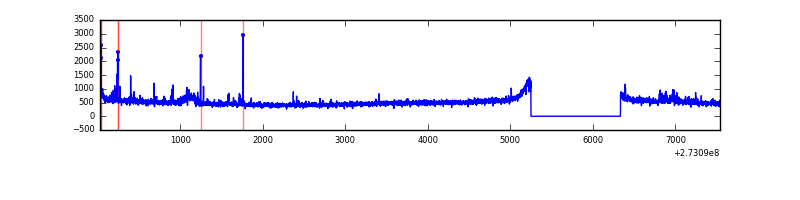 |
| C | 7513 | 6429 | 0 | 0 | 0.00% | 0.00% | 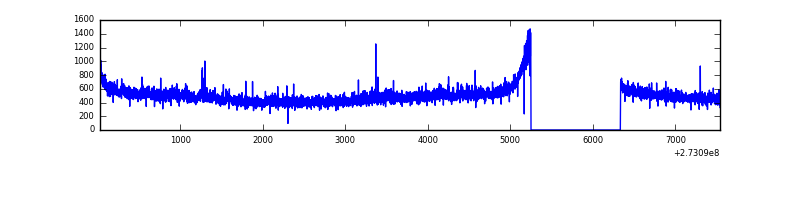 |
| D | 7513 | 6429 | 3 | 3 | 0.04% | 0.05% | 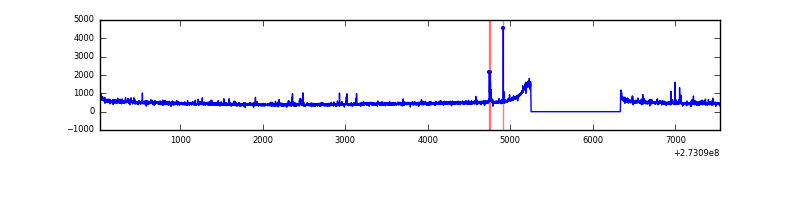 |
Top three noisy pixels from each quadrant. If the there are fewer than three noisy pixels in the level2.evt file, extra rows are filled as -1
| Pixel properties | Quadrant properties | ||||||
|---|---|---|---|---|---|---|---|
| Quadrant | DetID | PixID | Counts | Sigma | Mean | Median | Sigma |
| A | 15 | 223 | 7480 | 40.31 | 812 | 797 | 165.8 |
| A | 0 | 226 | 7141 | 38.26 | 812 | 797 | 165.8 |
| A | 12 | 194 | 6045 | 31.65 | 812 | 797 | 165.8 |
| B | 3 | 209 | 60988 | 390.08 | 800 | 784 | 154.3 |
| B | 4 | 251 | 32511 | 205.57 | 800 | 784 | 154.3 |
| B | 5 | 236 | 21183 | 132.17 | 800 | 784 | 154.3 |
| C | 14 | 238 | 116697 | 640.31 | 765 | 771 | 181.0 |
| C | 3 | 233 | 74043 | 404.71 | 765 | 771 | 181.0 |
| C | 7 | 247 | 22141 | 118.04 | 765 | 771 | 181.0 |
| D | 1 | 52 | 81987 | 382.01 | 779 | 763 | 212.6 |
| D | 2 | 234 | 25392 | 115.83 | 779 | 763 | 212.6 |
| D | 5 | 51 | 22179 | 100.72 | 779 | 763 | 212.6 |
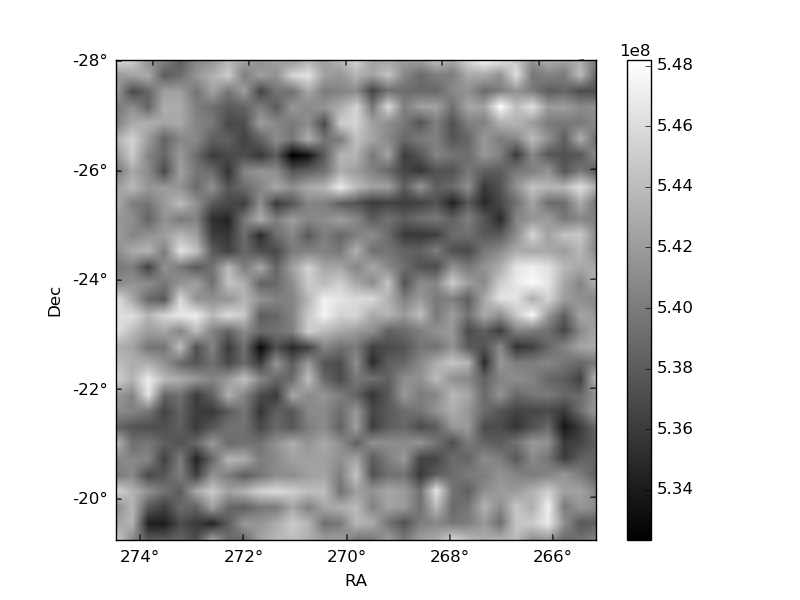
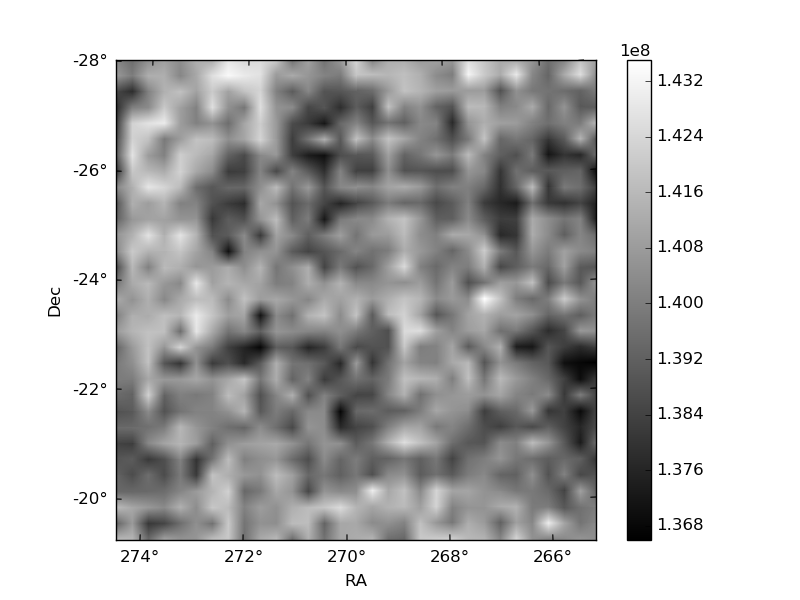
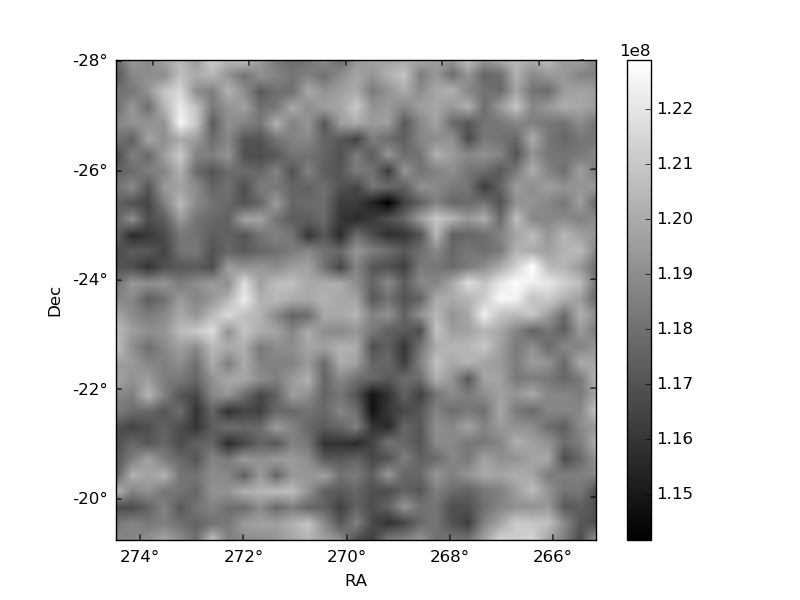
Histogram calculated using DETX and DETY for each event in the final _common_clean file
| Quadrant A | 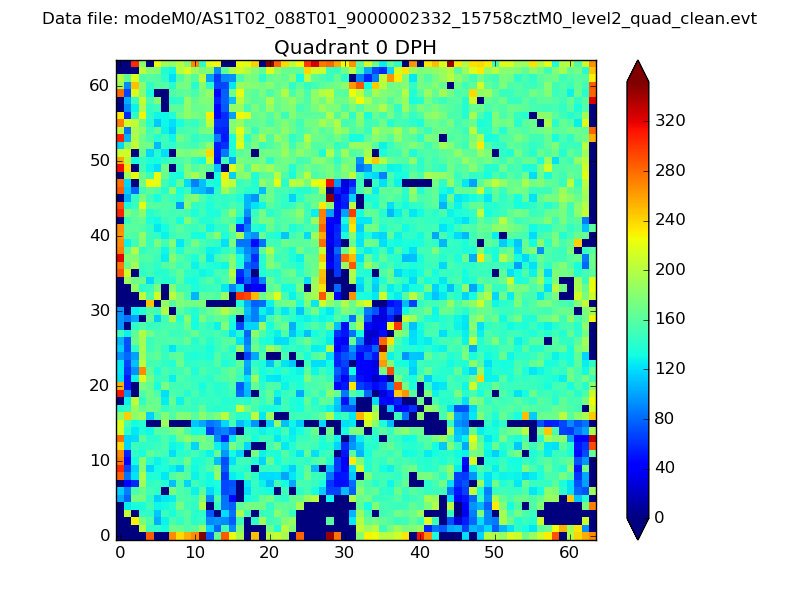 |
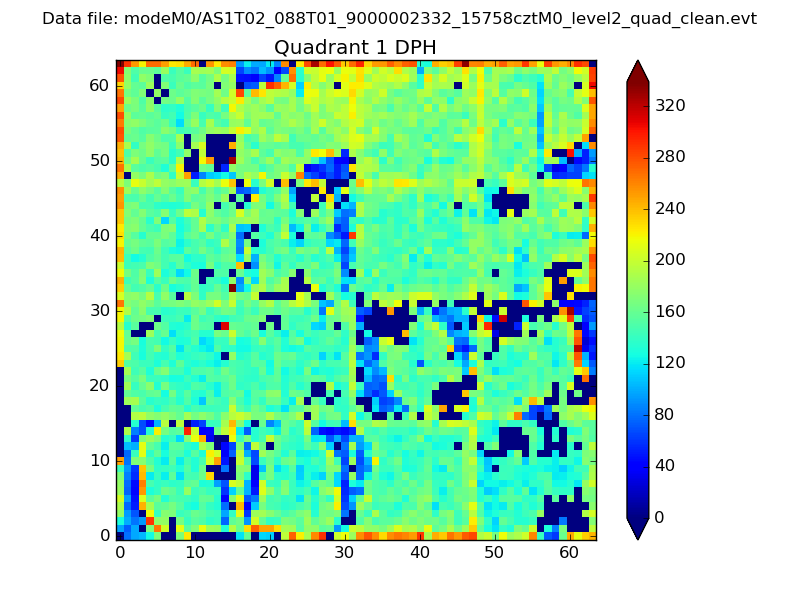 |
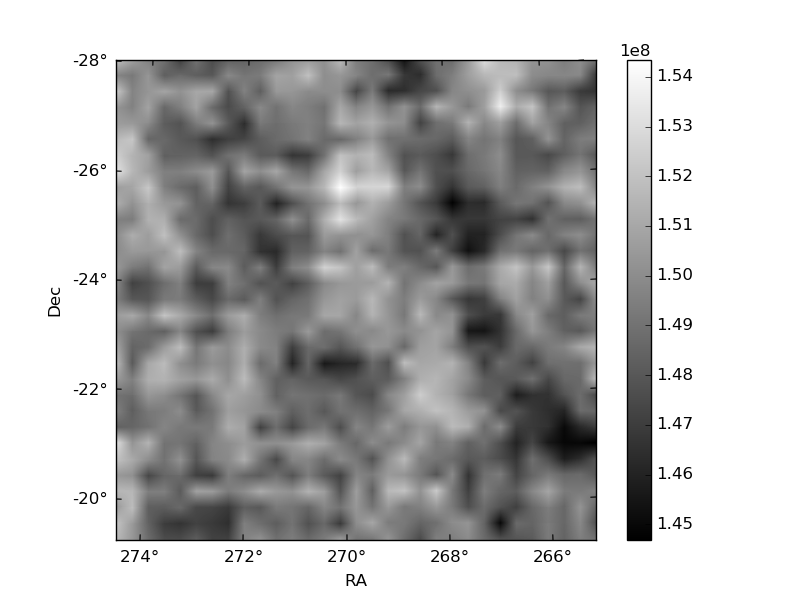
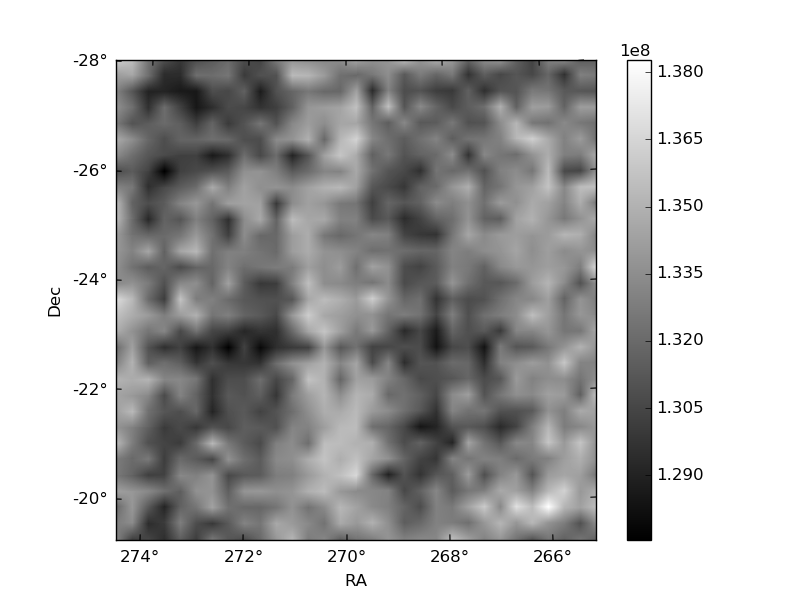
Quadrant B |
|---|---|---|---|
| Quadrant D | 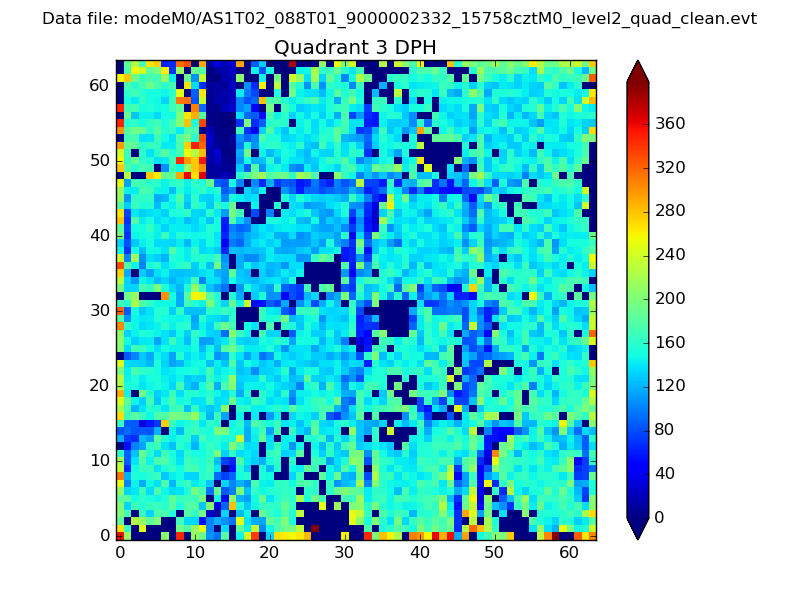 |
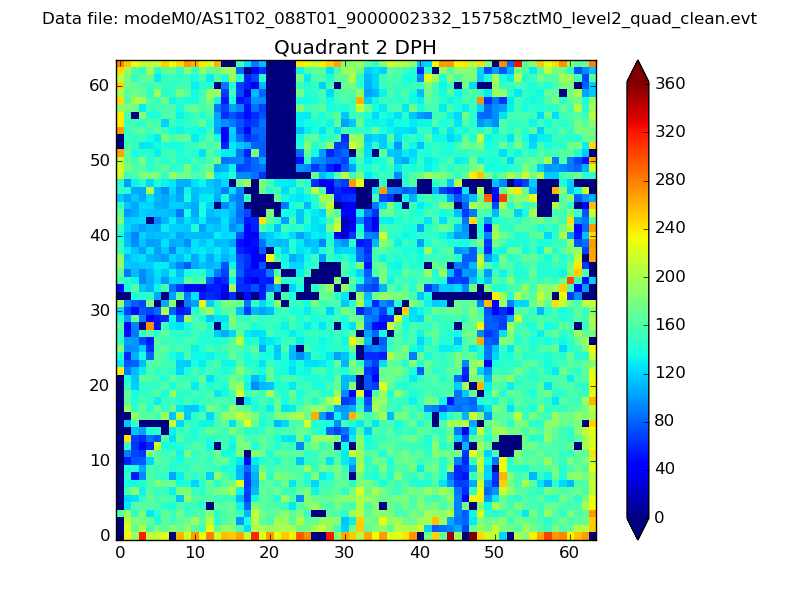 |
Quadrant C |
| Plot type | Count rate plots | Images |
|---|---|---|
| Comparison with Poisson distribution Blue bars denote a histogram of data divided into 1 sec bins. Red curve is a Poisson curve with rate = median count rate of data. |
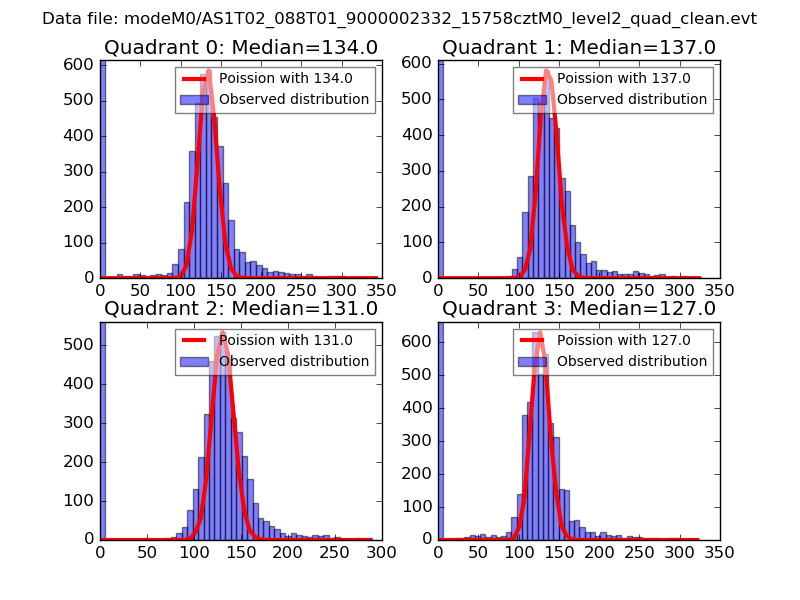 |
 |
| Quadrant-wise count rates Data is divided into 100 sec bins |
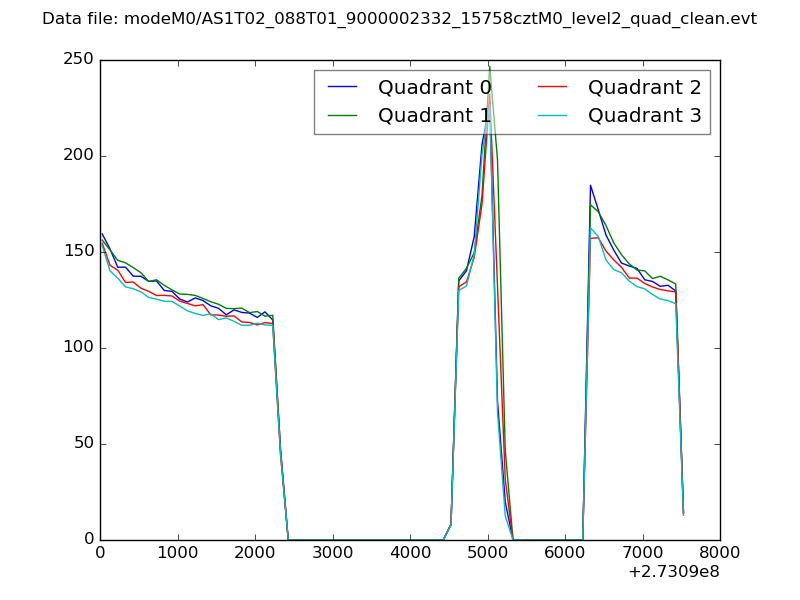 |
|
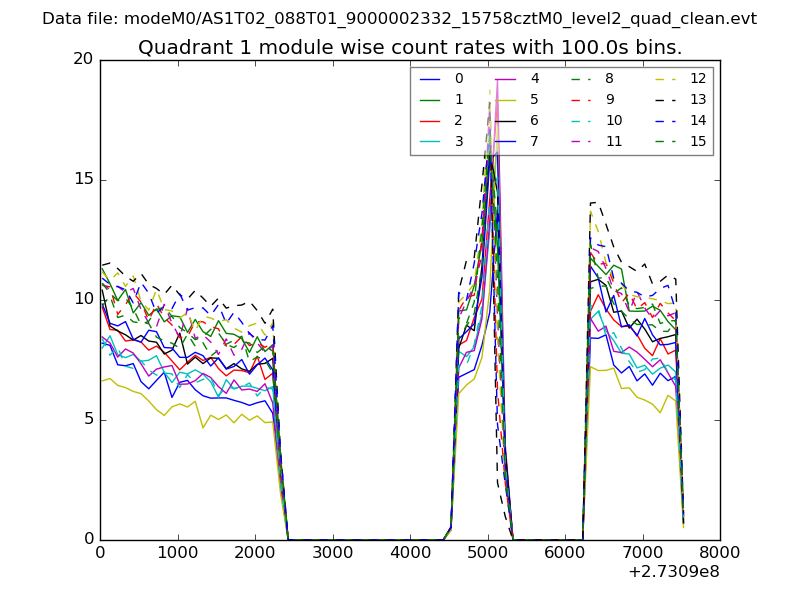
| Module-wise count rates for Quadrant A Data is divided into 100 sec bins |
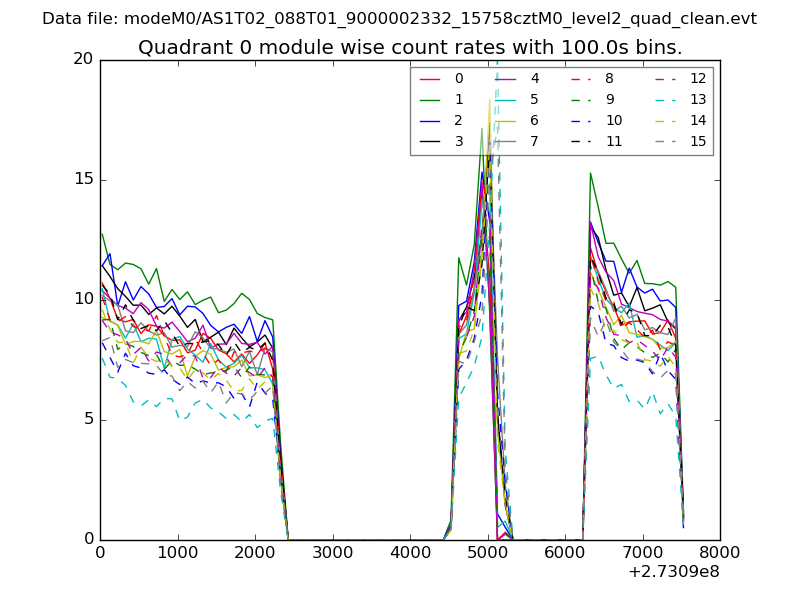 |
 |
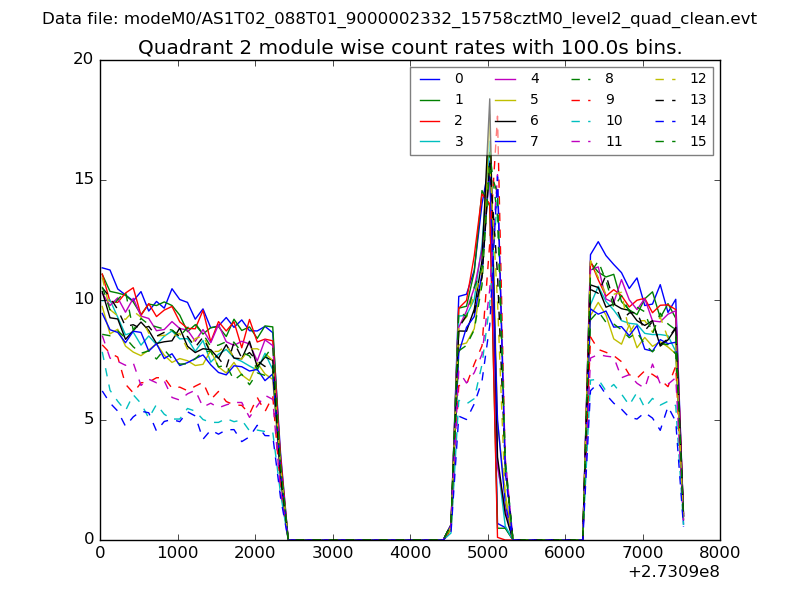
| Module-wise count rates for Quadrant B Data is divided into 100 sec bins |
 |
 |
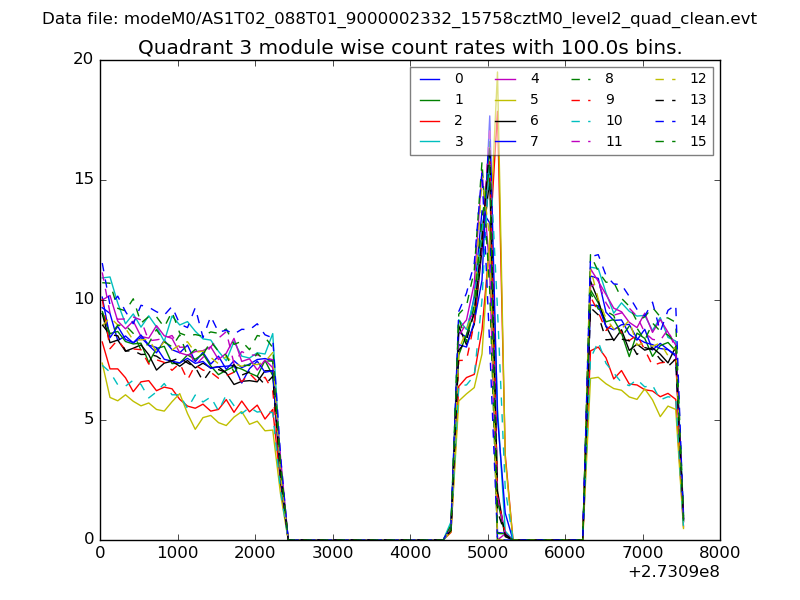
| Module-wise count rates for Quadrant C Data is divided into 100 sec bins |
 |
 |
| Module-wise count rates for Quadrant D Data is divided into 100 sec bins |
 |
 |
| Parameter | Plot |
|---|---|
| CZT HV Monitor | 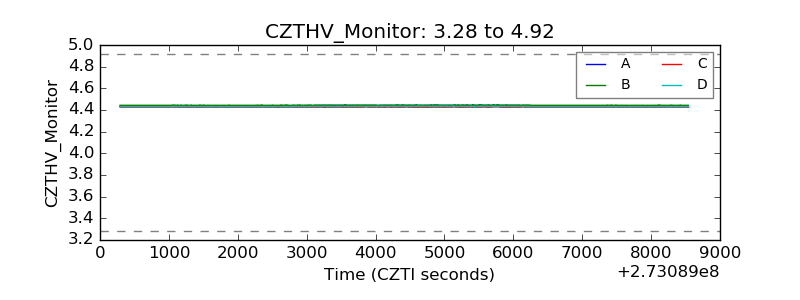 |
| D_VDD | 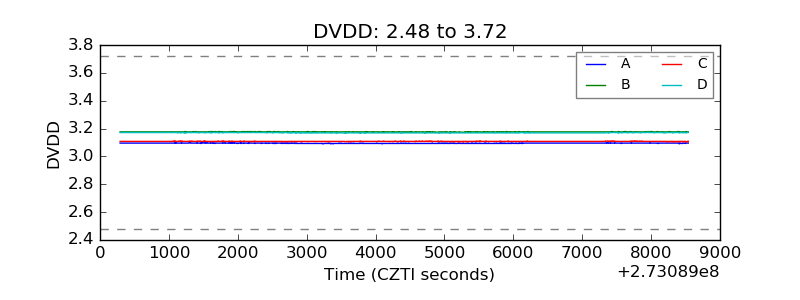 |
| Temperature 1 | 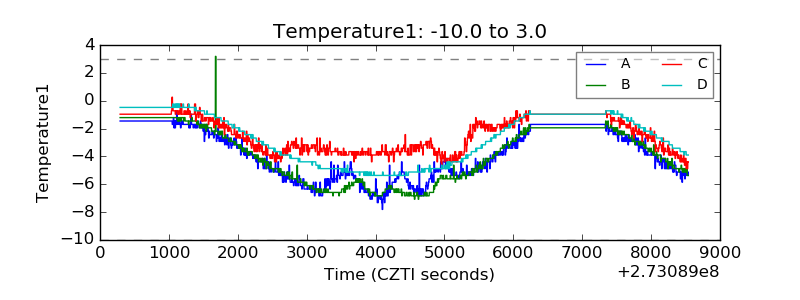 |
| Veto HV Monitor | 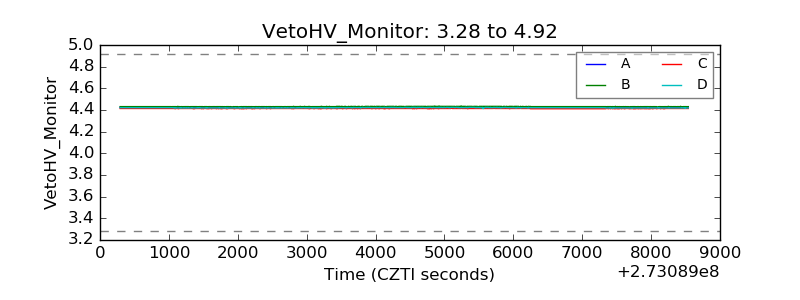 |
| Veto LLD |  |
| Alpha Counter | 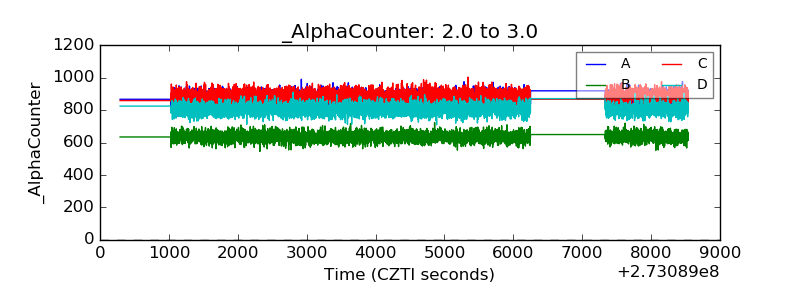 |
| _CPM_Rate | 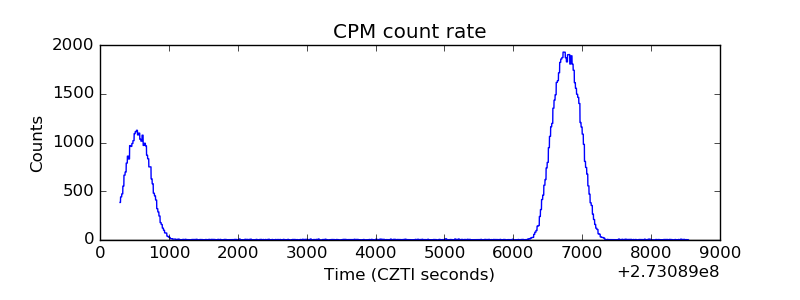 |
| CZT Counter | 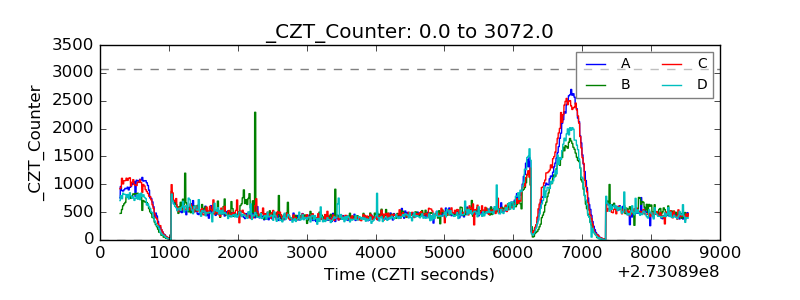 |
| +2.5 Volts monitor |  |
| +5 Volts monitor | 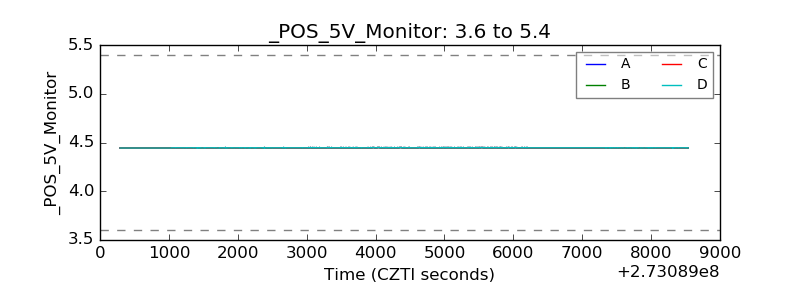 |
| _ROLL_ROT | 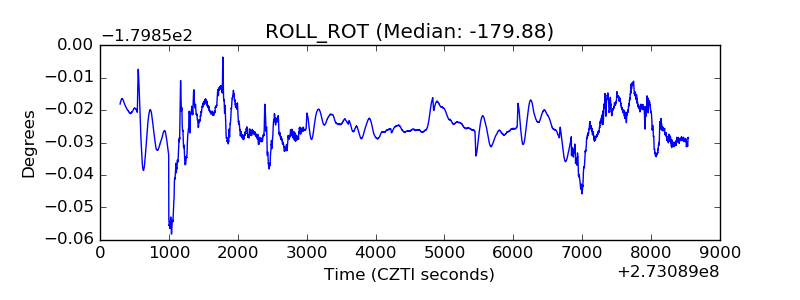 |
| _Roll_DEC | 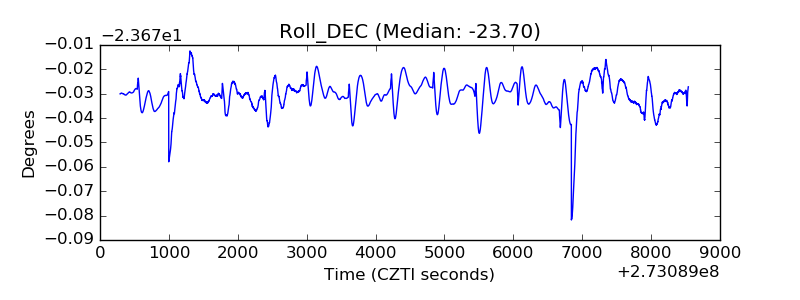 |
| _Roll_RA | 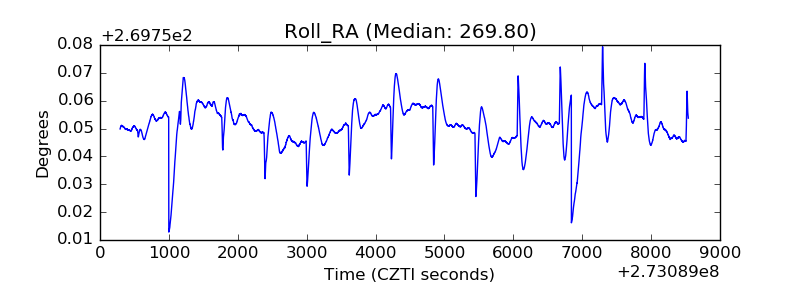 |
| Veto Counter | 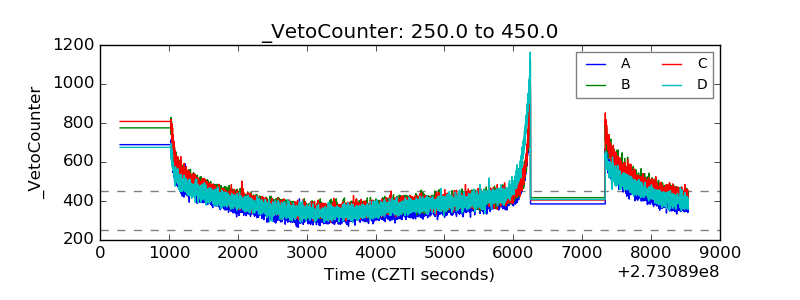 |