| Param | Original file | Final file |
|---|---|---|
| Filename | modeM0/AS1T02_088T01_9000002332_15762cztM0_level2.evt | modeM0/AS1T02_088T01_9000002332_15762cztM0_level2_quad_clean.evt |
| Size (bytes) | 436,495,680 | 79,747,200 |
| Size | 416.3 MB | 76.1 MB |
| Events in quadrant A | 3,060,754 | 504,860 |
| Events in quadrant B | 3,240,935 | 517,054 |
| Events in quadrant C | 3,131,072 | 489,189 |
| Events in quadrant D | 3,367,062 | 472,772 |
| Mode M9 | |||
|---|---|---|---|
| Quadrant | BADHDUFLAG | Total packets | Discarded packets |
| A | 0 | 18 | 0 |
| B | 0 | 18 | 0 |
| C | 0 | 18 | 0 |
| D | 0 | 19 | 0 |
| Mode SS | |||
|---|---|---|---|
| Quadrant | BADHDUFLAG | Total packets | Discarded packets |
| A | 0 | 126 | 0 |
| B | 0 | 126 | 0 |
| C | 0 | 126 | 0 |
| D | 0 | 126 | 0 |
| Mode M0 | |||
|---|---|---|---|
| Quadrant | BADHDUFLAG | Total packets | Discarded packets |
| A | 0 | 12835 | 3 |
| B | 0 | 13254 | 2 |
| C | 0 | 12869 | 2 |
| D | 0 | 13984 | 2 |
| Quadrant | Total seconds | Saturated seconds | Saturation percentage |
|---|---|---|---|
| A | 6172 | 22 | 0.356448% |
| B | 6172 | 46 | 0.745301% |
| C | 6172 | 45 | 0.729099% |
| D | 6172 | 82 | 1.328581% |
Noise dominated data is calculated using 1-second bins in cleaned event files. If a bin has >2000 counts, and if more than 50% of those come from <1% of pixels, then it is considered to be noise-dominated and hence unusable.
| Quadrant | # 1 sec bins | Bins with >0 counts | Bins with >2000 counts | High rate bins dominated by noise | Noise dominated (total time) | Noise dominated (detector-on time) | Marked lightcurve |
|---|---|---|---|---|---|---|---|
| A | 7488 | 6174 | 0 | 0 | 0.00% | 0.00% | 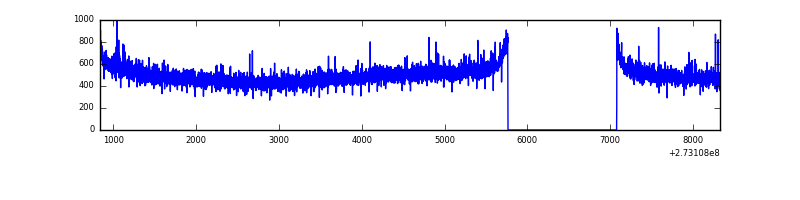 |
| B | 7488 | 6174 | 2 | 2 | 0.03% | 0.03% | 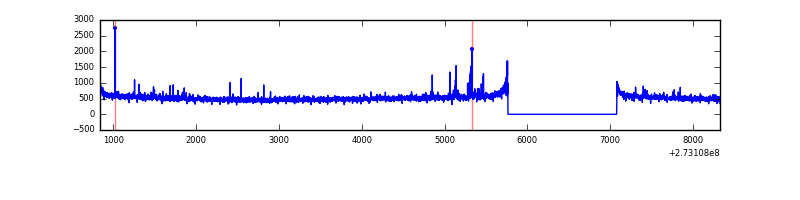 |
| C | 7488 | 6174 | 0 | 0 | 0.00% | 0.00% | 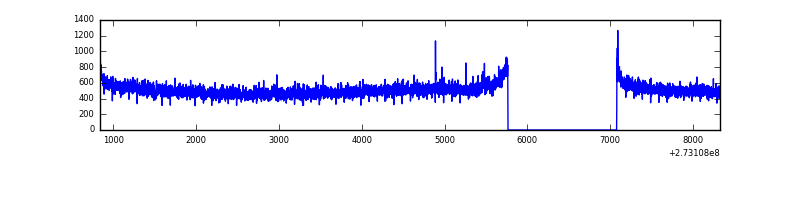 |
| D | 7488 | 6174 | 64 | 64 | 0.85% | 1.04% | 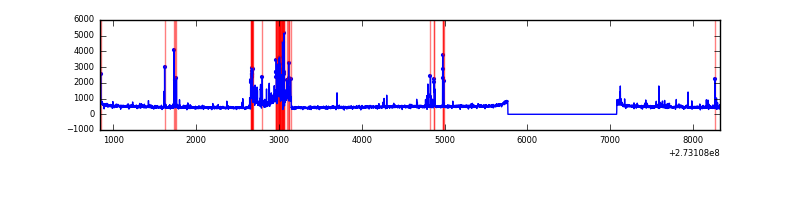 |
Top three noisy pixels from each quadrant. If the there are fewer than three noisy pixels in the level2.evt file, extra rows are filled as -1
| Pixel properties | Quadrant properties | ||||||
|---|---|---|---|---|---|---|---|
| Quadrant | DetID | PixID | Counts | Sigma | Mean | Median | Sigma |
| A | 9 | 143 | 7795 | 43.83 | 793 | 780 | 160.0 |
| A | 0 | 226 | 7179 | 39.99 | 793 | 780 | 160.0 |
| A | 12 | 194 | 5806 | 31.41 | 793 | 780 | 160.0 |
| B | 5 | 236 | 37908 | 248.56 | 800 | 782 | 149.4 |
| B | 3 | 209 | 21303 | 137.39 | 800 | 782 | 149.4 |
| B | 12 | 111 | 17039 | 108.84 | 800 | 782 | 149.4 |
| C | 14 | 238 | 119479 | 666.54 | 762 | 768 | 178.1 |
| C | 3 | 233 | 19143 | 103.17 | 762 | 768 | 178.1 |
| C | 7 | 247 | 17079 | 91.58 | 762 | 768 | 178.1 |
| D | 13 | 104 | 379981 | 1888.55 | 749 | 737 | 200.8 |
| D | 1 | 52 | 54090 | 265.69 | 749 | 737 | 200.8 |
| D | 5 | 51 | 41838 | 204.67 | 749 | 737 | 200.8 |
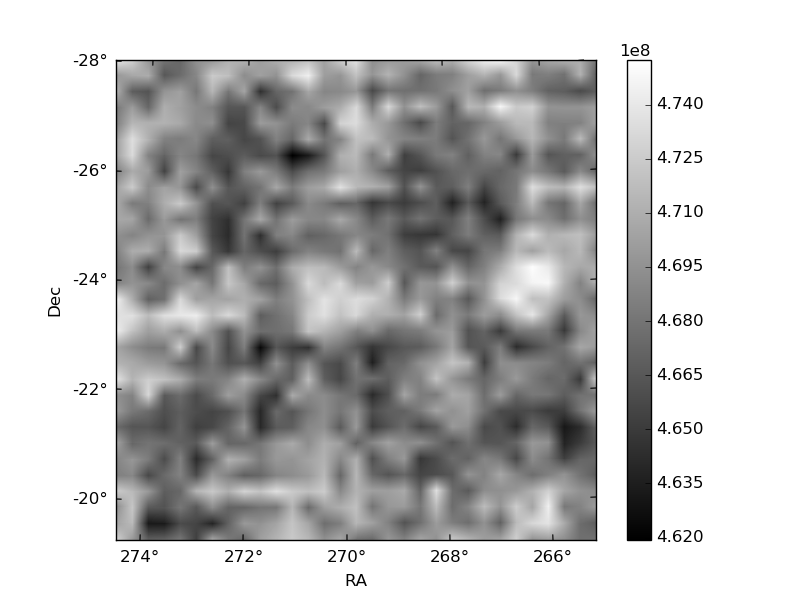
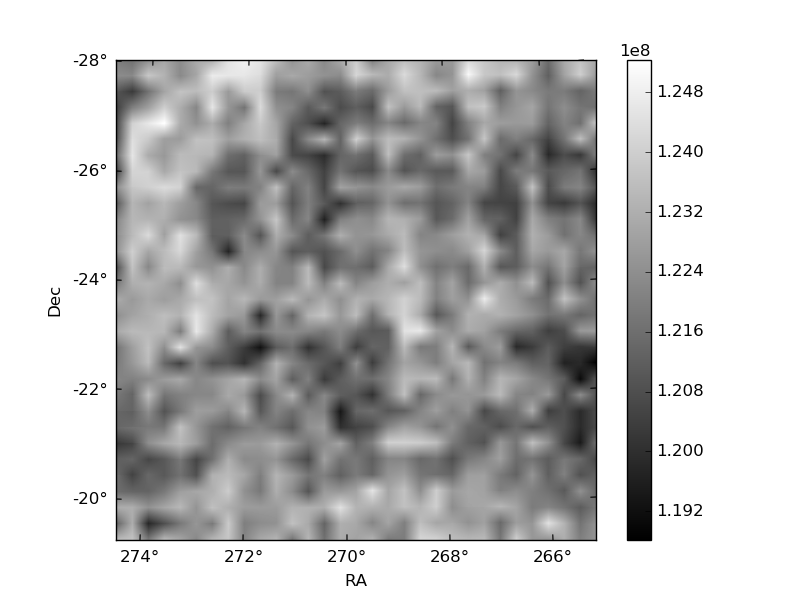
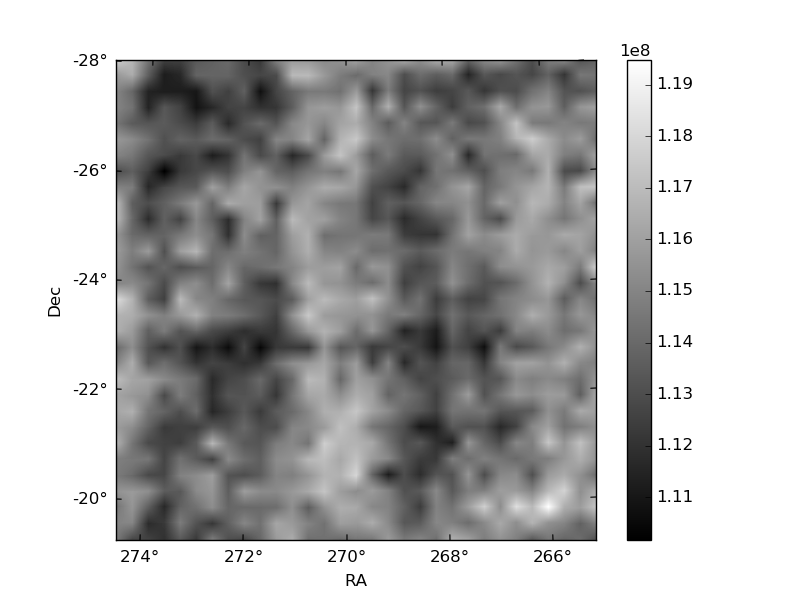
Histogram calculated using DETX and DETY for each event in the final _common_clean file
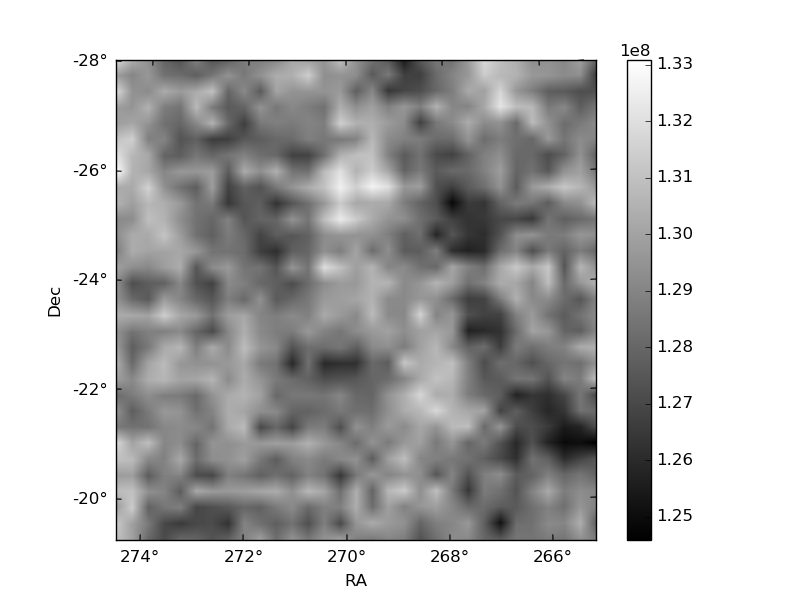
| Quadrant A | 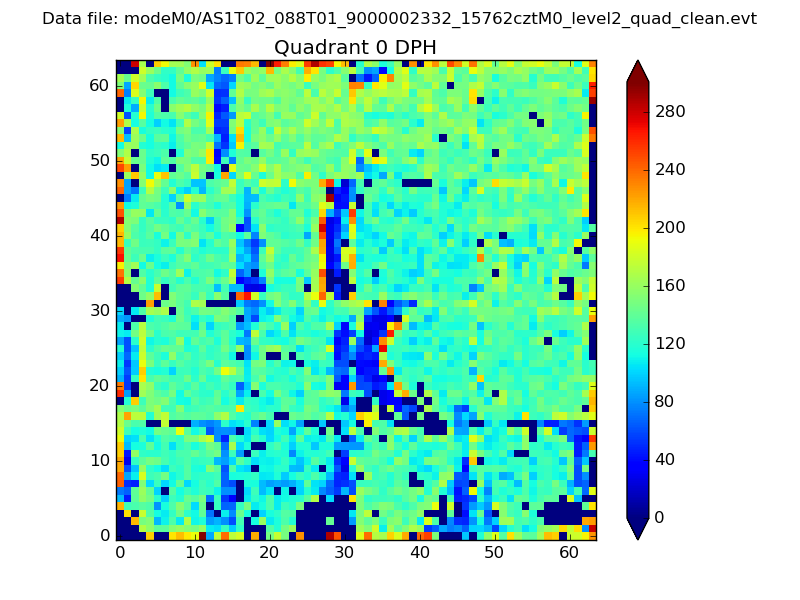 |
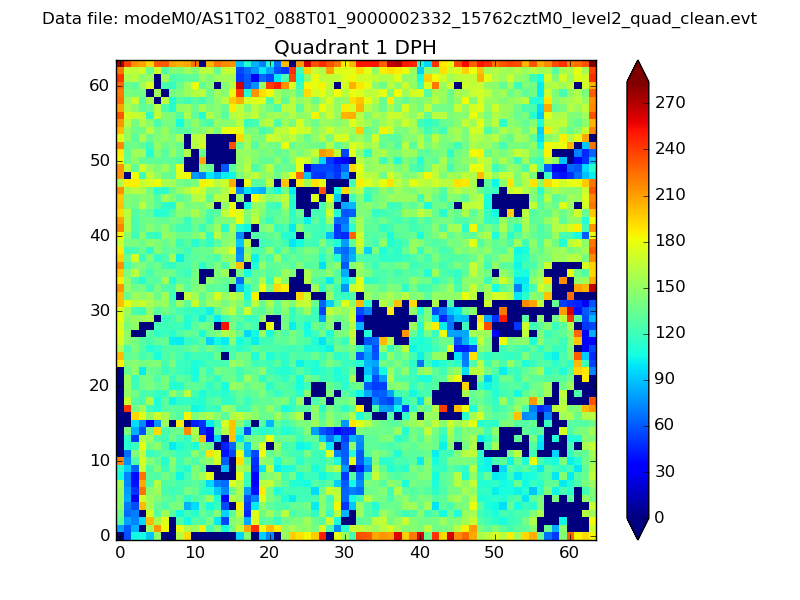 |
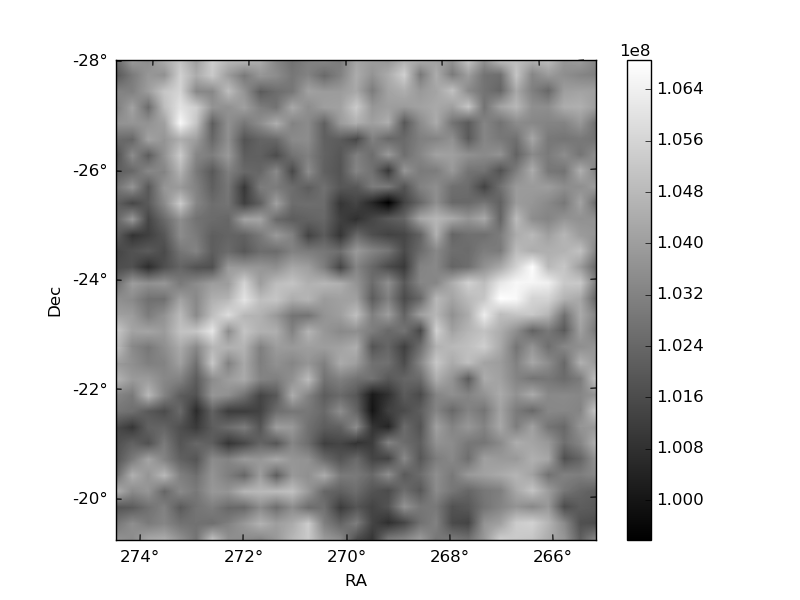
Quadrant B |
|---|---|---|---|
| Quadrant D | 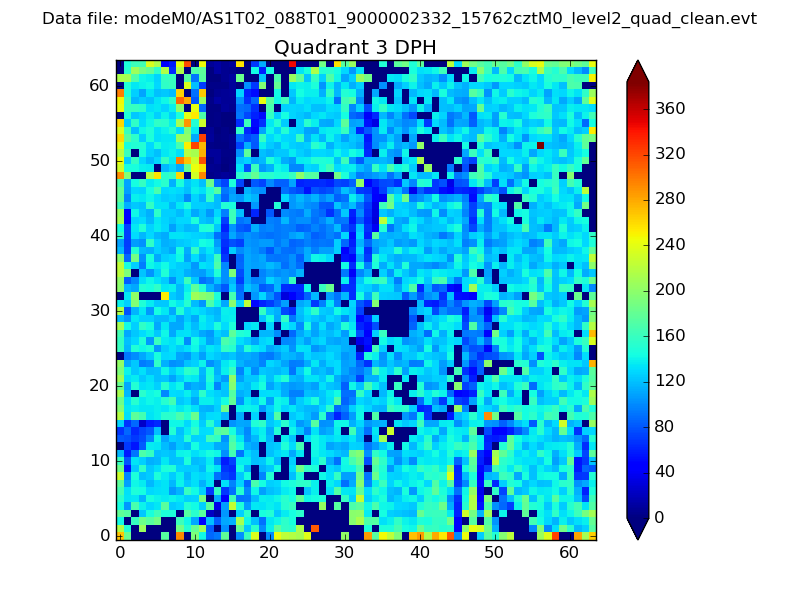 |
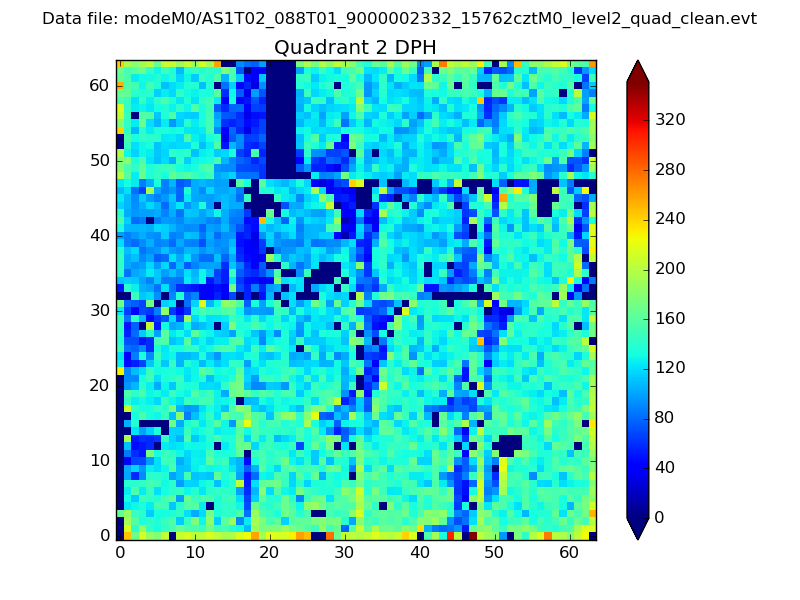 |
Quadrant C |
| Plot type | Count rate plots | Images |
|---|---|---|
| Comparison with Poisson distribution Blue bars denote a histogram of data divided into 1 sec bins. Red curve is a Poisson curve with rate = median count rate of data. |
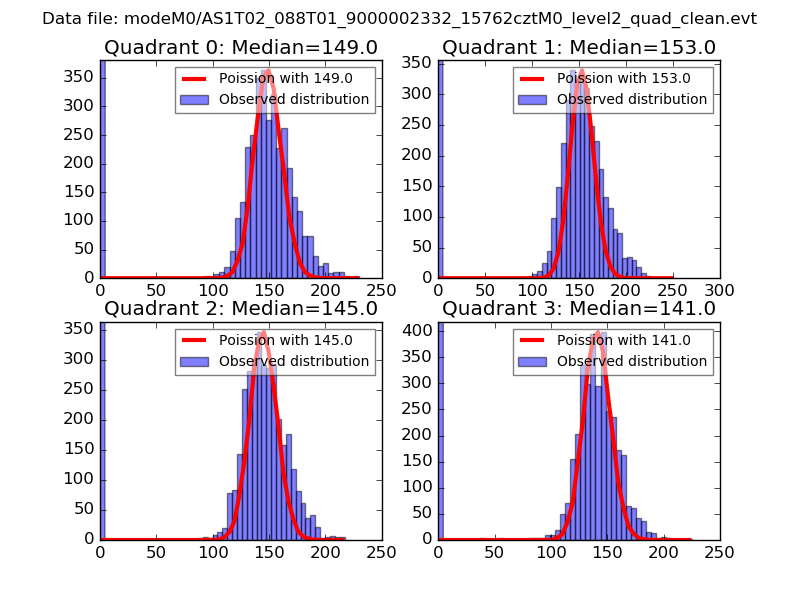 |
 |
| Quadrant-wise count rates Data is divided into 100 sec bins |
 |
|
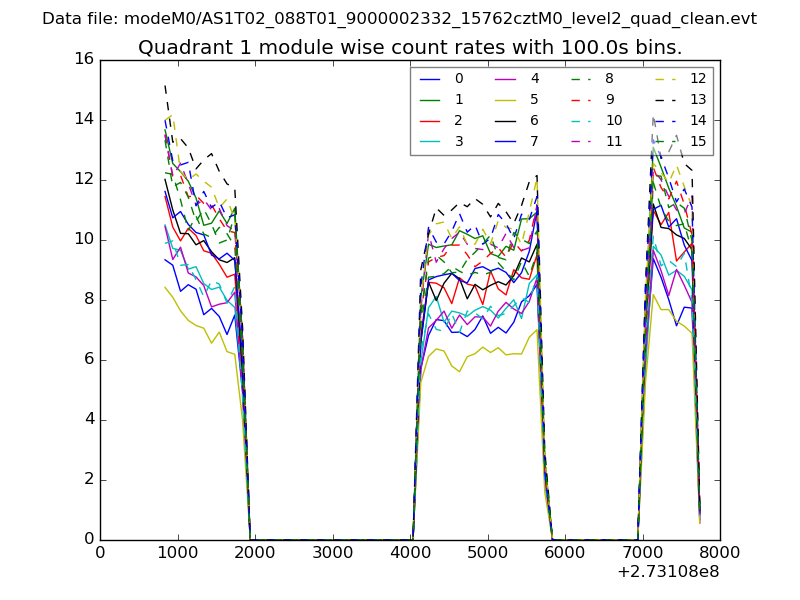
| Module-wise count rates for Quadrant A Data is divided into 100 sec bins |
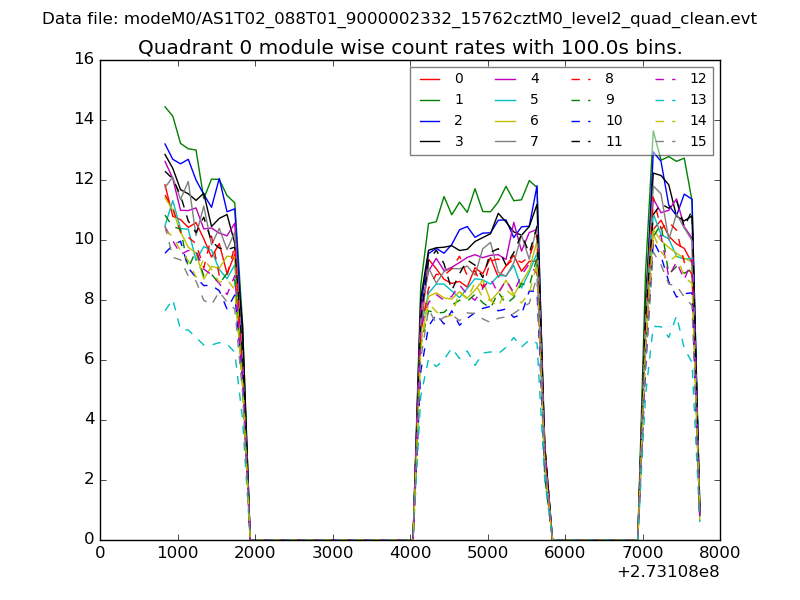 |
 |
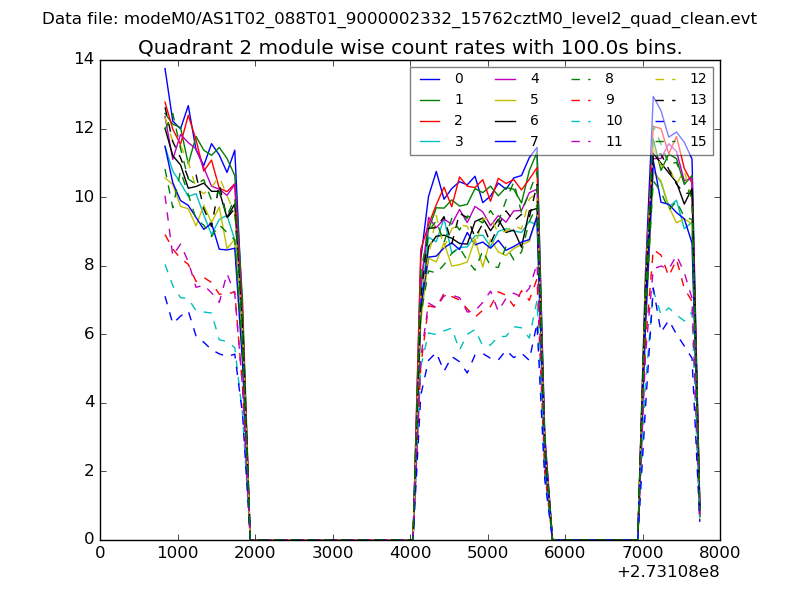
| Module-wise count rates for Quadrant B Data is divided into 100 sec bins |
 |
 |
| Module-wise count rates for Quadrant C Data is divided into 100 sec bins |
 |
 |
| Module-wise count rates for Quadrant D Data is divided into 100 sec bins |
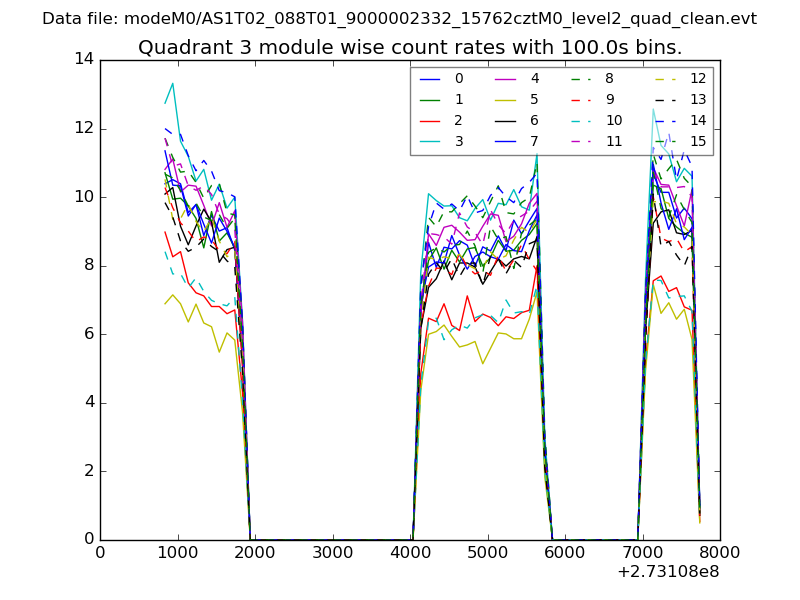 |
 |
| Parameter | Plot |
|---|---|
| CZT HV Monitor | 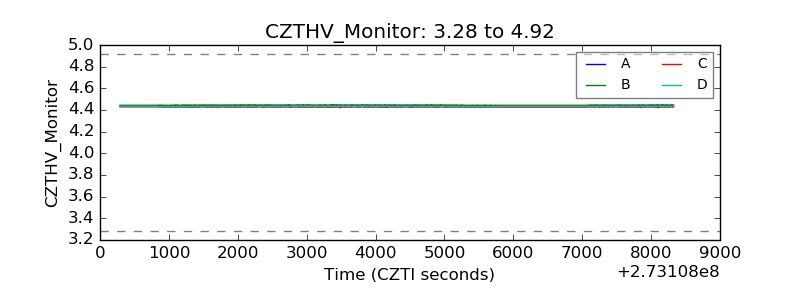 |
| D_VDD | 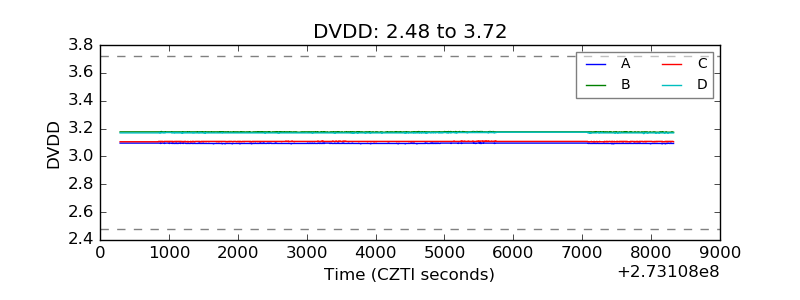 |
| Temperature 1 |  |
| Veto HV Monitor | 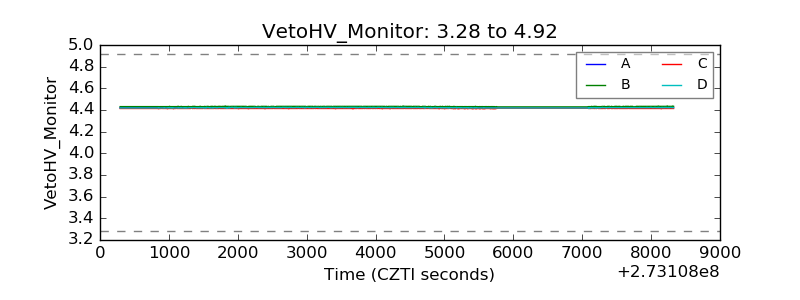 |
| Veto LLD | 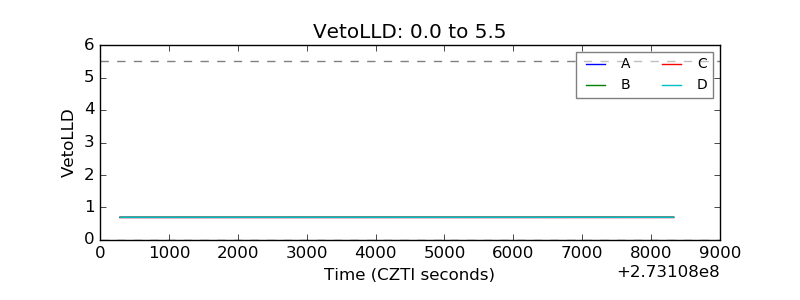 |
| Alpha Counter | 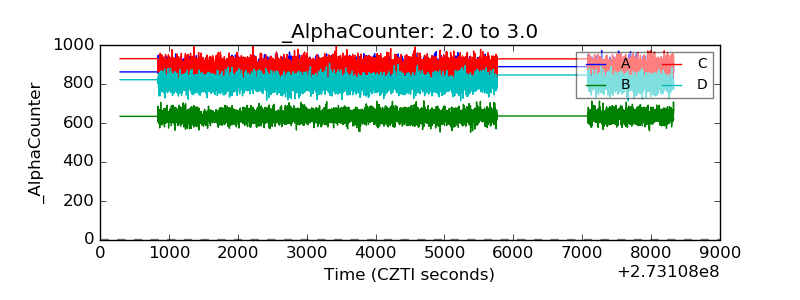 |
| _CPM_Rate | 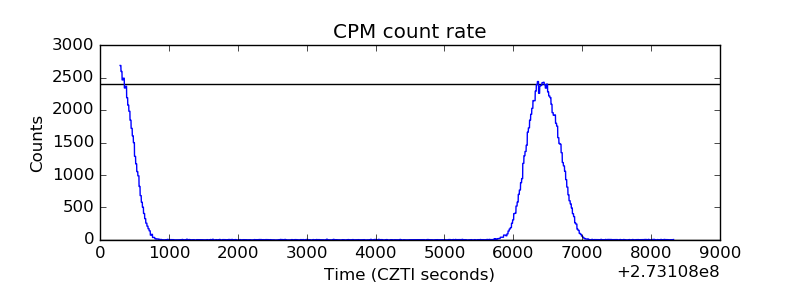 |
| CZT Counter | 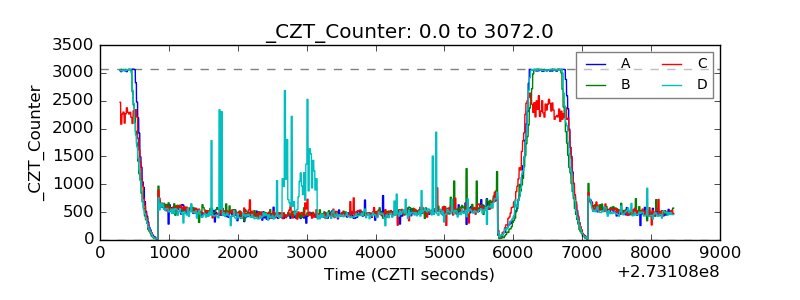 |
| +2.5 Volts monitor |  |
| +5 Volts monitor |  |
| _ROLL_ROT | 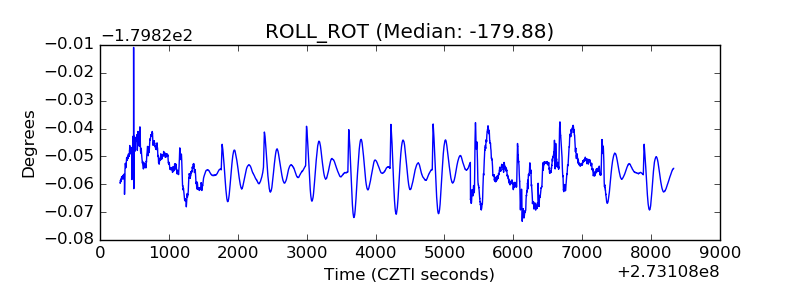 |
| _Roll_DEC | 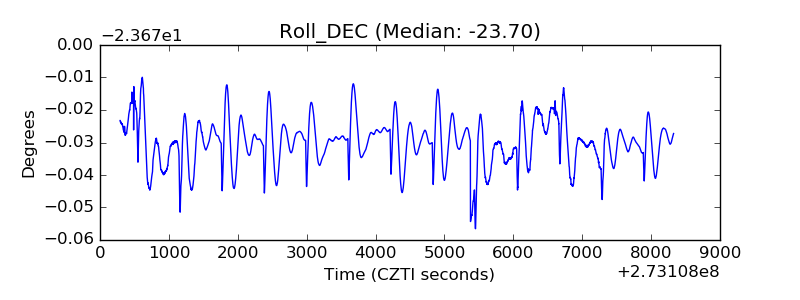 |
| _Roll_RA | 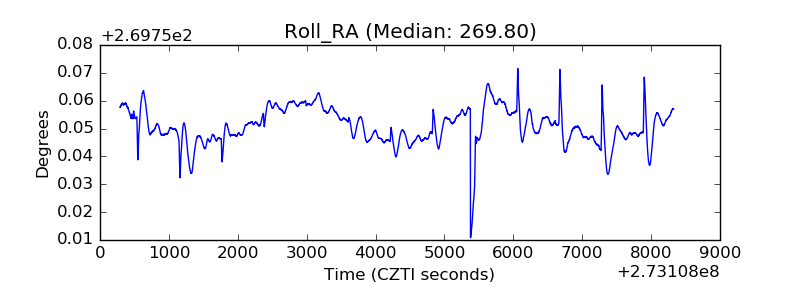 |
| Veto Counter | 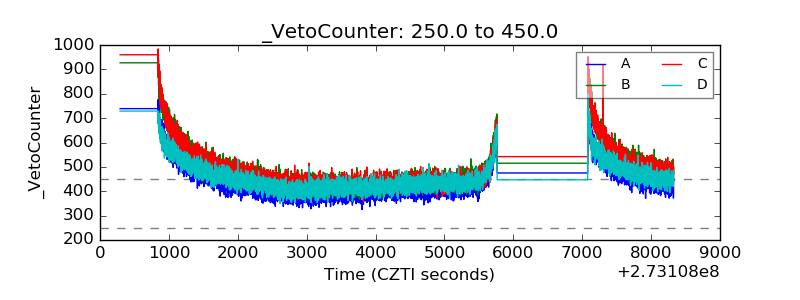 |