| Param | Original file | Final file |
|---|---|---|
| Filename | modeM0/AS1T02_088T01_9000002332_15763cztM0_level2.evt | modeM0/AS1T02_088T01_9000002332_15763cztM0_level2_quad_clean.evt |
| Size (bytes) | 264,818,880 | 42,580,800 |
| Size | 252.6 MB | 40.6 MB |
| Events in quadrant A | 1,926,950 | 254,168 |
| Events in quadrant B | 1,987,419 | 262,986 |
| Events in quadrant C | 1,963,395 | 248,548 |
| Events in quadrant D | 1,868,809 | 240,978 |
| Mode M9 | |||
|---|---|---|---|
| Quadrant | BADHDUFLAG | Total packets | Discarded packets |
| A | 0 | 5 | 0 |
| B | 0 | 5 | 0 |
| C | 0 | 5 | 0 |
| D | 0 | 6 | 0 |
| Mode SS | |||
|---|---|---|---|
| Quadrant | BADHDUFLAG | Total packets | Discarded packets |
| A | 0 | 80 | 0 |
| B | 0 | 80 | 0 |
| C | 0 | 80 | 0 |
| D | 0 | 80 | 0 |
| Mode M0 | |||
|---|---|---|---|
| Quadrant | BADHDUFLAG | Total packets | Discarded packets |
| A | 0 | 8160 | 1 |
| B | 0 | 8254 | 1 |
| C | 0 | 8151 | 1 |
| D | 0 | 8179 | 1 |
| Quadrant | Total seconds | Saturated seconds | Saturation percentage |
|---|---|---|---|
| A | 3999 | 1 | 0.025006% |
| B | 3999 | 6 | 0.150038% |
| C | 3999 | 15 | 0.375094% |
| D | 3999 | 3 | 0.075019% |
Noise dominated data is calculated using 1-second bins in cleaned event files. If a bin has >2000 counts, and if more than 50% of those come from <1% of pixels, then it is considered to be noise-dominated and hence unusable.
| Quadrant | # 1 sec bins | Bins with >0 counts | Bins with >2000 counts | High rate bins dominated by noise | Noise dominated (total time) | Noise dominated (detector-on time) | Marked lightcurve |
|---|---|---|---|---|---|---|---|
| A | 4000 | 4000 | 0 | 0 | 0.00% | 0.00% | 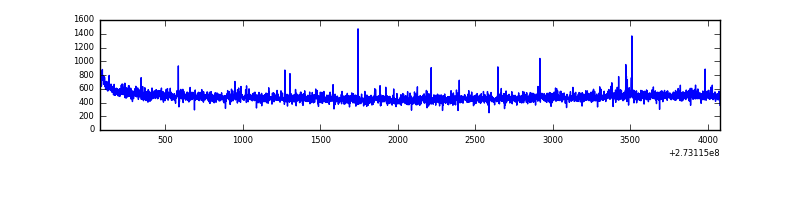 |
| B | 4000 | 4000 | 0 | 0 | 0.00% | 0.00% | 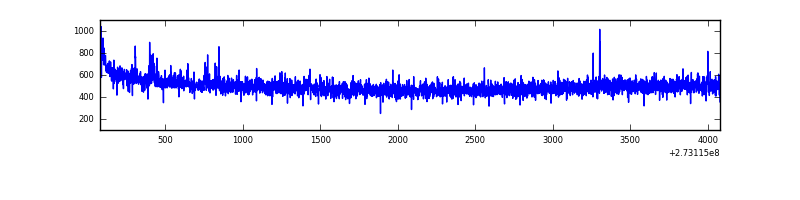 |
| C | 4000 | 4000 | 0 | 0 | 0.00% | 0.00% | 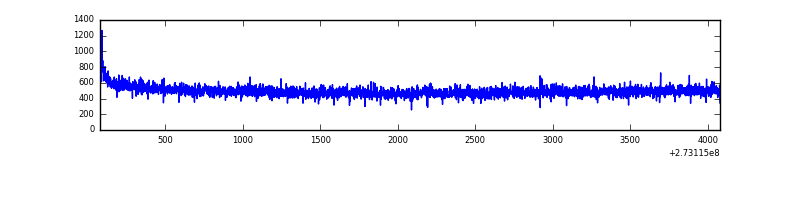 |
| D | 4000 | 4000 | 1 | 1 | 0.03% | 0.03% | 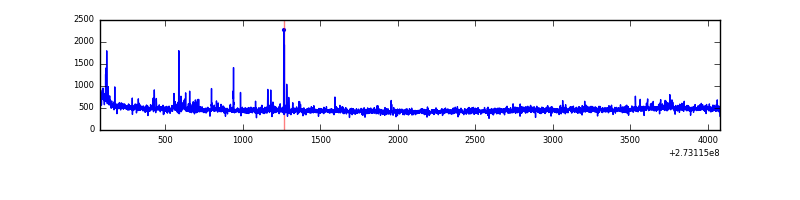 |
Top three noisy pixels from each quadrant. If the there are fewer than three noisy pixels in the level2.evt file, extra rows are filled as -1
| Pixel properties | Quadrant properties | ||||||
|---|---|---|---|---|---|---|---|
| Quadrant | DetID | PixID | Counts | Sigma | Mean | Median | Sigma |
| A | 4 | 2 | 14355 | 137.45 | 496 | 487 | 100.9 |
| A | 9 | 143 | 5159 | 46.31 | 496 | 487 | 100.9 |
| A | 0 | 226 | 4396 | 38.74 | 496 | 487 | 100.9 |
| B | 12 | 111 | 10821 | 108.61 | 503 | 492 | 95.1 |
| B | 4 | 251 | 10123 | 101.27 | 503 | 492 | 95.1 |
| B | 11 | 111 | 9240 | 91.98 | 503 | 492 | 95.1 |
| C | 14 | 238 | 75166 | 666.16 | 481 | 486 | 112.1 |
| C | 7 | 247 | 4911 | 39.47 | 481 | 486 | 112.1 |
| C | 3 | 233 | 4389 | 34.82 | 481 | 486 | 112.1 |
| D | 5 | 51 | 22460 | 172.83 | 475 | 465 | 127.3 |
| D | 1 | 52 | 17648 | 135.02 | 475 | 465 | 127.3 |
| D | 2 | 234 | 14091 | 107.07 | 475 | 465 | 127.3 |
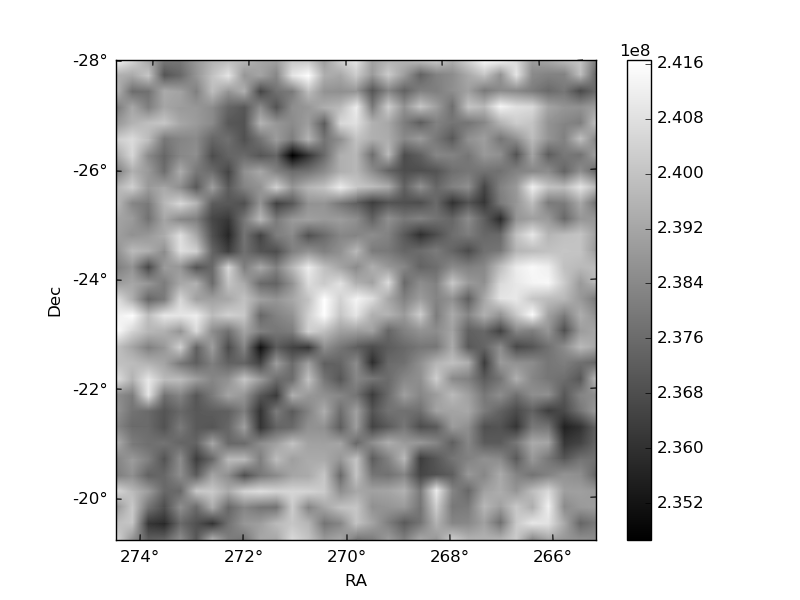
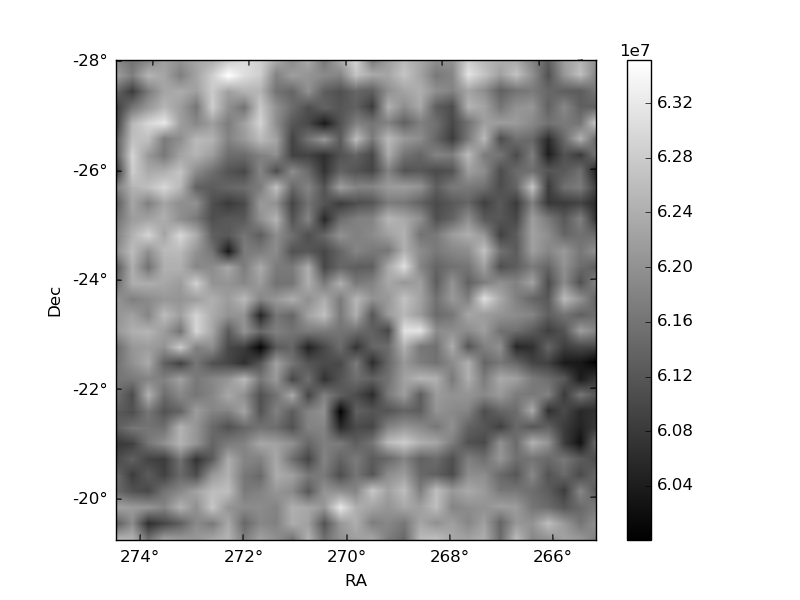
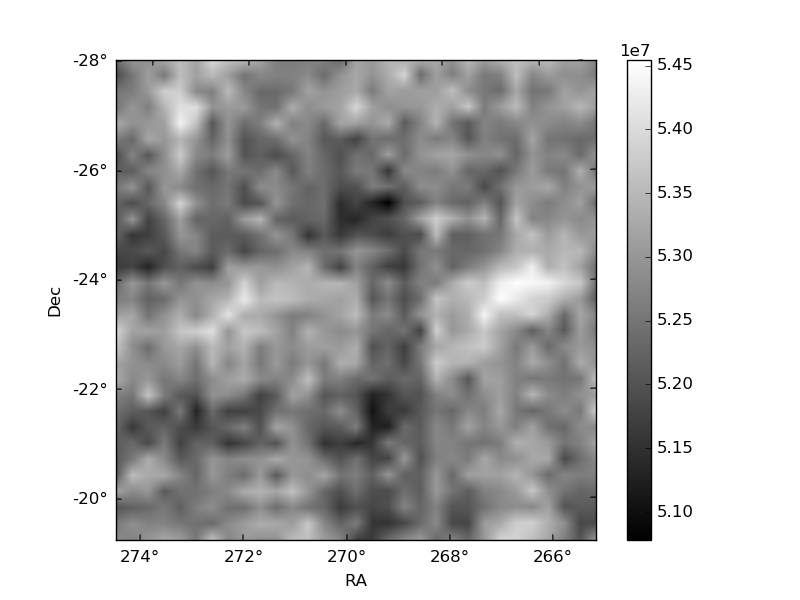
Histogram calculated using DETX and DETY for each event in the final _common_clean file
| Quadrant A | 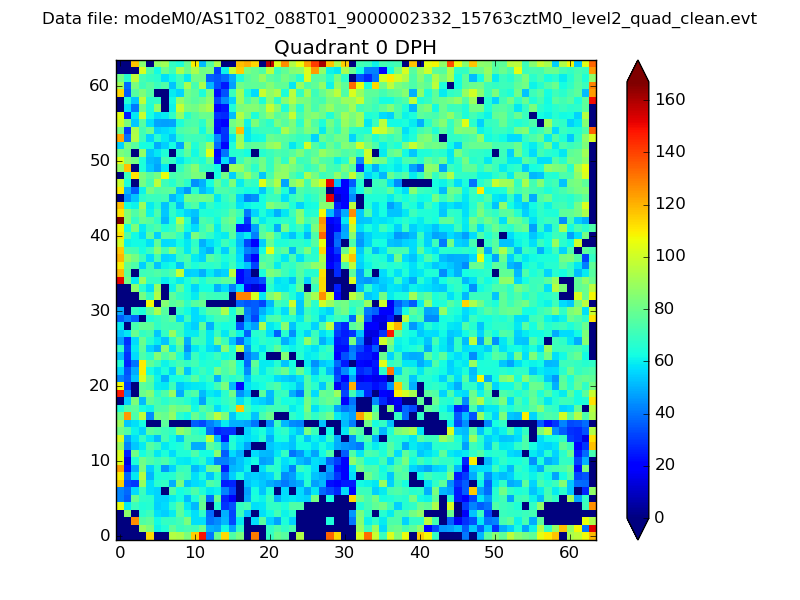 |
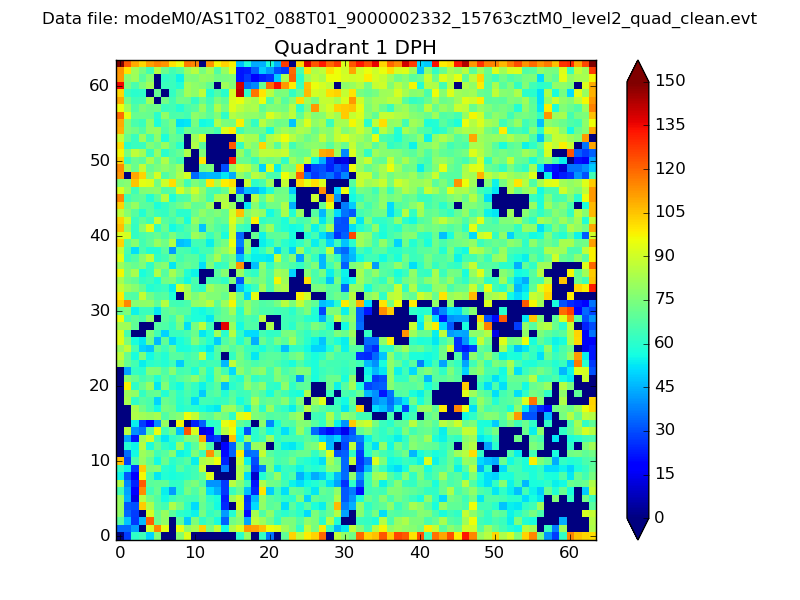 |
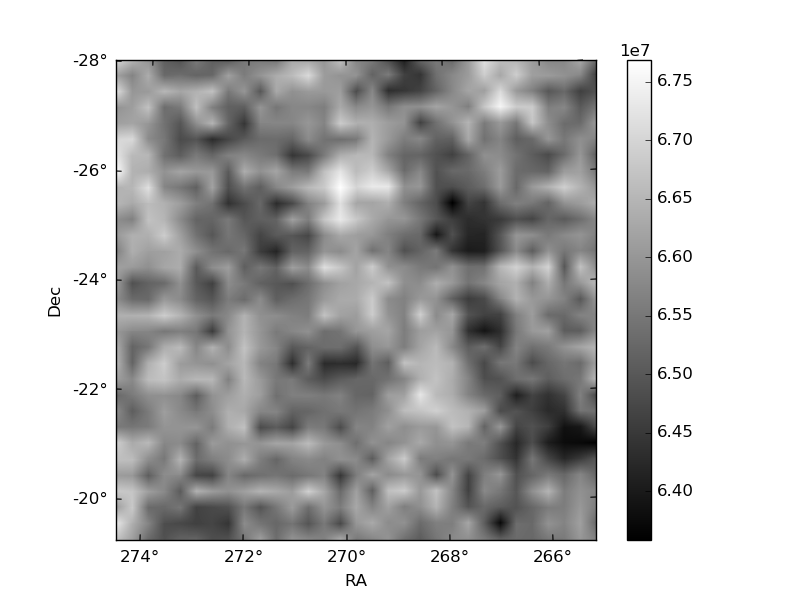
Quadrant B |
|---|---|---|---|
| Quadrant D | 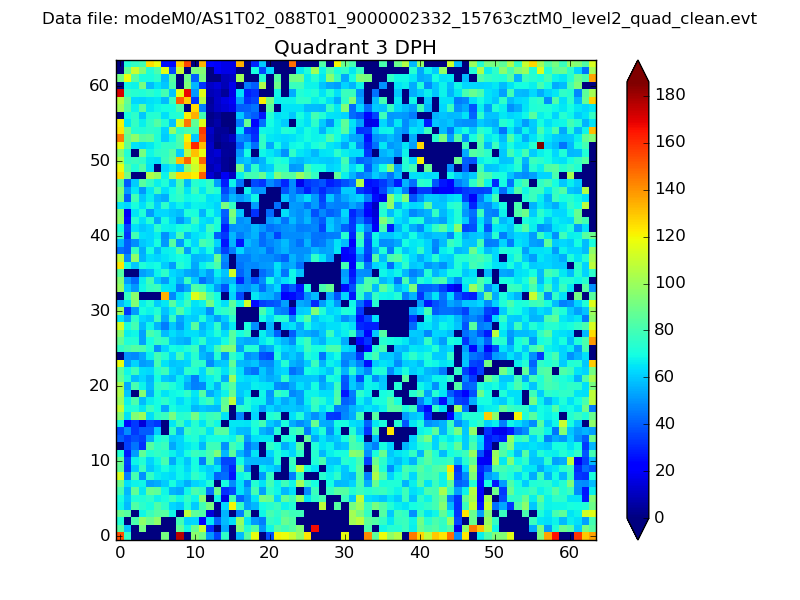 |
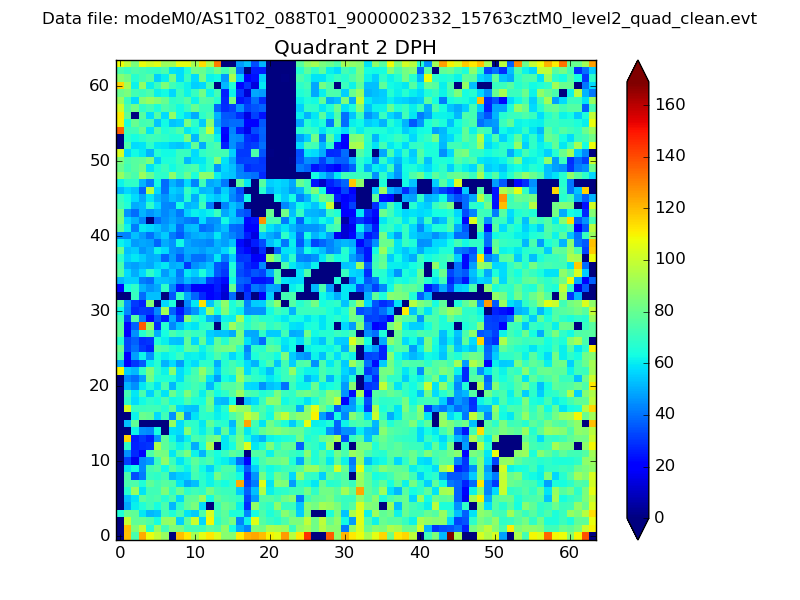 |
Quadrant C |
| Plot type | Count rate plots | Images |
|---|---|---|
| Comparison with Poisson distribution Blue bars denote a histogram of data divided into 1 sec bins. Red curve is a Poisson curve with rate = median count rate of data. |
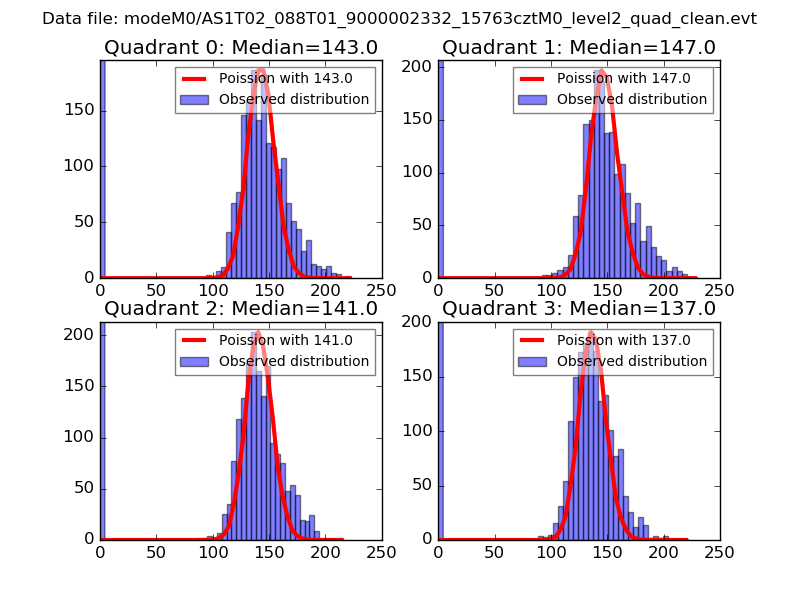 |
 |
| Quadrant-wise count rates Data is divided into 100 sec bins |
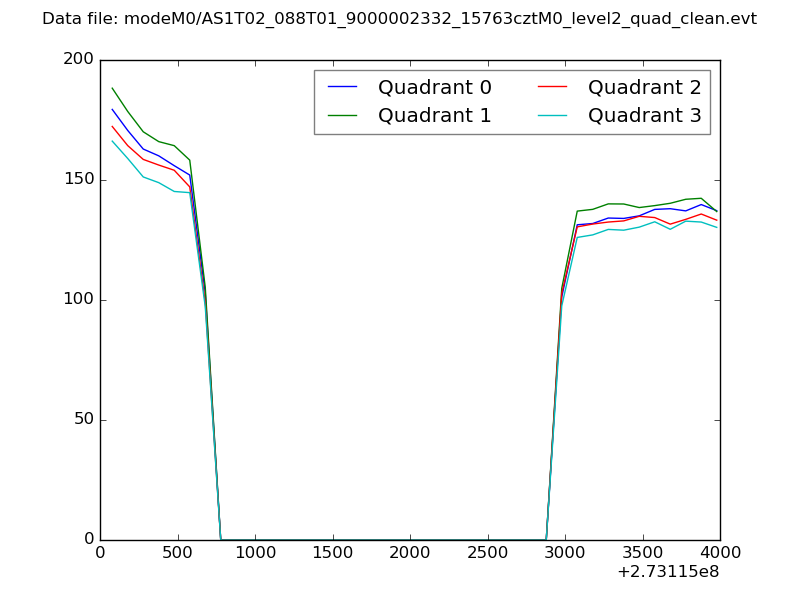 |
|
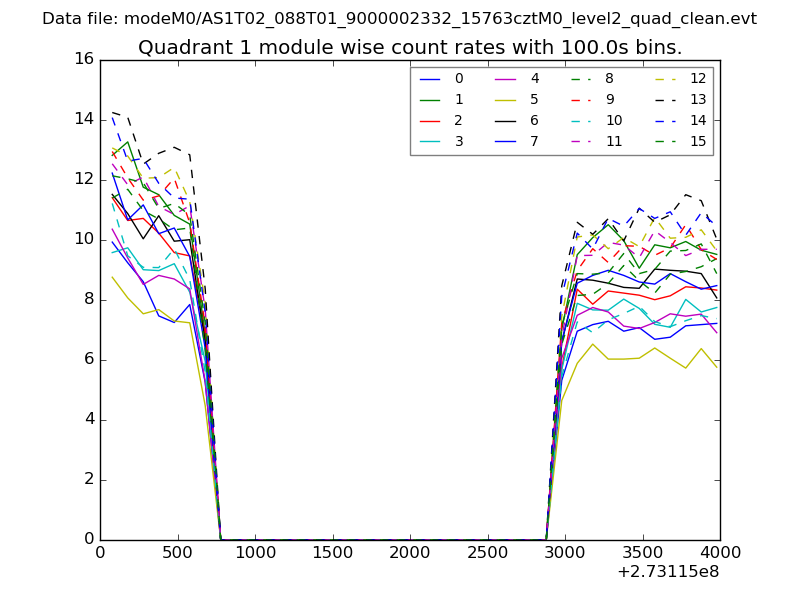
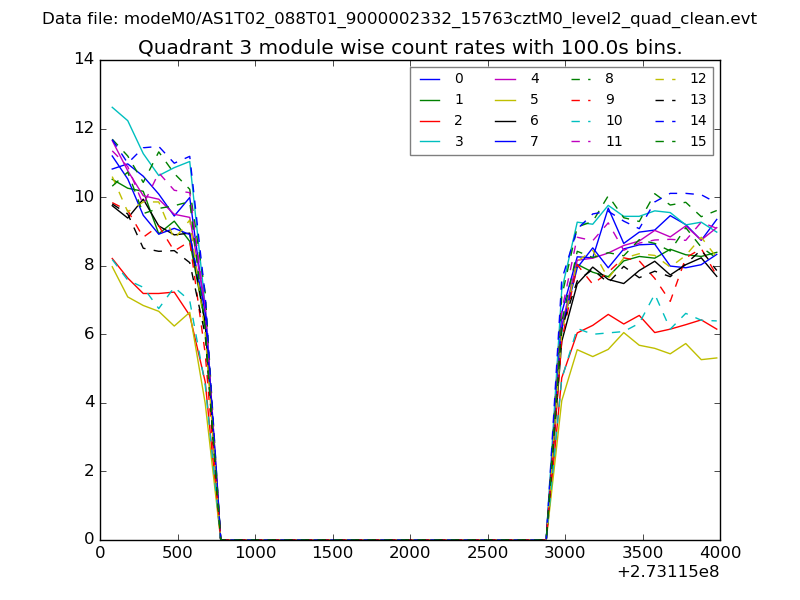
| Module-wise count rates for Quadrant A Data is divided into 100 sec bins |
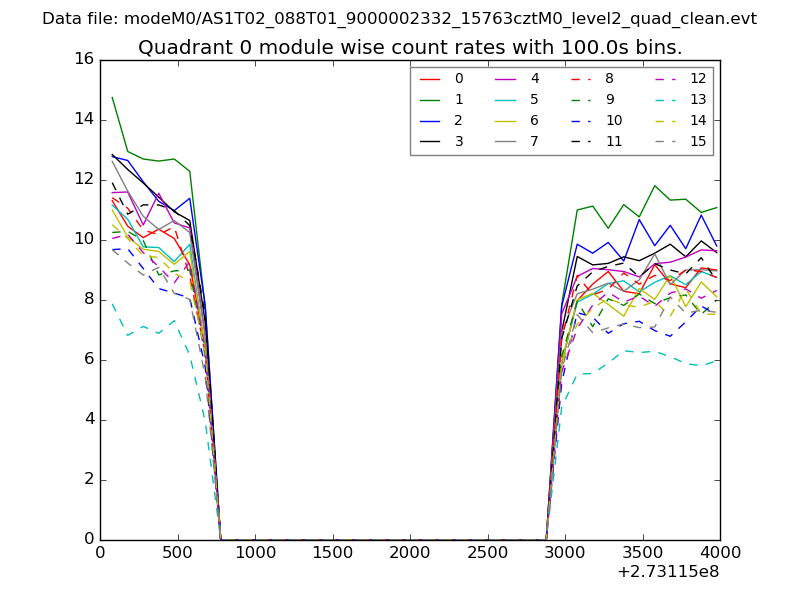 |
 |
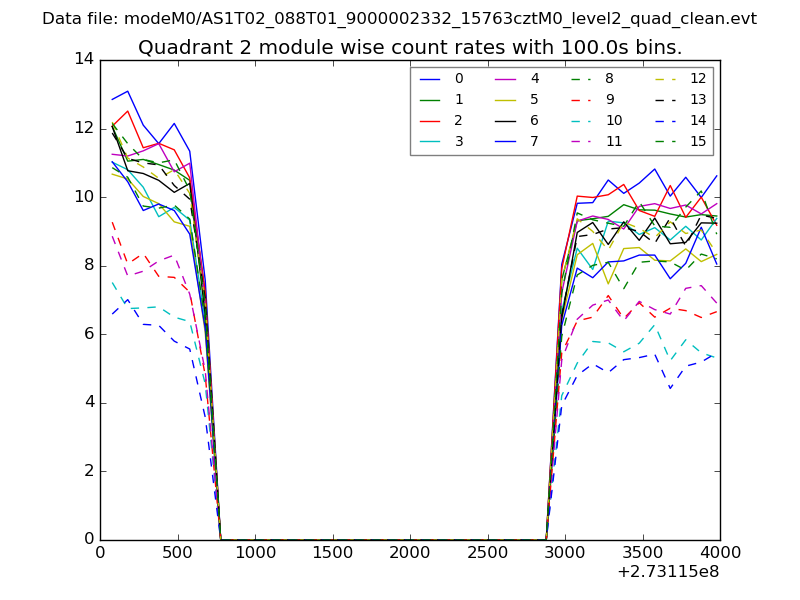
| Module-wise count rates for Quadrant B Data is divided into 100 sec bins |
 |
 |
| Module-wise count rates for Quadrant C Data is divided into 100 sec bins |
 |
 |
| Module-wise count rates for Quadrant D Data is divided into 100 sec bins |
 |
 |
| Parameter | Plot |
|---|---|
| CZT HV Monitor | 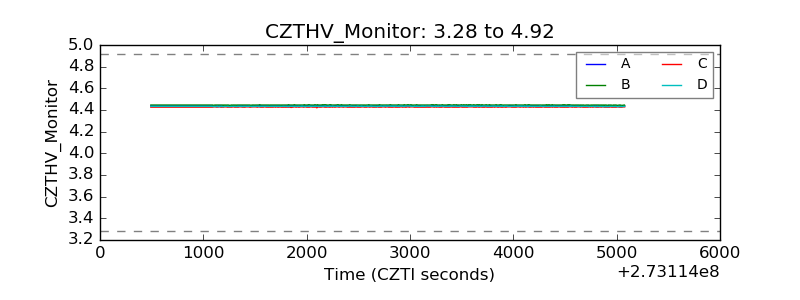 |
| D_VDD | 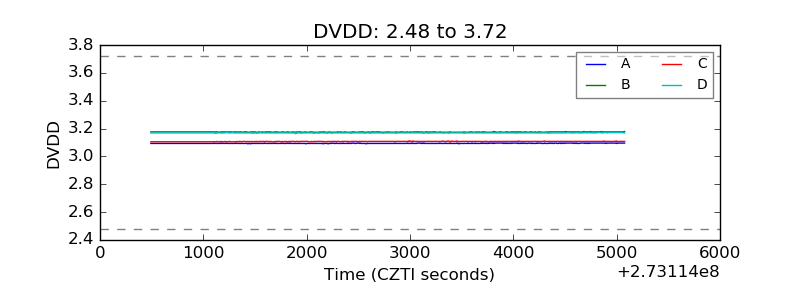 |
| Temperature 1 | 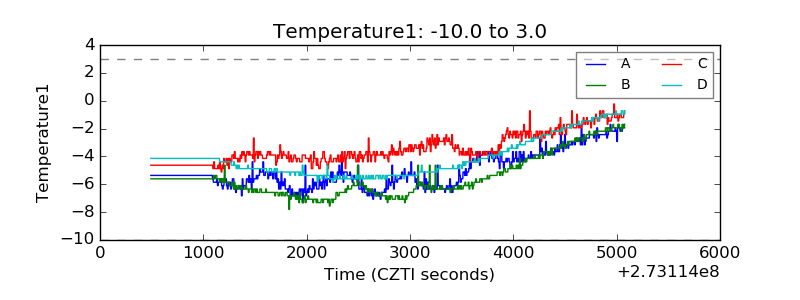 |
| Veto HV Monitor | 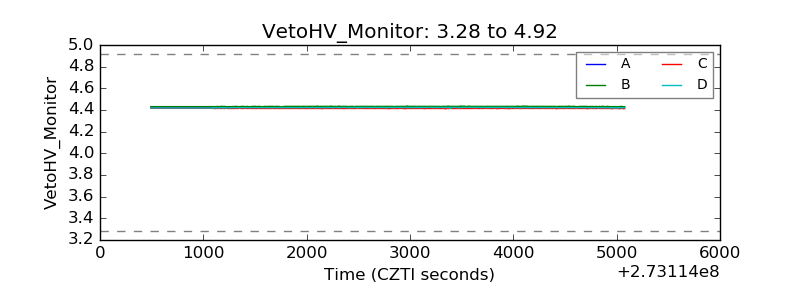 |
| Veto LLD | 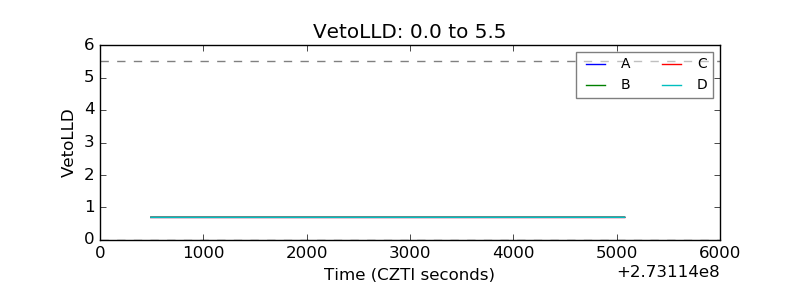 |
| Alpha Counter | 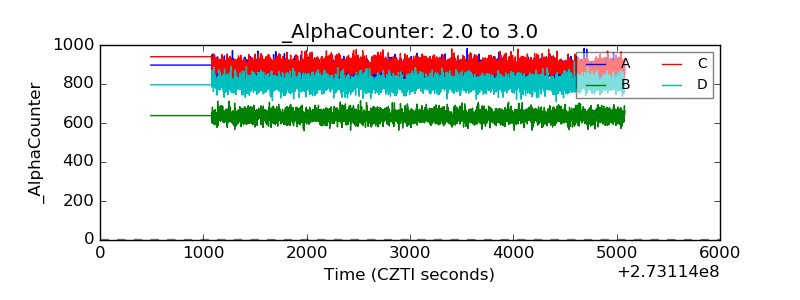 |
| _CPM_Rate | 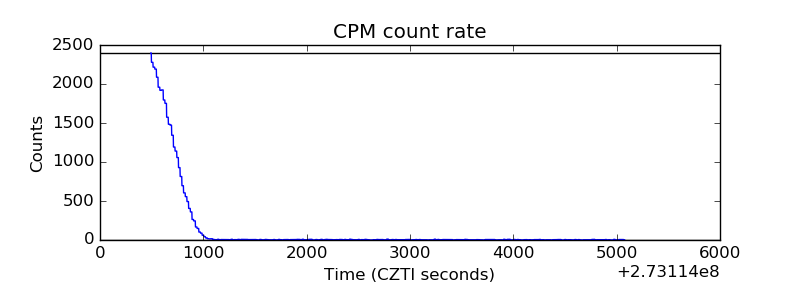 |
| CZT Counter | 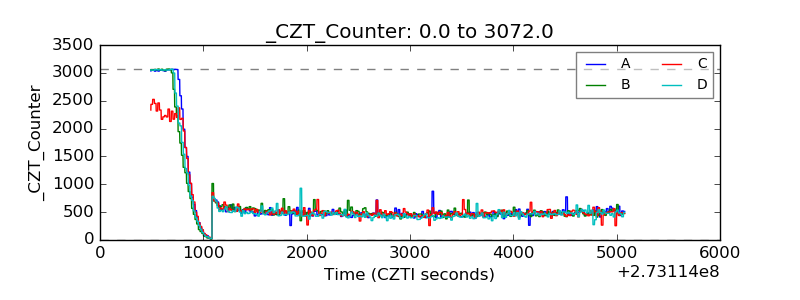 |
| +2.5 Volts monitor |  |
| +5 Volts monitor |  |
| _ROLL_ROT | 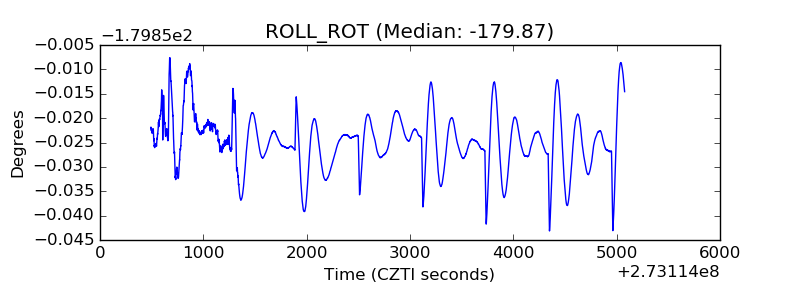 |
| _Roll_DEC | 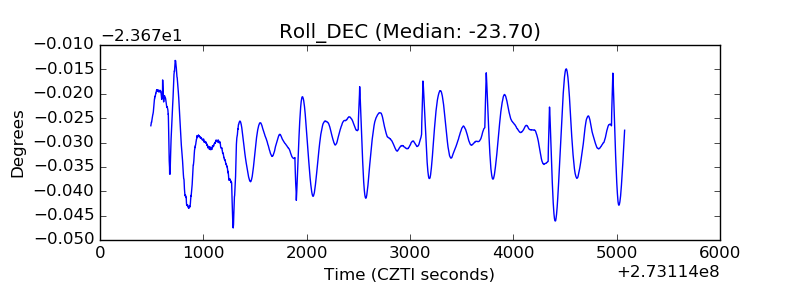 |
| _Roll_RA | 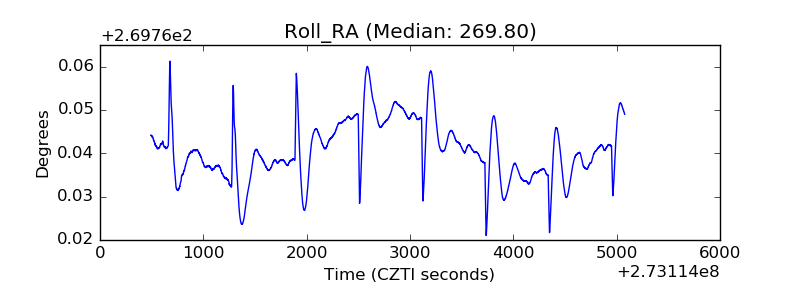 |
| Veto Counter | 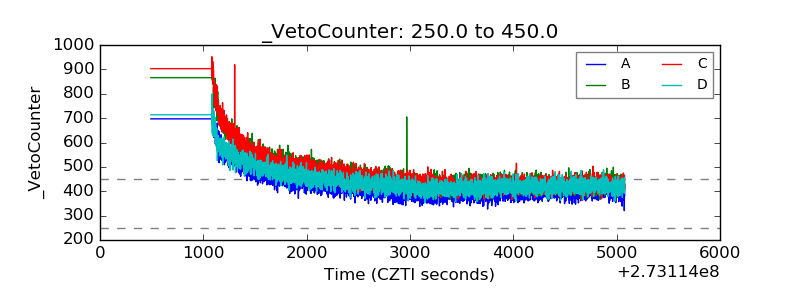 |