| Param | Original file | Final file |
|---|---|---|
| Filename | modeM0/AS1A04_100T01_9000002336cztM0_level2.fits | modeM0/AS1A04_100T01_9000002336cztM0_level2_quad_clean.evt |
| Size (bytes) | 1,334,828,160 | 1,384,525,440 |
| Size | 1.2 GB | 1.3 GB |
| Events in quadrant A | 8,027,772 | 8,237,447 |
| Events in quadrant B | 7,766,482 | 8,326,218 |
| Events in quadrant C | 8,030,960 | 8,232,139 |
| Events in quadrant D | 6,992,182 | 7,530,542 |
| Mode SS | |||
|---|---|---|---|
| Quadrant | BADHDUFLAG | Total packets | Discarded packets |
| A | 0 | 2854 | 0 |
| B | 0 | 2854 | 0 |
| C | 0 | 2854 | 0 |
| D | 0 | 2854 | 0 |
| Mode M0 | |||
|---|---|---|---|
| Quadrant | BADHDUFLAG | Total packets | Discarded packets |
| A | 0 | 293511 | 0 |
| B | 0 | 310022 | 0 |
| C | 0 | 292738 | 0 |
| D | 0 | 296782 | 0 |
| Mode M9 | |||
|---|---|---|---|
| Quadrant | BADHDUFLAG | Total packets | Discarded packets |
| A | 0 | 224 | 0 |
| B | 0 | 224 | 0 |
| C | 0 | 224 | 0 |
| D | 0 | 224 | 0 |
| Quadrant | Total seconds | Saturated seconds | Saturation percentage |
|---|---|---|---|
| A | 140218 | 1949 | 1.389978% |
| B | 140218 | 2588 | 1.845697% |
| C | 140218 | 2291 | 1.633884% |
| D | 140218 | 1624 | 1.158197% |
Noise dominated data is calculated using 1-second bins in cleaned event files. If a bin has >2000 counts, and if more than 50% of those come from <1% of pixels, then it is considered to be noise-dominated and hence unusable.
| Quadrant | # 1 sec bins | Bins with >0 counts | Bins with >2000 counts | High rate bins dominated by noise | Noise dominated (total time) | Noise dominated (detector-on time) | Marked lightcurve |
|---|---|---|---|---|---|---|---|
| A | 162773 | 140217 | 0 | 0 | 0.00% | 0.00% |  |
| B | 162773 | 140216 | 0 | 0 | 0.00% | 0.00% |  |
| C | 162773 | 140217 | 0 | 0 | 0.00% | 0.00% |  |
| D | 162773 | 140219 | 0 | 0 | 0.00% | 0.00% |  |
Top three noisy pixels from each quadrant. If the there are fewer than three noisy pixels in the level2.evt file, extra rows are filled as -1
| Pixel properties | Quadrant properties | ||||||
|---|---|---|---|---|---|---|---|
| Quadrant | DetID | PixID | Counts | Sigma | Mean | Median | Sigma |
| A | 0 | 29 | 7875 | 11.42 | 2092 | 1963 | 517.8 |
| A | 7 | 110 | 6531 | 8.82 | 2092 | 1963 | 517.8 |
| A | 15 | 236 | 6122 | 8.03 | 2092 | 1963 | 517.8 |
| B | 2 | 9 | 6451 | 11.21 | 2058 | 1962 | 400.4 |
| B | 2 | 8 | 5372 | 8.52 | 2058 | 1962 | 400.4 |
| B | 3 | 17 | 5126 | 7.9 | 2058 | 1962 | 400.4 |
| C | 12 | 241 | 5641 | 6.77 | 2123 | 1980 | 541.1 |
| C | 3 | 126 | 5397 | 6.32 | 2123 | 1980 | 541.1 |
| C | 2 | 191 | 5340 | 6.21 | 2123 | 1980 | 541.1 |
| D | 3 | 14 | 5201 | 6.43 | 1996 | 1816 | 526.0 |
| D | 6 | 231 | 5034 | 6.12 | 1996 | 1816 | 526.0 |
| D | 7 | 3 | 4873 | 5.81 | 1996 | 1816 | 526.0 |
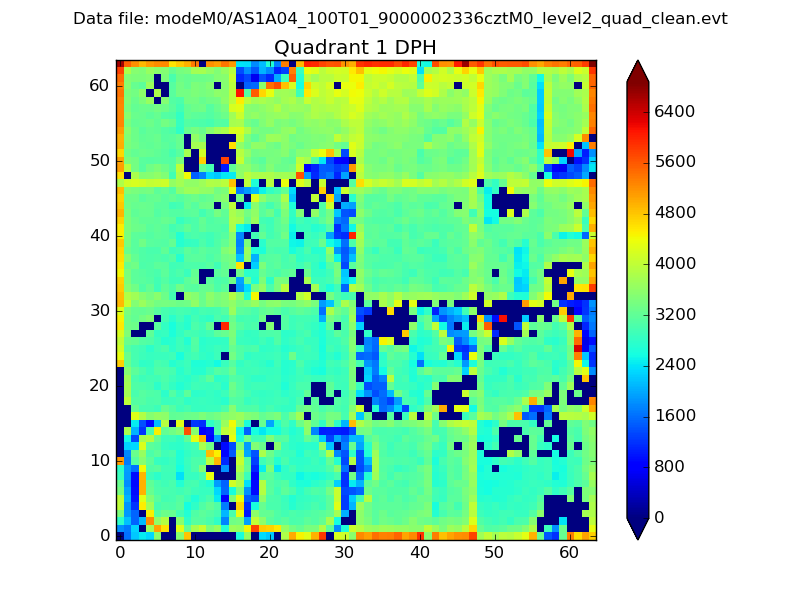
Histogram calculated using DETX and DETY for each event in the final _common_clean file
| Quadrant A |  |
 |
Quadrant B |
|---|---|---|---|
| Quadrant D |  |
 |
Quadrant C |
| Plot type | Count rate plots | Images |
|---|---|---|
| Comparison with Poisson distribution Blue bars denote a histogram of data divided into 1 sec bins. Red curve is a Poisson curve with rate = median count rate of data. |
 |
 |
| Quadrant-wise count rates Data is divided into 100 sec bins |
 |
|
| Module-wise count rates for Quadrant A Data is divided into 100 sec bins |
 |
 |
| Module-wise count rates for Quadrant B Data is divided into 100 sec bins |
 |
 |
| Module-wise count rates for Quadrant C Data is divided into 100 sec bins |
 |
 |
| Module-wise count rates for Quadrant D Data is divided into 100 sec bins |
 |
 |
| Parameter | Plot |
|---|---|
| CZT HV Monitor |  |
| D_VDD | 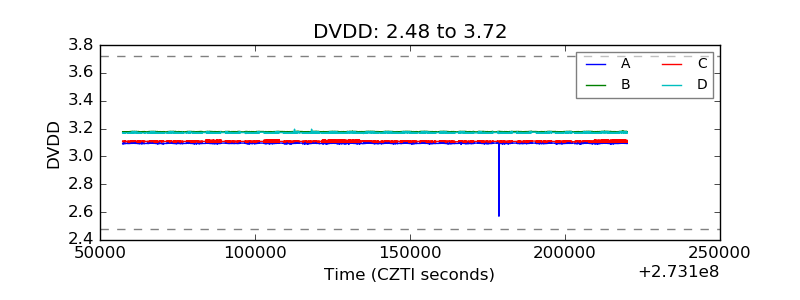 |
| Temperature 1 |  |
| Veto HV Monitor |  |
| Veto LLD |  |
| Alpha Counter |  |
| _CPM_Rate |  |
| CZT Counter |  |
| +2.5 Volts monitor |  |
| +5 Volts monitor |  |
| _ROLL_ROT |  |
| _Roll_DEC |  |
| _Roll_RA |  |
| Veto Counter |  |