| Param | Original file | Final file |
|---|---|---|
| Filename | modeM0/AS1A04_100T01_9000002336_15771cztM0_level2.evt | modeM0/AS1A04_100T01_9000002336_15771cztM0_level2_quad_clean.evt |
| Size (bytes) | 893,816,640 | 159,730,560 |
| Size | 852.4 MB | 152.3 MB |
| Events in quadrant A | 6,334,146 | 973,269 |
| Events in quadrant B | 6,815,941 | 990,482 |
| Events in quadrant C | 6,449,321 | 973,818 |
| Events in quadrant D | 6,548,866 | 960,413 |
| Mode SS | |||
|---|---|---|---|
| Quadrant | BADHDUFLAG | Total packets | Discarded packets |
| A | 0 | 278 | 0 |
| B | 0 | 278 | 0 |
| C | 0 | 278 | 0 |
| D | 0 | 278 | 0 |
| Mode M0 | |||
|---|---|---|---|
| Quadrant | BADHDUFLAG | Total packets | Discarded packets |
| A | 0 | 27809 | 4 |
| B | 0 | 28803 | 3 |
| C | 0 | 27908 | 3 |
| D | 0 | 28859 | 3 |
| Mode M9 | |||
|---|---|---|---|
| Quadrant | BADHDUFLAG | Total packets | Discarded packets |
| A | 0 | 21 | 0 |
| B | 0 | 21 | 0 |
| C | 0 | 21 | 0 |
| D | 0 | 21 | 0 |
| Quadrant | Total seconds | Saturated seconds | Saturation percentage |
|---|---|---|---|
| A | 13597 | 139 | 1.022284% |
| B | 13597 | 170 | 1.250276% |
| C | 13597 | 193 | 1.419431% |
| D | 13597 | 155 | 1.139957% |
Noise dominated data is calculated using 1-second bins in cleaned event files. If a bin has >2000 counts, and if more than 50% of those come from <1% of pixels, then it is considered to be noise-dominated and hence unusable.
| Quadrant | # 1 sec bins | Bins with >0 counts | Bins with >2000 counts | High rate bins dominated by noise | Noise dominated (total time) | Noise dominated (detector-on time) | Marked lightcurve |
|---|---|---|---|---|---|---|---|
| A | 15698 | 13601 | 0 | 0 | 0.00% | 0.00% | 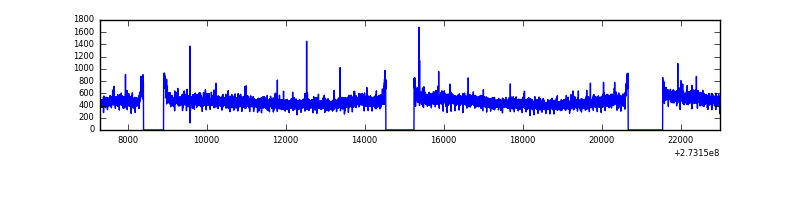 |
| B | 15698 | 13601 | 6 | 6 | 0.04% | 0.04% | 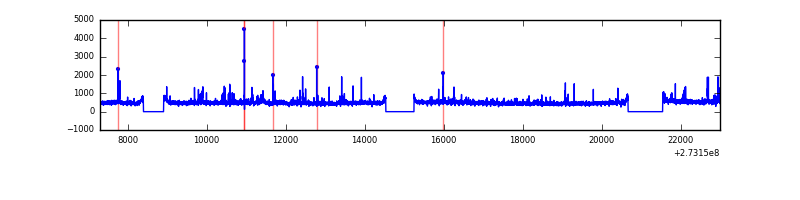 |
| C | 15698 | 13601 | 0 | 0 | 0.00% | 0.00% | 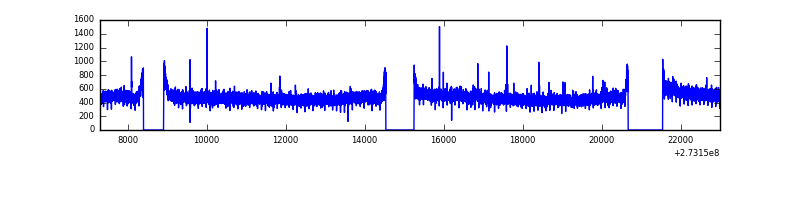 |
| D | 15698 | 13601 | 28 | 28 | 0.18% | 0.21% | 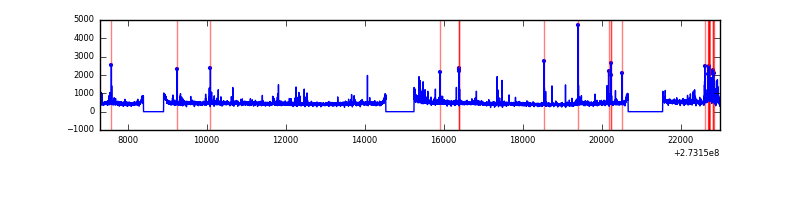 |
Top three noisy pixels from each quadrant. If the there are fewer than three noisy pixels in the level2.evt file, extra rows are filled as -1
| Pixel properties | Quadrant properties | ||||||
|---|---|---|---|---|---|---|---|
| Quadrant | DetID | PixID | Counts | Sigma | Mean | Median | Sigma |
| A | 3 | 80 | 19637 | 54.65 | 1634 | 1596 | 330.1 |
| A | 15 | 239 | 18280 | 50.54 | 1634 | 1596 | 330.1 |
| A | 0 | 226 | 14792 | 39.97 | 1634 | 1596 | 330.1 |
| B | 5 | 236 | 85142 | 267.51 | 1633 | 1592 | 312.3 |
| B | 3 | 209 | 74495 | 233.42 | 1633 | 1592 | 312.3 |
| B | 4 | 173 | 68680 | 214.8 | 1633 | 1592 | 312.3 |
| C | 14 | 238 | 240095 | 651.97 | 1567 | 1575 | 365.8 |
| C | 7 | 247 | 50653 | 134.15 | 1567 | 1575 | 365.8 |
| C | 3 | 233 | 41012 | 107.8 | 1567 | 1575 | 365.8 |
| D | 1 | 52 | 166872 | 395.15 | 1577 | 1537 | 418.4 |
| D | 13 | 172 | 141466 | 334.43 | 1577 | 1537 | 418.4 |
| D | 5 | 51 | 70792 | 165.52 | 1577 | 1537 | 418.4 |
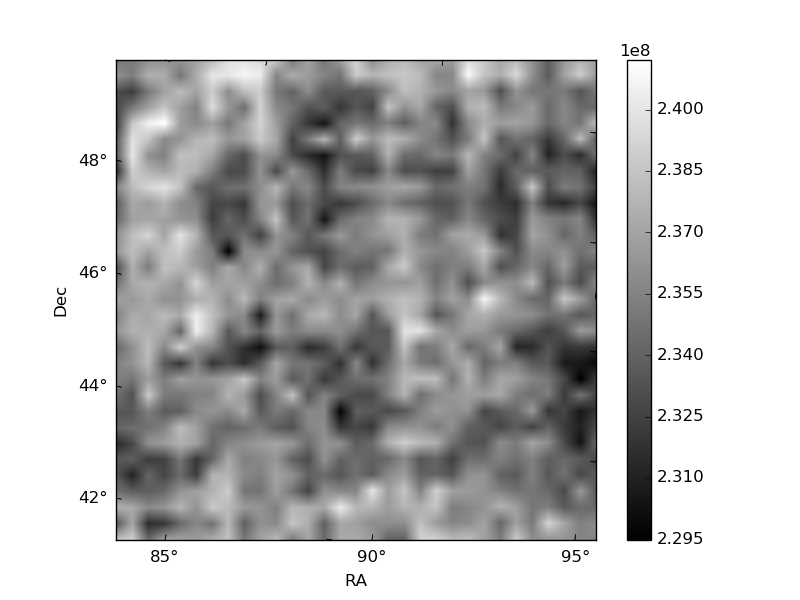
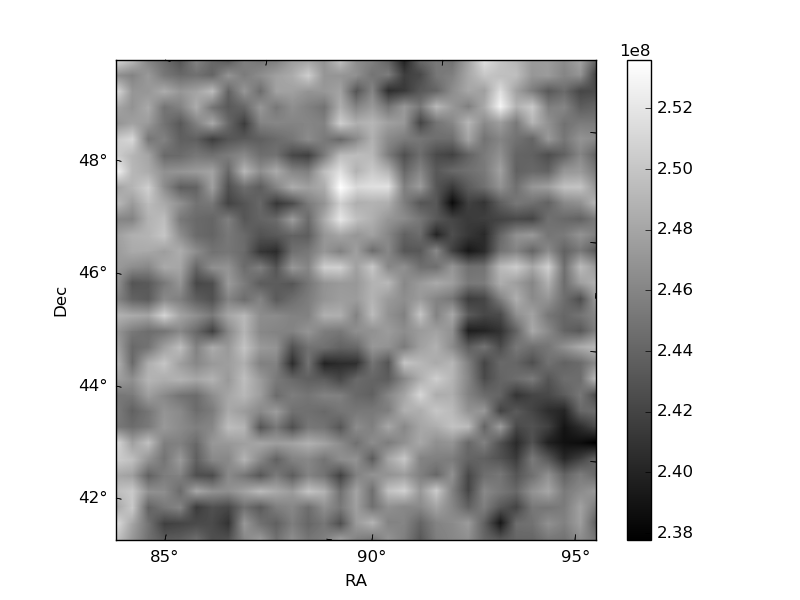
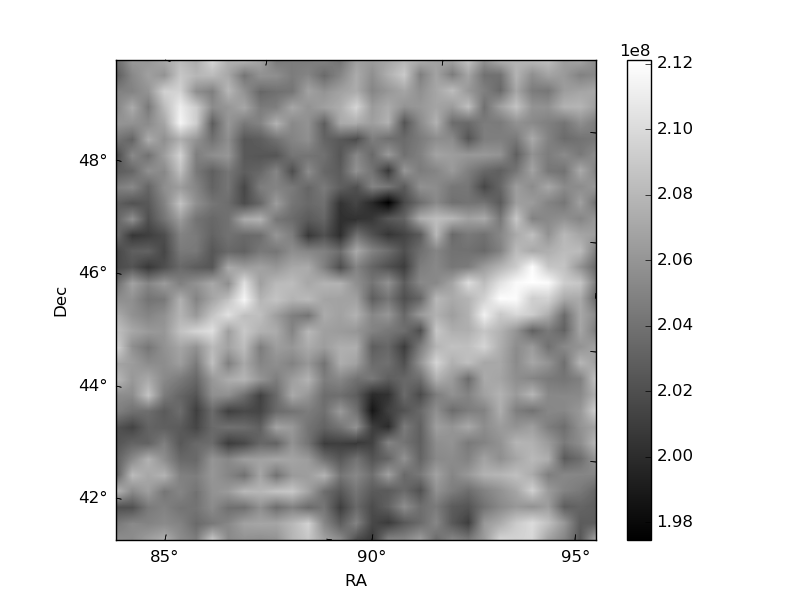
Histogram calculated using DETX and DETY for each event in the final _common_clean file
| Quadrant A | 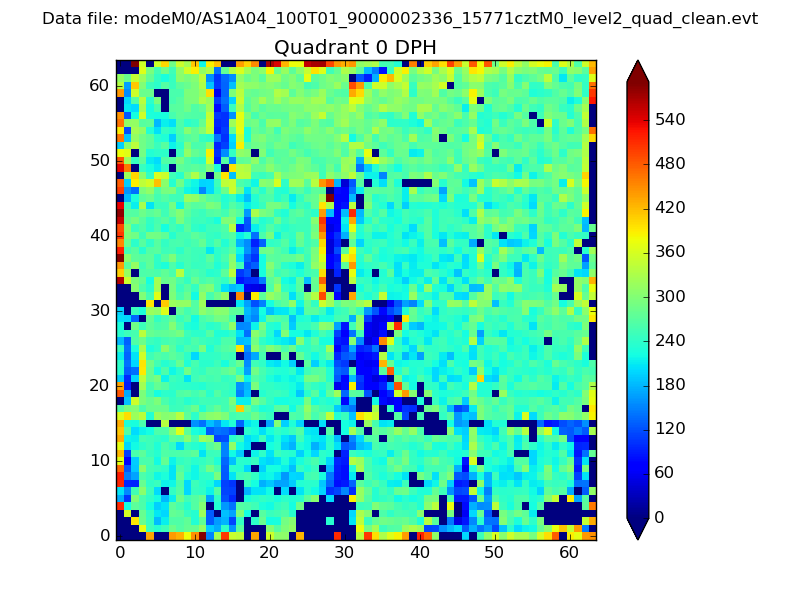 |
 |
Quadrant B |
|---|---|---|---|
| Quadrant D | 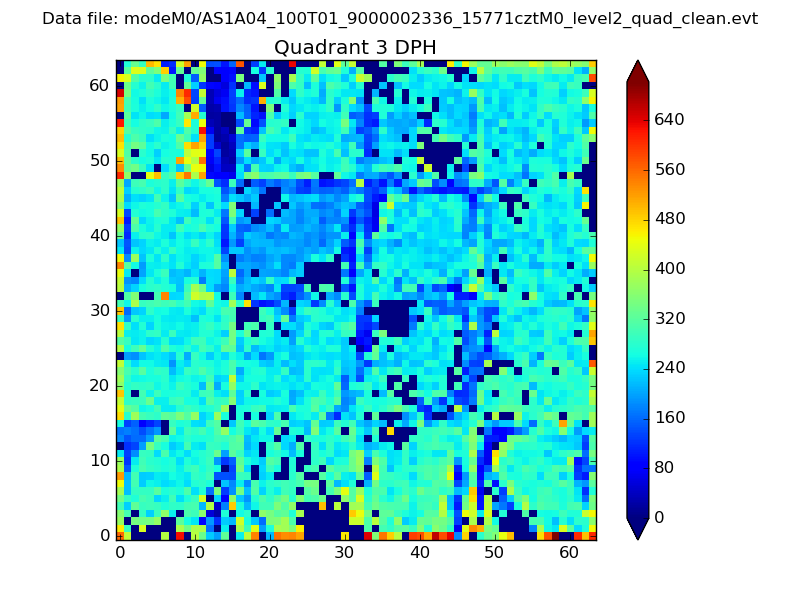 |
 |
Quadrant C |
| Plot type | Count rate plots | Images |
|---|---|---|
| Comparison with Poisson distribution Blue bars denote a histogram of data divided into 1 sec bins. Red curve is a Poisson curve with rate = median count rate of data. |
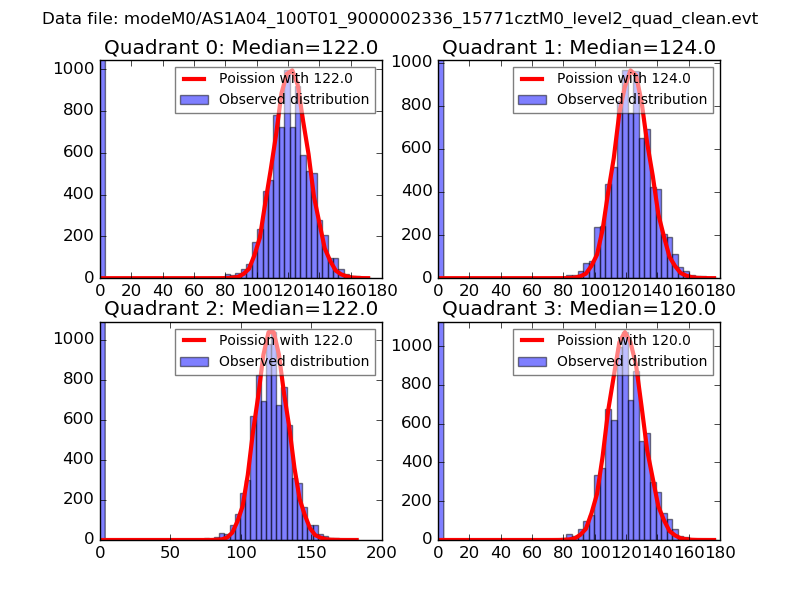 |
 |
| Quadrant-wise count rates Data is divided into 100 sec bins |
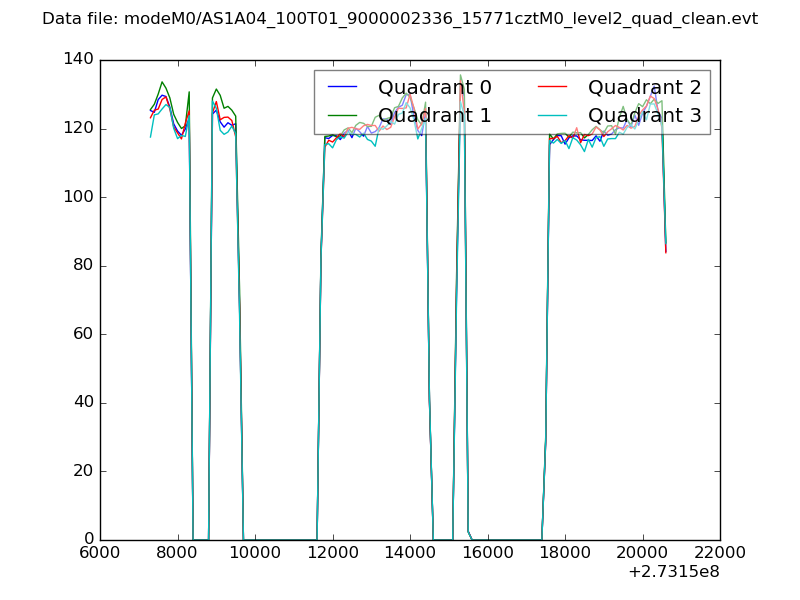 |
|
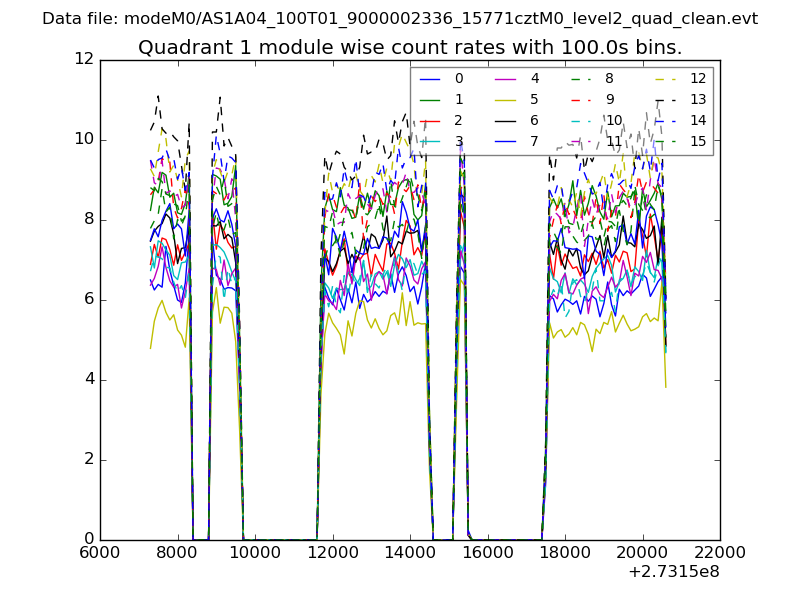
| Module-wise count rates for Quadrant A Data is divided into 100 sec bins |
 |
 |
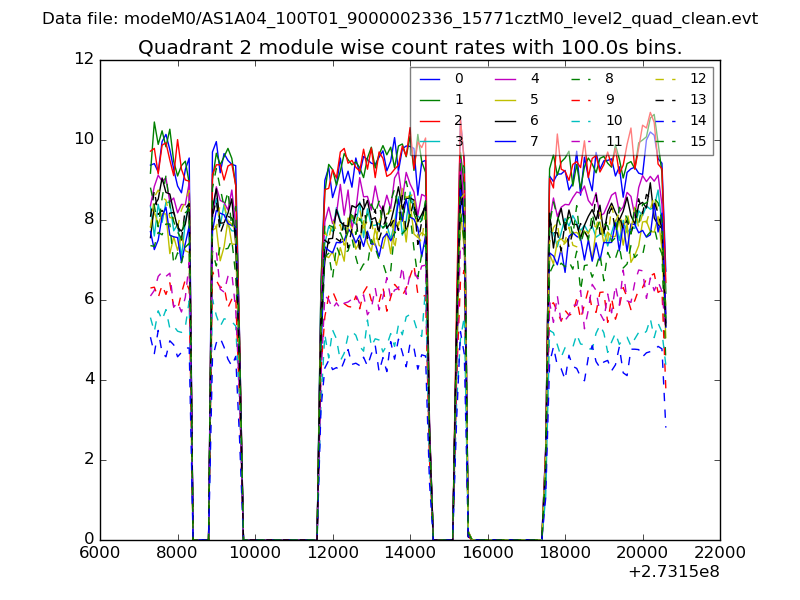
| Module-wise count rates for Quadrant B Data is divided into 100 sec bins |
 |
 |
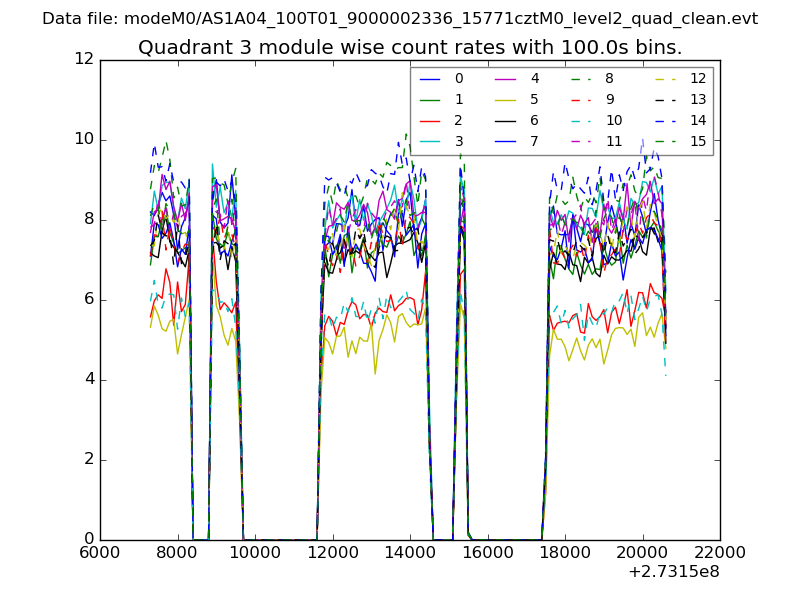
| Module-wise count rates for Quadrant C Data is divided into 100 sec bins |
 |
 |
| Module-wise count rates for Quadrant D Data is divided into 100 sec bins |
 |
 |
| Parameter | Plot |
|---|---|
| CZT HV Monitor | 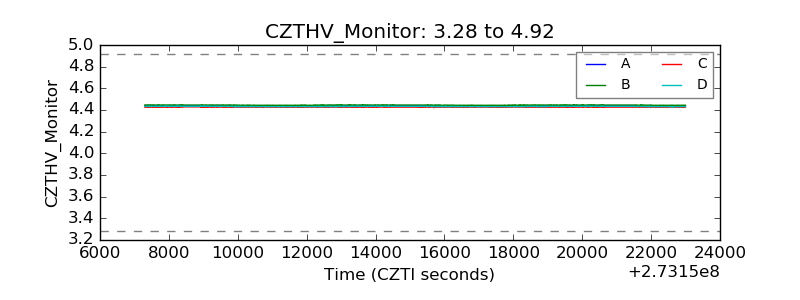 |
| D_VDD | 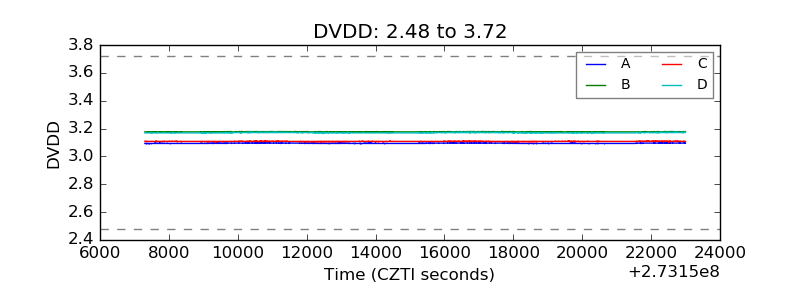 |
| Temperature 1 | 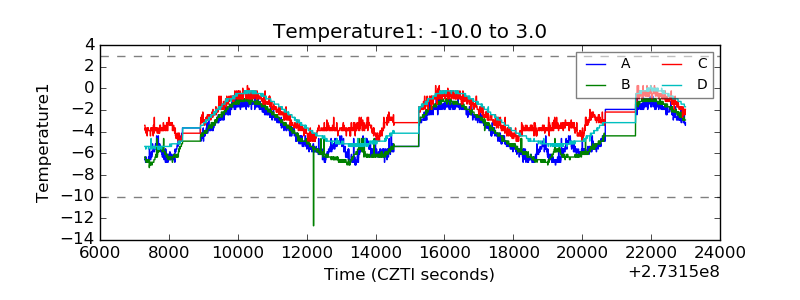 |
| Veto HV Monitor | 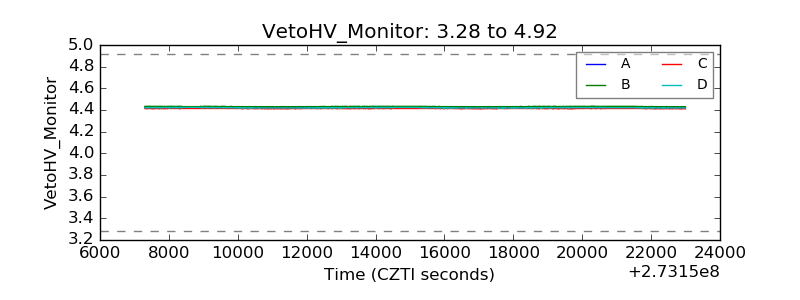 |
| Veto LLD | 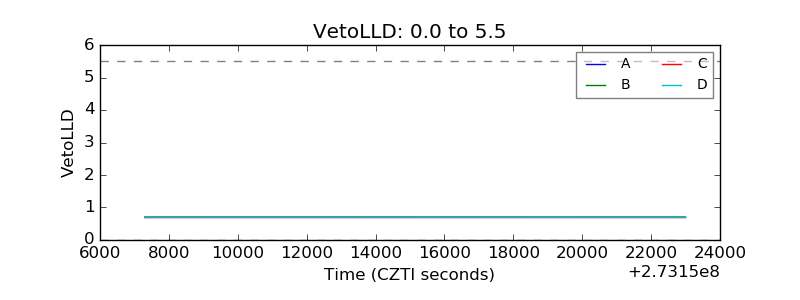 |
| Alpha Counter | 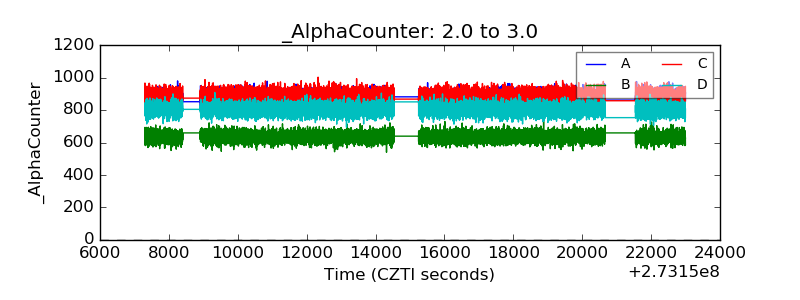 |
| _CPM_Rate | 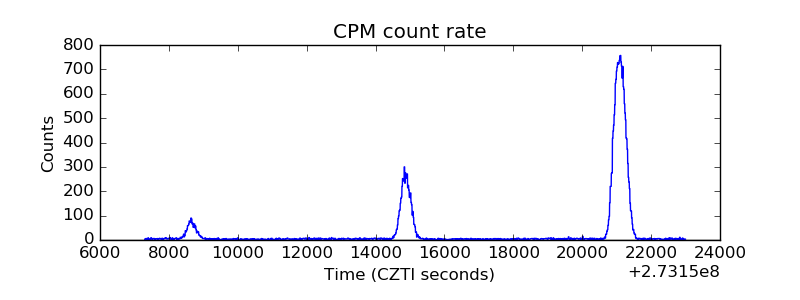 |
| CZT Counter |  |
| +2.5 Volts monitor |  |
| +5 Volts monitor |  |
| _ROLL_ROT | 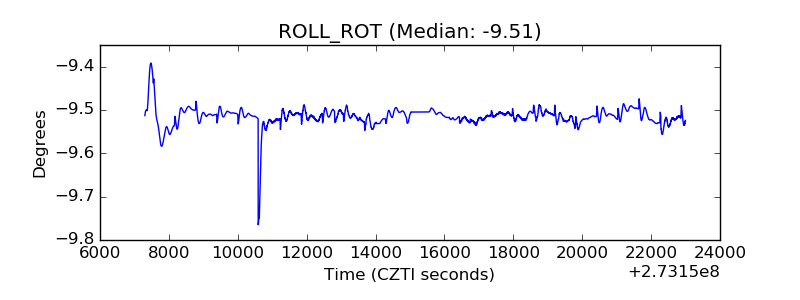 |
| _Roll_DEC | 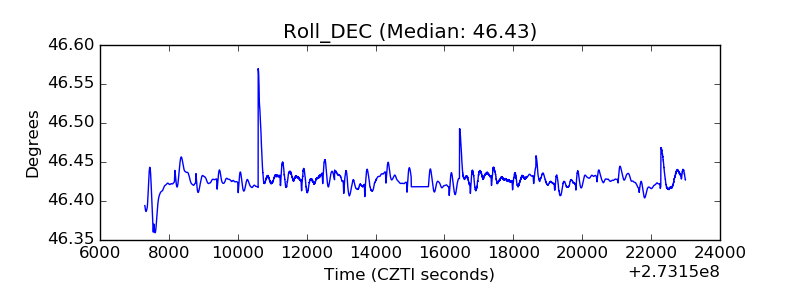 |
| _Roll_RA | 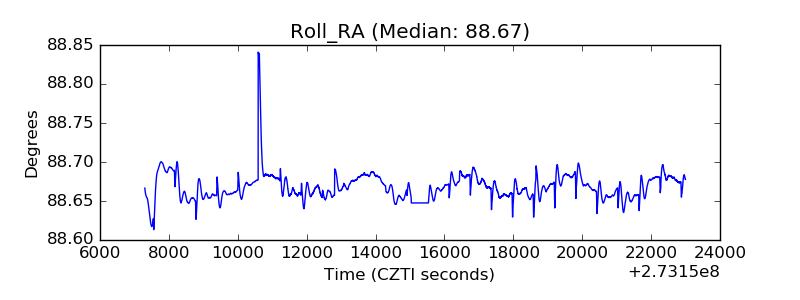 |
| Veto Counter | 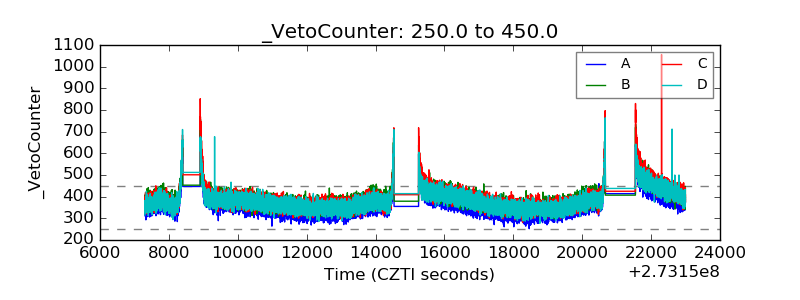 |